
Description
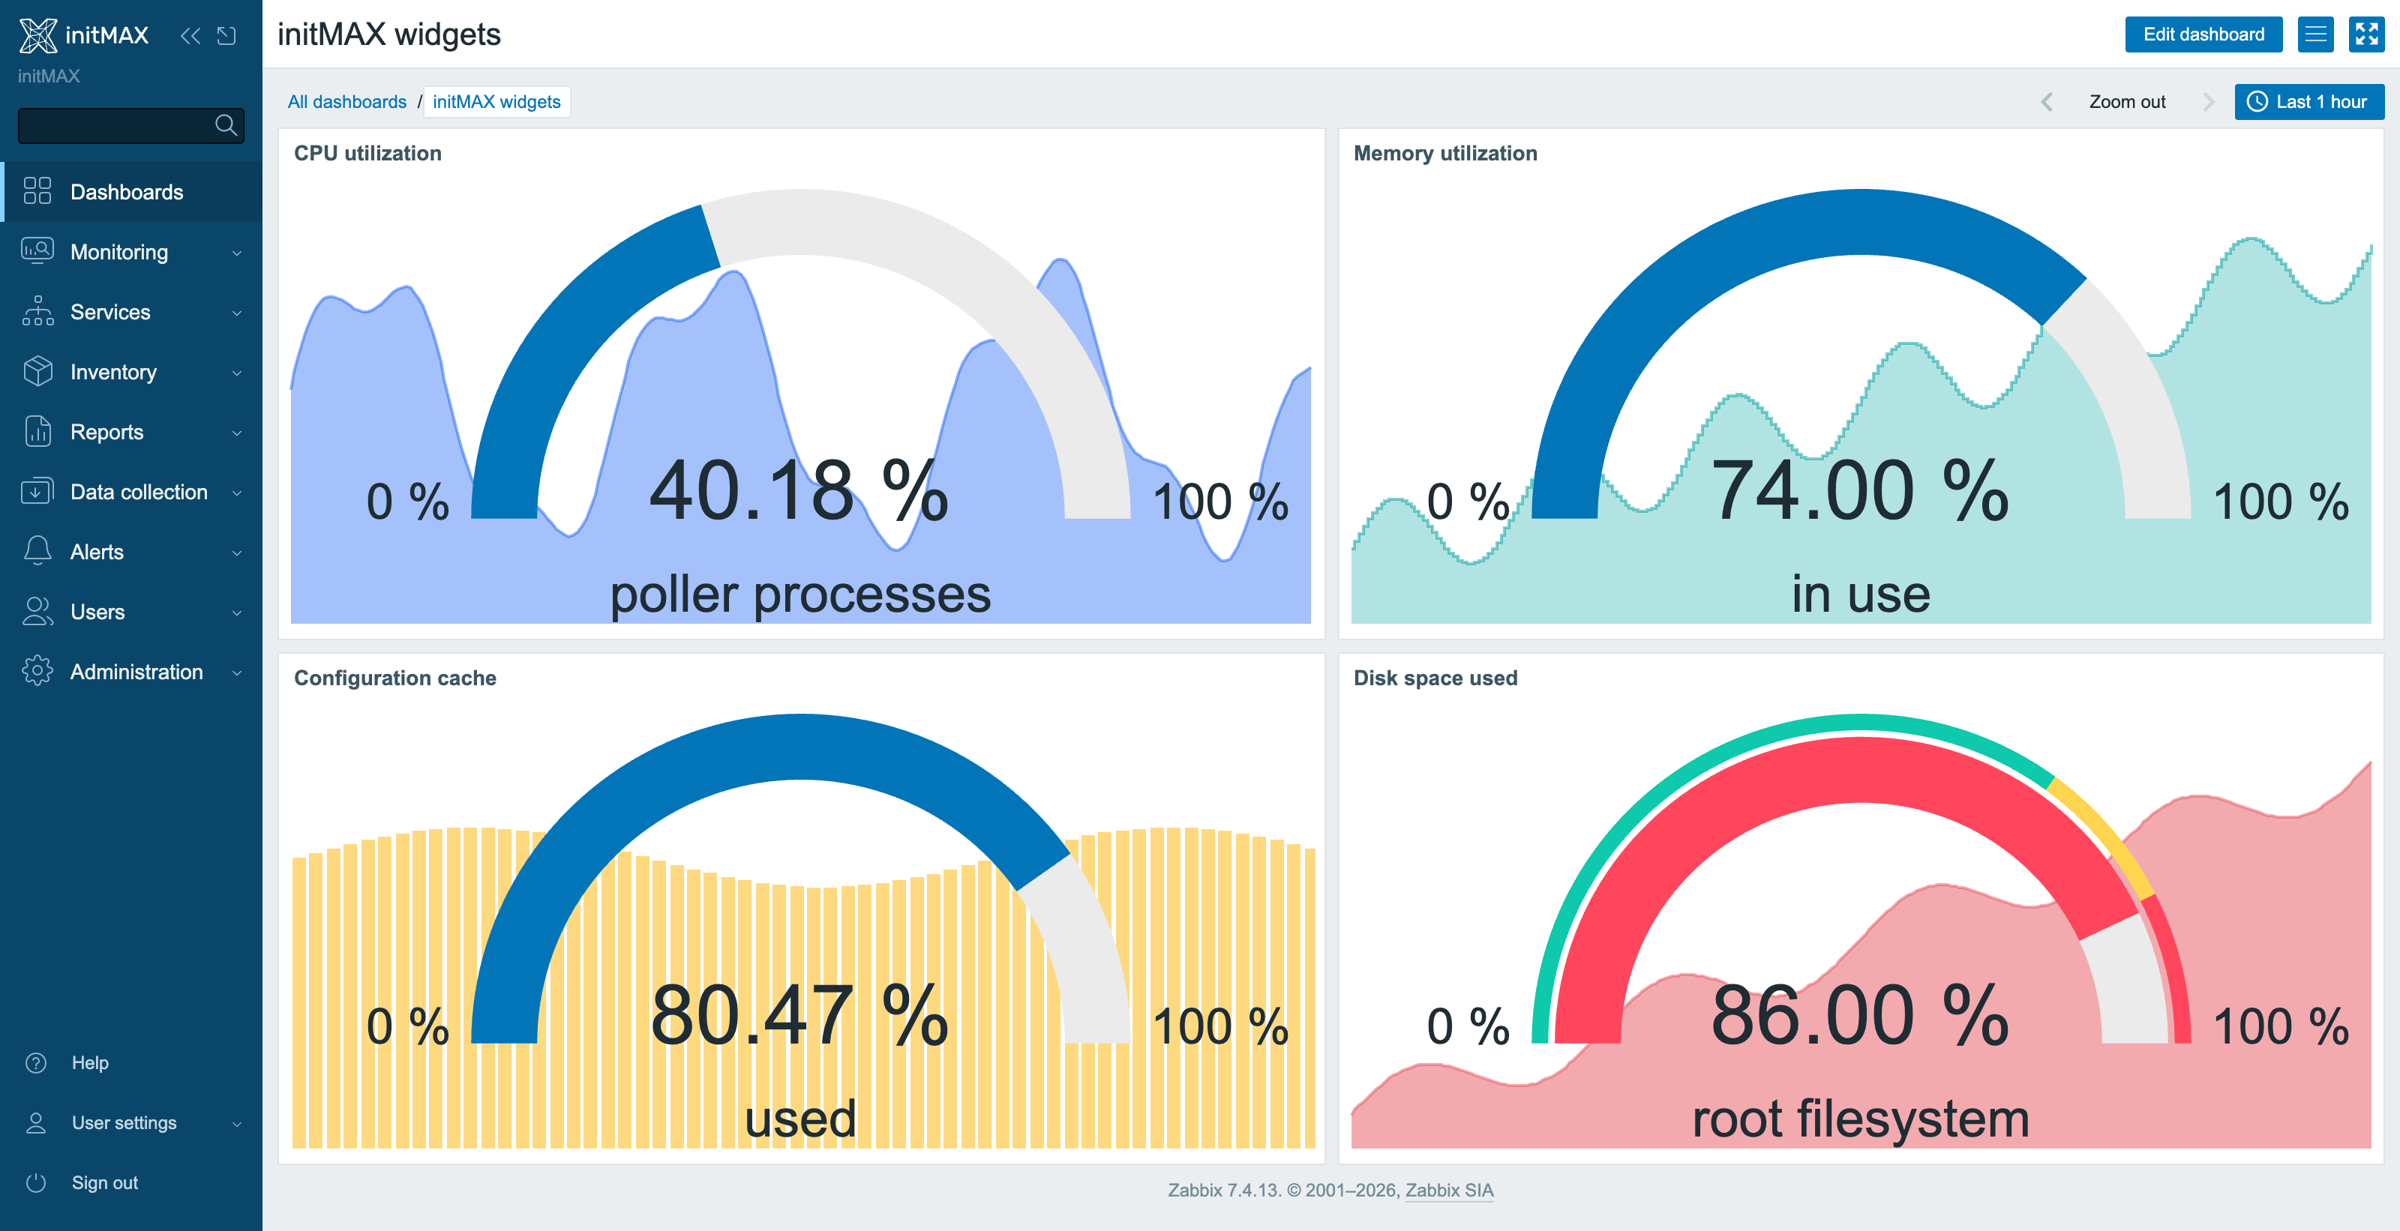
This widget enhances the “Gauge” widget by adding a historical display with a background graph. The widget shows the current value prominently, while the graph in the background visualizes historical data. It supports Zabbix 6.0 – 7.4; FREE includes the core gauge and PRO adds advanced graph controls.
Usage examples
The user wants to view the current memory utilization alongside a 7-day historical overview displayed as a line graph. The widget uses a distinct aggregation function that differentiates it from similar alternatives.
Installation
gaugeMAX is distributed as a standard deb/rpm package from our repository repo.initmax.com. The package detects your frontend version and deploys the matching module tree into it. It supports Zabbix 6.0 – 7.4 and is HA ready – multi-frontend / HA setups work out of the box, just install the package on every frontend node.
Connect to the server running the Zabbix frontend over SSH (do this on every frontend node) and pick your distribution. Would you rather have a plain archive? Every release also ships as a ZIP – FREE straight from the repository, PRO from the customer portal once you sign in – handy for offline or manual installs.
RHEL / Rocky / Alma

FREE edition
# RHEL / Rocky / Alma
rpm -Uvh https://repo.initmax.com/zabbix/release/initmax-release-latest.noarch.rpm
dnf clean all && dnf install -y zabbix-module-gaugemax
PRO edition
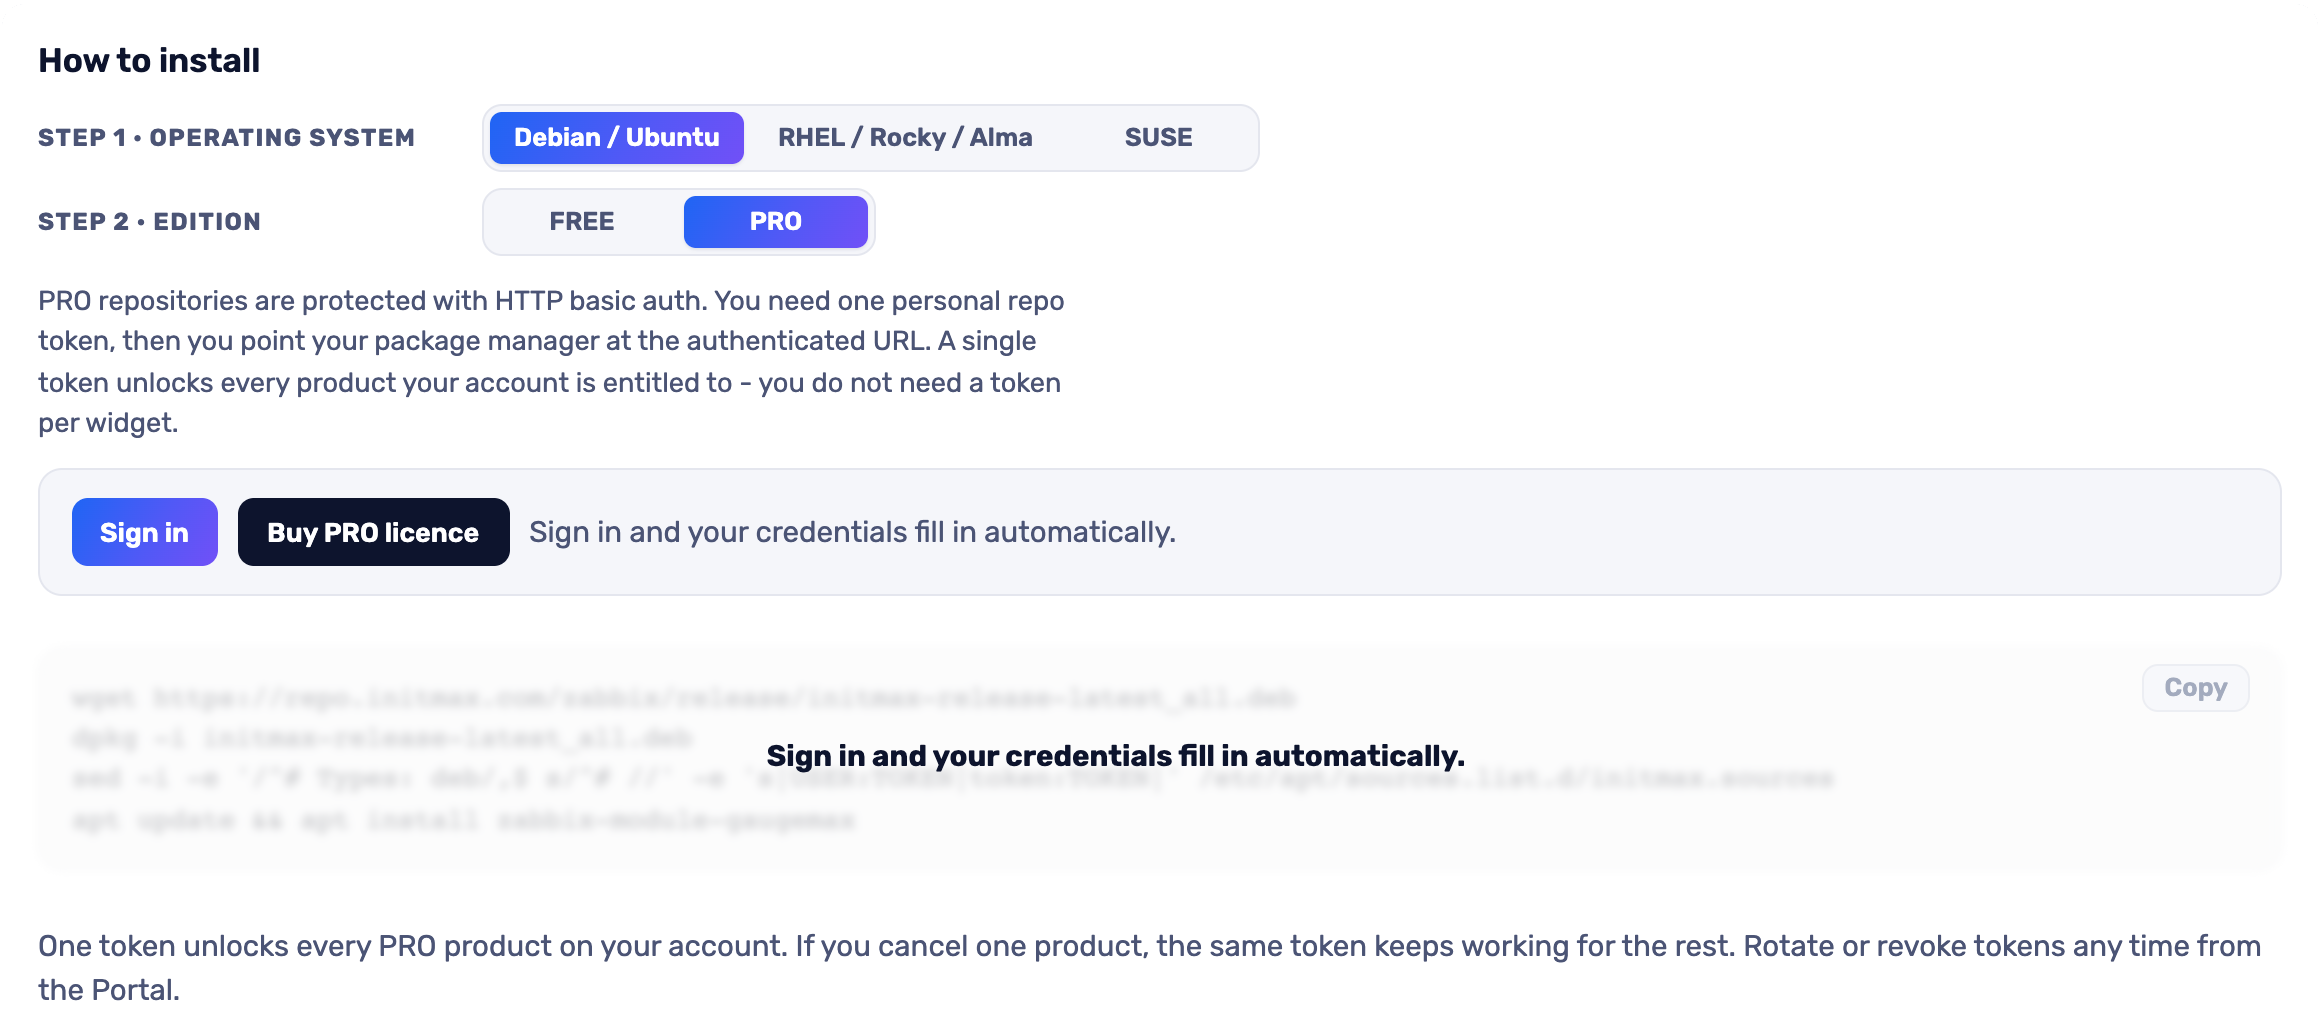
The most convenient route is the portal: pick your operating system and the PRO edition, sign in and your token is filled into the command for you – just copy it. Open the installer in the portal (the image below is clickable too).
SUSE
FREE edition
# SUSE
rpm -Uvh https://repo.initmax.com/zabbix/release/initmax-release-latest.noarch.rpm
zypper --gpg-auto-import-keys refresh && zypper install -y zabbix-module-gaugemax
PRO edition
The most convenient route is the portal: pick your operating system and the PRO edition, sign in and your token is filled into the command for you – just copy it. Open the installer in the portal (the image below is clickable too).
Debian / Ubuntu
FREE edition
# Debian / Ubuntu
wget https://repo.initmax.com/zabbix/release/initmax-release-latest_all.deb
dpkg -i initmax-release-latest_all.deb
apt update && apt install zabbix-module-gaugemax
PRO edition
The most convenient route is the portal: pick your operating system and the PRO edition, sign in and your token is filled into the command for you – just copy it. Open the installer in the portal (the image below is clickable too).
Verification
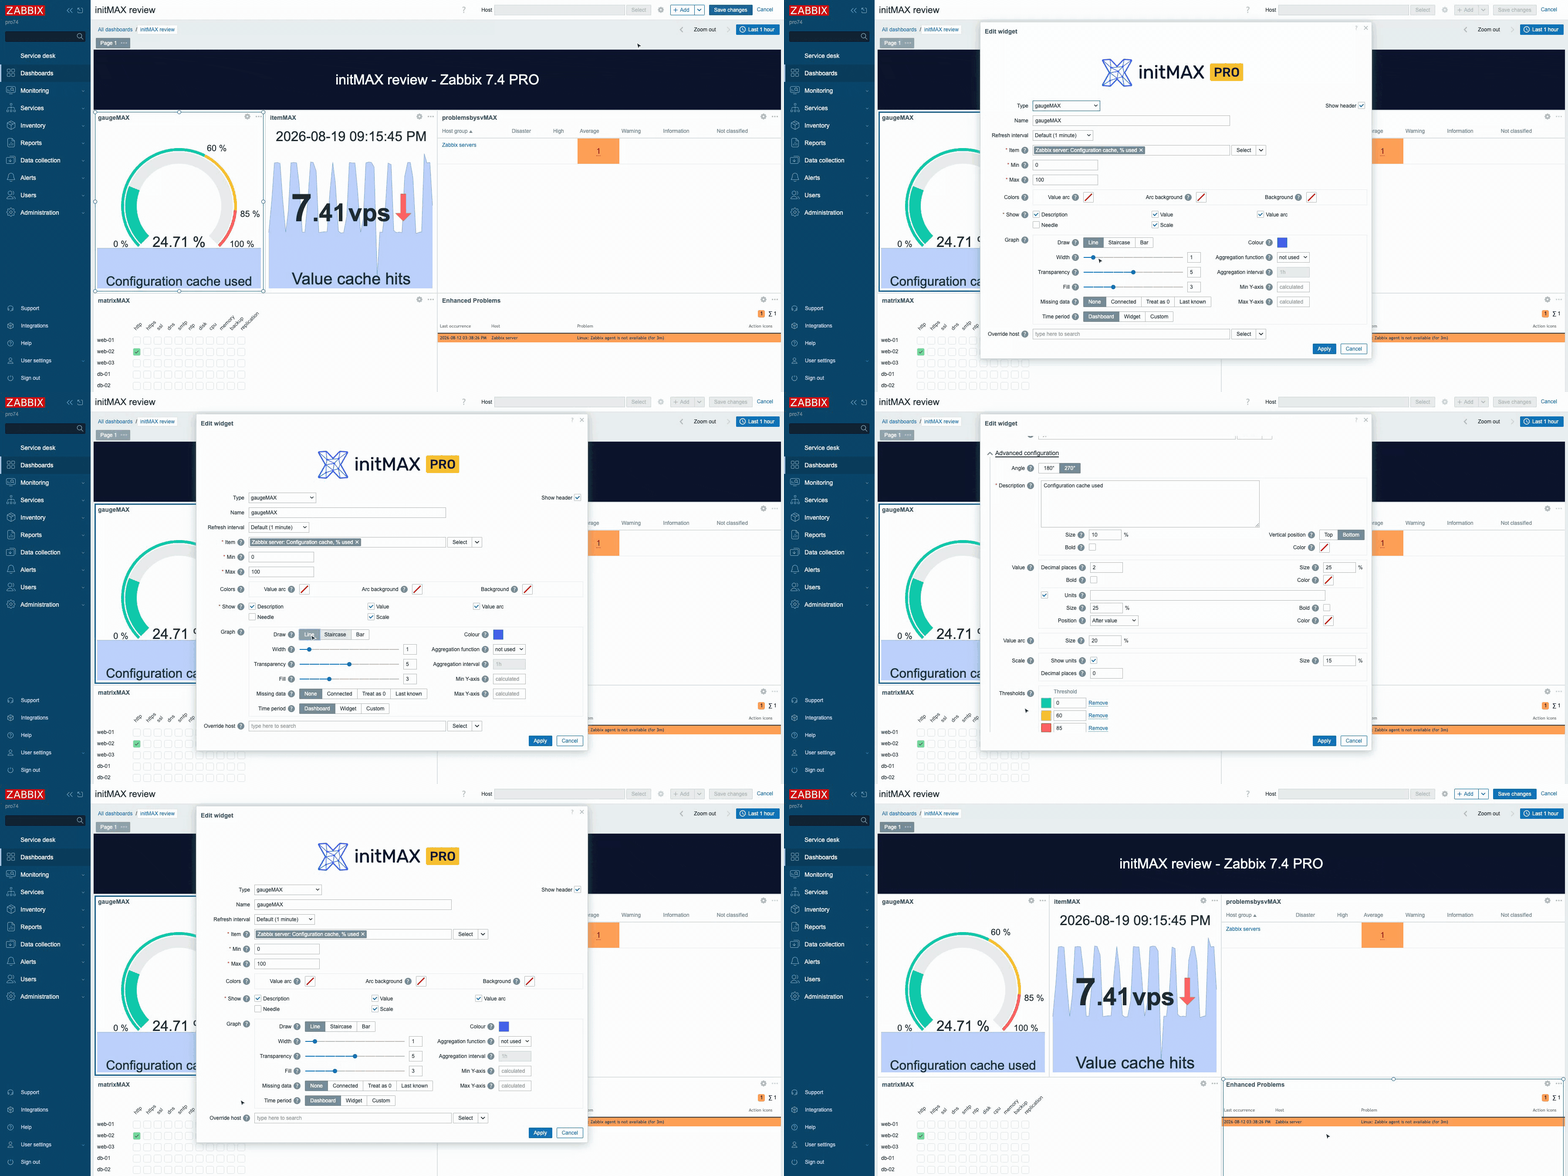
The module is enabled automatically during the package installation. You can verify it in the Zabbix frontend menu: Administration → General → Modules
If the widget was already running on that frontend (from an earlier package or from a manual installation), the package keeps its state – a module you disabled on purpose stays disabled – and the old manual copy is cleaned up as well, so the widget never shows up twice in the module list. Updates then arrive through your package manager (apt / dnf / zypper) like any other system package.
Configuration
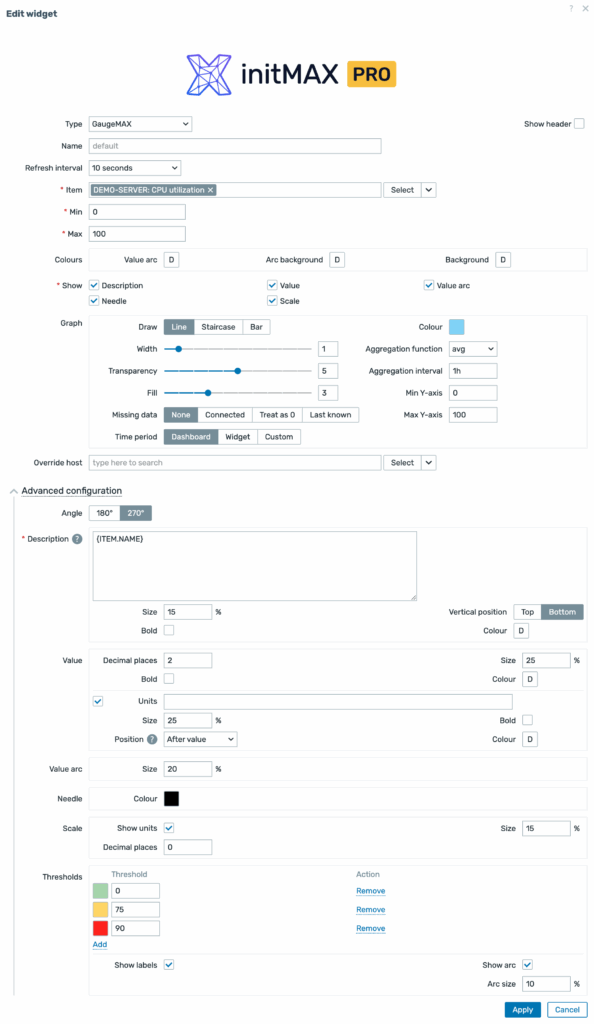
| Field | Description |
| Width | Adjust the thickness of the graph lines. |
| Transparency | Set the transparency level of the graph to better integrate with the widget’s background. |
| Fill | Adjust the fill level under the graph line for better visual distinction. |
| Color | Customize the color of the graph to match your dashboard theme. |
| Aggregation Function | Use different functions (e.g., average) to aggregate data points. |
| Aggregation Interval | Define custom intervals for data aggregation. |
| Missing Data | Choose how to handle missing data points (e.g., none, connected, treat as 0, last known). |
| Time Period | Set specific time periods for data display in the graph (e.g., Dashboard, Widget, Custom). |
| Min Y-axis | Define custom minimum values for the Y-axis. |
| Max Y-axis | Define custom maximum values for the Y-axis. |
Where to get it?
If you’re interested in this widget, you can find it in our product catalog. There you’ll learn more about the available versions and how to get the product.