
In this guide we configure APM in an existing Zabbix 8.0 LTS installation. We install ClickHouse for telemetry, enable collection on the proxy, and view application metrics, traces, and logs in Zabbix.
Architecture
OTLP is the OpenTelemetry protocol for sending metrics, traces, and logs from applications. Zabbix proxy accepts OTLP over gRPC. If an app exports only over HTTP or HTTPS, the OpenTelemetry Collector receives its telemetry and forwards it to the proxy over gRPC.
ClickHouse runs on a dedicated host in a private network. The proxy writes telemetry to it. The frontend reads it for APM views, and Zabbix server reads it for Telemetry query items. The Collector runs alongside the proxy on the same host. The main Zabbix database continues to handle configuration and regular monitoring. Synchronize the clocks on Zabbix server and ClickHouse.
Supported versions
According to the documentation checked on November 19, 2026, Zabbix 8.0 supports ClickHouse 26.8.17.4 through 26.9.x.x for APM. Check the current range before installing or upgrading. Use Zabbix 8.0 for the server, frontend, proxy, and schema package. Current Zabbix 8.0 requirements
Operating system selection
Start with the OS of the ClickHouse host. Replace the sample addresses and names in the commands with your own. For Zabbix server installation, use our installation guide.
Prepare ClickHouse for telemetry
Install ClickHouse
Run the commands in this section as root. On the dedicated ClickHouse host, add the official LTS repository and list the available version.
dnf install dnf-plugins-core curl nano
dnf config-manager --add-repo https://packages.clickhouse.com/rpm/clickhouse.repo
dnf config-manager --set-disabled clickhouse-stable
dnf config-manager --set-enabled clickhouse-lts
dnf --refresh list --available clickhouse-server clickhouse-client
Run the next command if the offered version meets the current Zabbix APM requirements. If it is outside that range, choose matching supported server and client versions from the official ClickHouse packages. On a fresh installation via dnf, the default account starts with an empty password. Set it after checking the version.
dnf install clickhouse-server clickhouse-clientInstall the Zabbix schema package
On the same ClickHouse host, add the Zabbix 8.0 repository. The zabbix-sql-scripts package provides the script that creates the APM tables.
. /etc/os-release
rpm -Uvh "https://repo.zabbix.com/zabbix/8.0/release/${ID%linux}/${VERSION_ID%%.*}/noarch/zabbix-release-latest.el${VERSION_ID%%.*}.noarch.rpm"
dnf --setopt='epel.excludepkgs=zabbix*' install zabbix-sql-scriptsConfigure access to ClickHouse
On the ClickHouse host, allow 8123/TCP for the Zabbix server, frontend, and proxy. Run the firewalld commands as root. The example uses the public zone on the private network interface.
firewall-cmd --permanent --zone=public --add-port=8123/tcp
firewall-cmd --reload
After configuring the firewall, create the following file on the ClickHouse host.
nano /etc/clickhouse-server/config.d/20-otel-listen.xml<clickhouse>
<listen_host>0.0.0.0</listen_host>
</clickhouse>0.0.0.0 listens on every IPv4 interface. It replaces the default local-only listening so the other hosts can reach the database. To listen only on a specific private IP, use that IP instead of 0.0.0.0 and add a second listen_host with 127.0.0.1 for local administration.
clickhouse-client uses port 9000 for its native SQL connection. The built-in SQL console runs at http://127.0.0.1:8123/play and uses the same accounts and permissions. access_management lets the default account manage users and access through SQL commands such as CREATE USER and GRANT. We restrict that account to local connections. ClickHouse web console
nano /etc/clickhouse-server/users.d/20-local-admin.xml<clickhouse>
<users>
<default>
<networks replace="replace">
<ip>127.0.0.1</ip>
<ip>::1</ip>
</networks>
<access_management>1</access_management>
</default>
</users>
</clickhouse>Start ClickHouse and check its version. The client connects locally as default. If the account already has a password, add --ask-password to the query.
systemctl enable clickhouse-server
systemctl restart clickhouse-server
clickhouse-client --host 127.0.0.1 --query 'SELECT version()'
Set the password for the default account
If the default account still has an empty password, run the following block in Bash and enter a new password.
read -rsp 'New password for the ClickHouse default account: ' CH_PASSWORD
printf '\n'
printf '%s' "$CH_PASSWORD" | sha256sum | cut -d ' ' -f 1
unset CH_PASSWORD
Copy the printed hash into a temporary note. Then open the configuration file as root.
nano /etc/clickhouse-server/users.d/20-local-admin.xmlReplace the entire file with the XML below. Substitute the hash you copied for SHA256_HASH and save the file.
<clickhouse>
    <users>
        <default>
            <networks replace="replace">
                <ip>127.0.0.1</ip>
                <ip>::1</ip>
            </networks>
            <access_management>1</access_management>
            <password remove="1" />
            <password_sha256_hex>SHA256_HASH</password_sha256_hex>
        </default>
    </users>
</clickhouse>
Restart ClickHouse. Use your new password when creating the database and at later prompts for the default account.
systemctl restart clickhouse-serverCreate the database and Zabbix account
In Bash on the ClickHouse host, create the otel database and run the script that creates its metrics, traces, and logs tables. The -t 604800 option sets seven-day retention.
clickhouse-client --host 127.0.0.1 --ask-password \
  --query 'CREATE DATABASE IF NOT EXISTS otel'

read -rsp 'Password for the ClickHouse default account: ' CH_PASSWORD
echo
/usr/share/zabbix/sql-scripts/clickhouse/otel_all.sh \
  -s http://127.0.0.1:8123 -d otel -u default -p "$CH_PASSWORD" -t 604800
unset CH_PASSWORD
Open the ClickHouse console. Create otel_zabbix for proxy writes and server and frontend reads. Set a new password. The last command lists the tables, including otel_traces and otel_logs.
clickhouse-client --host 127.0.0.1 --ask-password-- Enter your own password for Zabbix.
CREATE USER otel_zabbix IDENTIFIED WITH sha256_password BY 'REPLACE_OTEL_PASSWORD';
GRANT SELECT, INSERT ON otel.* TO otel_zabbix;
SHOW TABLES FROM otel;Set up ClickHouse in the Zabbix frontend
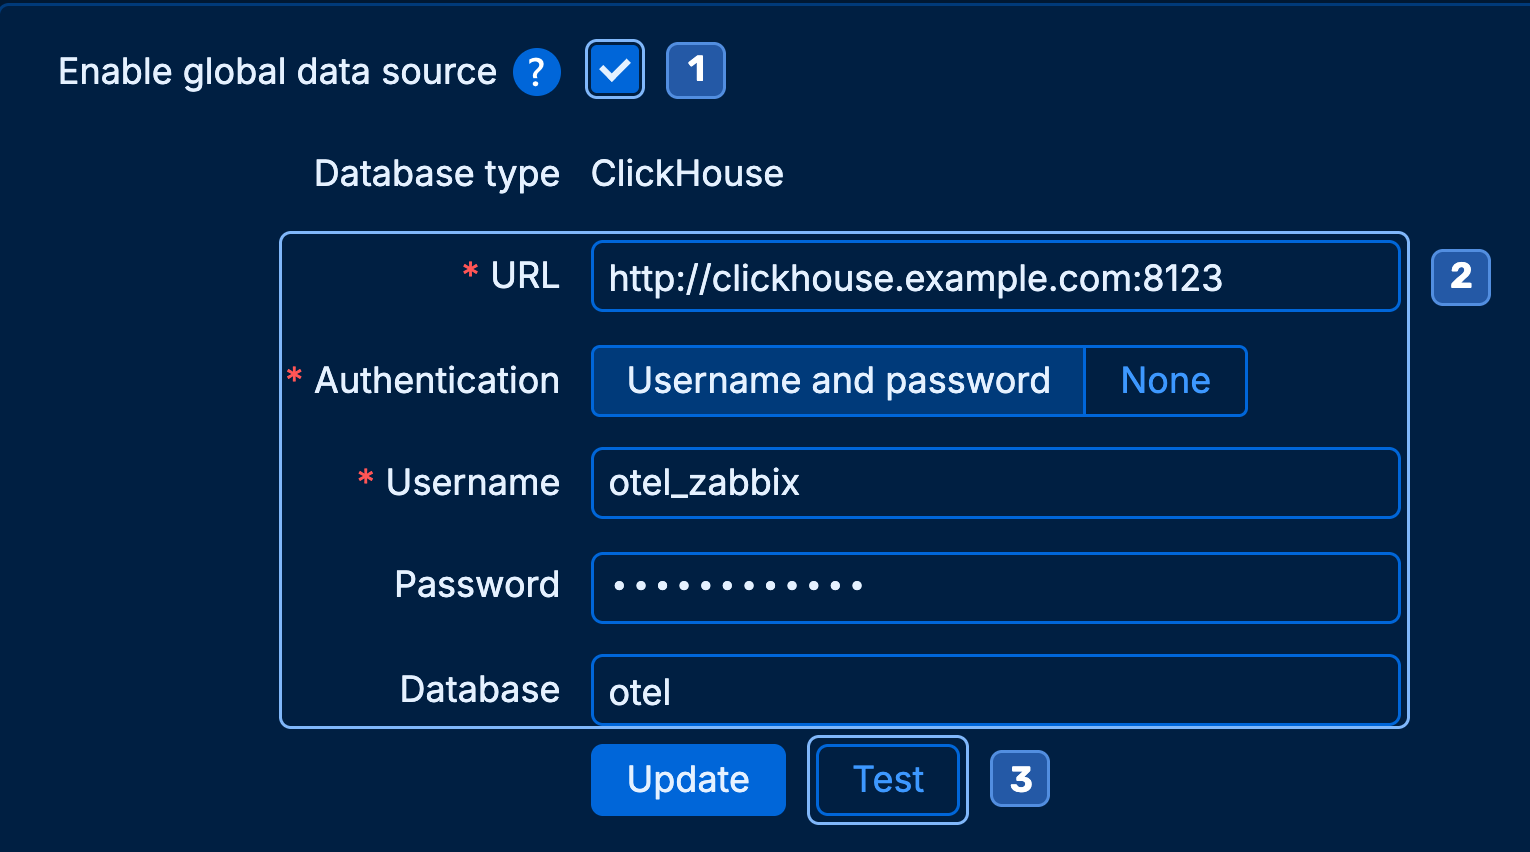
Open Administration → Data source. Under APM, select Enable global data source. Saving this form sets the shared source for proxy writes, queries on Zabbix server, and APM views in the frontend. Zabbix stores it in its main database, and the server passes the setting to the proxy during synchronization. Set TelemetryProvider in their files only if that component needs its own connection.
Click Test, then click Update after the test succeeds. The test checks the frontend’s connection to ClickHouse and requires PHP cURL.
Install Zabbix proxy with APM
Move to the Zabbix proxy host. If it runs a different OS from ClickHouse, switch the OS selection above and return to the proxy installation. Add the Zabbix 8.0 repository.
. /etc/os-release
rpm -Uvh "https://repo.zabbix.com/zabbix/8.0/release/${ID%linux}/${VERSION_ID%%.*}/noarch/zabbix-release-latest.el${VERSION_ID%%.*}.noarch.rpm"
On EL 10, the APM-capable proxy comes in a separate package with the -apm suffix. For SQLite, install zabbix-proxy-sqlite3-apm. The commands also enable CRB and EPEL for dependencies.
dnf install dnf-plugins-core

. /etc/os-release
if [ "$ID" = rhel ]; then
  subscription-manager repos --enable "codeready-builder-for-rhel-10-$(arch)-rpms"
  dnf install https://dl.fedoraproject.org/pub/epel/epel-release-latest-10.noarch.rpm
else
  dnf config-manager --set-enabled crb
  dnf install epel-release
fi

dnf --setopt='epel.excludepkgs=zabbix*' install zabbix-proxy-sqlite3-apm nano
This package supports standard agent and SNMP monitoring. It also works as a regular proxy with APM off. Set StartAPMCollector=1 to add OpenTelemetry ingestion.
Prepare ClickHouse for telemetry
Install ClickHouse
On the dedicated ClickHouse host, add the official LTS repository and list the available version.
sudo apt update
sudo apt install ca-certificates curl gnupg nano
sudo install -d -m 0755 /etc/apt/keyrings
curl -fsSL https://packages.clickhouse.com/rpm/lts/repodata/repomd.xml.key \
  | sudo gpg --dearmor -o /etc/apt/keyrings/clickhouse.gpg
ARCH=$(dpkg --print-architecture)
printf '%s\n' "deb [arch=$ARCH signed-by=/etc/apt/keyrings/clickhouse.gpg] https://packages.clickhouse.com/deb lts main" \
  | sudo tee /etc/apt/sources.list.d/clickhouse.list
sudo apt update
apt-cache policy clickhouse-server clickhouse-client
Run the next command if the offered version meets the current Zabbix APM requirements. If it is outside that range, choose matching supported server and client versions from the official ClickHouse packages. When installing interactively via apt, choose your own password at the Set up the password for the default user prompt.
sudo apt install clickhouse-server clickhouse-clientInstall the Zabbix schema package
On the same ClickHouse host, add the Zabbix 8.0 repository. The zabbix-sql-scripts package provides the script that creates the APM tables.
sudo apt update
sudo apt install curl ca-certificates
curl -fLO https://repo.zabbix.com/zabbix/8.0/release/debian/pool/main/z/zabbix-release/zabbix-release_latest_8.0+debian13_all.deb
sudo dpkg -i zabbix-release_latest_8.0+debian13_all.deb
sudo apt update
sudo apt install zabbix-sql-scriptsConfigure access to ClickHouse
The firewall commands in this guide assume that firewalld is running on the host named in each step. To set up a firewall on Debian 13 with firewalld, install and start it as shown below. If you already manage the firewall with another tool, allow the same ports there.
sudo apt install firewalld
sudo systemctl enable --now firewalld
On the ClickHouse host, allow 8123/TCP for the Zabbix server, frontend, and proxy. Run the firewalld commands as root. The example uses the public zone on the private network interface.
firewall-cmd --permanent --zone=public --add-port=8123/tcp
firewall-cmd --reload
After configuring the firewall, create the following file on the ClickHouse host.
nano /etc/clickhouse-server/config.d/20-otel-listen.xml<clickhouse>
<listen_host>0.0.0.0</listen_host>
</clickhouse>0.0.0.0 listens on every IPv4 interface. It replaces the default local-only listening so the other hosts can reach the database. To listen only on a specific private IP, use that IP instead of 0.0.0.0 and add a second listen_host with 127.0.0.1 for local administration.
clickhouse-client uses port 9000 for its native SQL connection. The built-in SQL console runs at http://127.0.0.1:8123/play and uses the same accounts and permissions. access_management lets the default account manage users and access through SQL commands such as CREATE USER and GRANT. We restrict that account to local connections. ClickHouse web console
nano /etc/clickhouse-server/users.d/20-local-admin.xml<clickhouse>
<users>
<default>
<networks replace="replace">
<ip>127.0.0.1</ip>
<ip>::1</ip>
</networks>
<access_management>1</access_management>
</default>
</users>
</clickhouse>Start ClickHouse and check its version. When prompted, enter the password you set for the default account during installation.
sudo systemctl enable clickhouse-server
sudo systemctl restart clickhouse-server
clickhouse-client --host 127.0.0.1 --ask-password --query 'SELECT version()'
If the installer did not ask for a password
On a fresh installation with an empty password, check the version without --ask-password. Then run the following block in Bash and enter a new password.
read -rsp 'New password for the ClickHouse default account: ' CH_PASSWORD
printf '\n'
printf '%s' "$CH_PASSWORD" | sha256sum | cut -d ' ' -f 1
unset CH_PASSWORD
Copy the printed hash into a temporary note. Then open the configuration file as root.
nano /etc/clickhouse-server/users.d/20-local-admin.xmlReplace the entire file with the XML below. Substitute the hash you copied for SHA256_HASH and save the file.
<clickhouse>
    <users>
        <default>
            <networks replace="replace">
                <ip>127.0.0.1</ip>
                <ip>::1</ip>
            </networks>
            <access_management>1</access_management>
            <password remove="1" />
            <password_sha256_hex>SHA256_HASH</password_sha256_hex>
        </default>
    </users>
</clickhouse>
Restart ClickHouse. Use your new password when creating the database and at later prompts for the default account.
sudo systemctl restart clickhouse-serverCreate the database and Zabbix account
In Bash on the ClickHouse host, create the otel database and run the script that creates its metrics, traces, and logs tables. The -t 604800 option sets seven-day retention.
clickhouse-client --host 127.0.0.1 --ask-password \
  --query 'CREATE DATABASE IF NOT EXISTS otel'

read -rsp 'Password for the ClickHouse default account: ' CH_PASSWORD
echo
/usr/share/zabbix/sql-scripts/clickhouse/otel_all.sh \
  -s http://127.0.0.1:8123 -d otel -u default -p "$CH_PASSWORD" -t 604800
unset CH_PASSWORD
Open the ClickHouse console. Create otel_zabbix for proxy writes and server and frontend reads. Set a new password. The last command lists the tables, including otel_traces and otel_logs.
clickhouse-client --host 127.0.0.1 --ask-password-- Enter your own password for Zabbix.
CREATE USER otel_zabbix IDENTIFIED WITH sha256_password BY 'REPLACE_OTEL_PASSWORD';
GRANT SELECT, INSERT ON otel.* TO otel_zabbix;
SHOW TABLES FROM otel;Set up ClickHouse in the Zabbix frontend
Open Administration → Data source. Under APM, select Enable global data source. Saving this form sets the shared source for proxy writes, queries on Zabbix server, and APM views in the frontend. Zabbix stores it in its main database, and the server passes the setting to the proxy during synchronization. Set TelemetryProvider in their files only if that component needs its own connection.
Click Test, then click Update after the test succeeds. The test checks the frontend’s connection to ClickHouse and requires PHP cURL.
Install Zabbix proxy with APM
Move to the Zabbix proxy host. If it runs a different OS from ClickHouse, switch the OS selection above and return to the proxy installation. Add the Zabbix 8.0 repository.
sudo apt update
sudo apt install curl ca-certificates
curl -fLO https://repo.zabbix.com/zabbix/8.0/release/debian/pool/main/z/zabbix-release/zabbix-release_latest_8.0+debian13_all.deb
sudo dpkg -i zabbix-release_latest_8.0+debian13_all.deb
sudo apt update
On Debian 13, APM support is built into zabbix-proxy-sqlite3.
sudo apt install zabbix-proxy-sqlite3 nanoThis package supports standard agent and SNMP monitoring. It also works as a regular proxy with APM off. Set StartAPMCollector=1 to add OpenTelemetry ingestion.
Start the proxy and enable APM collection
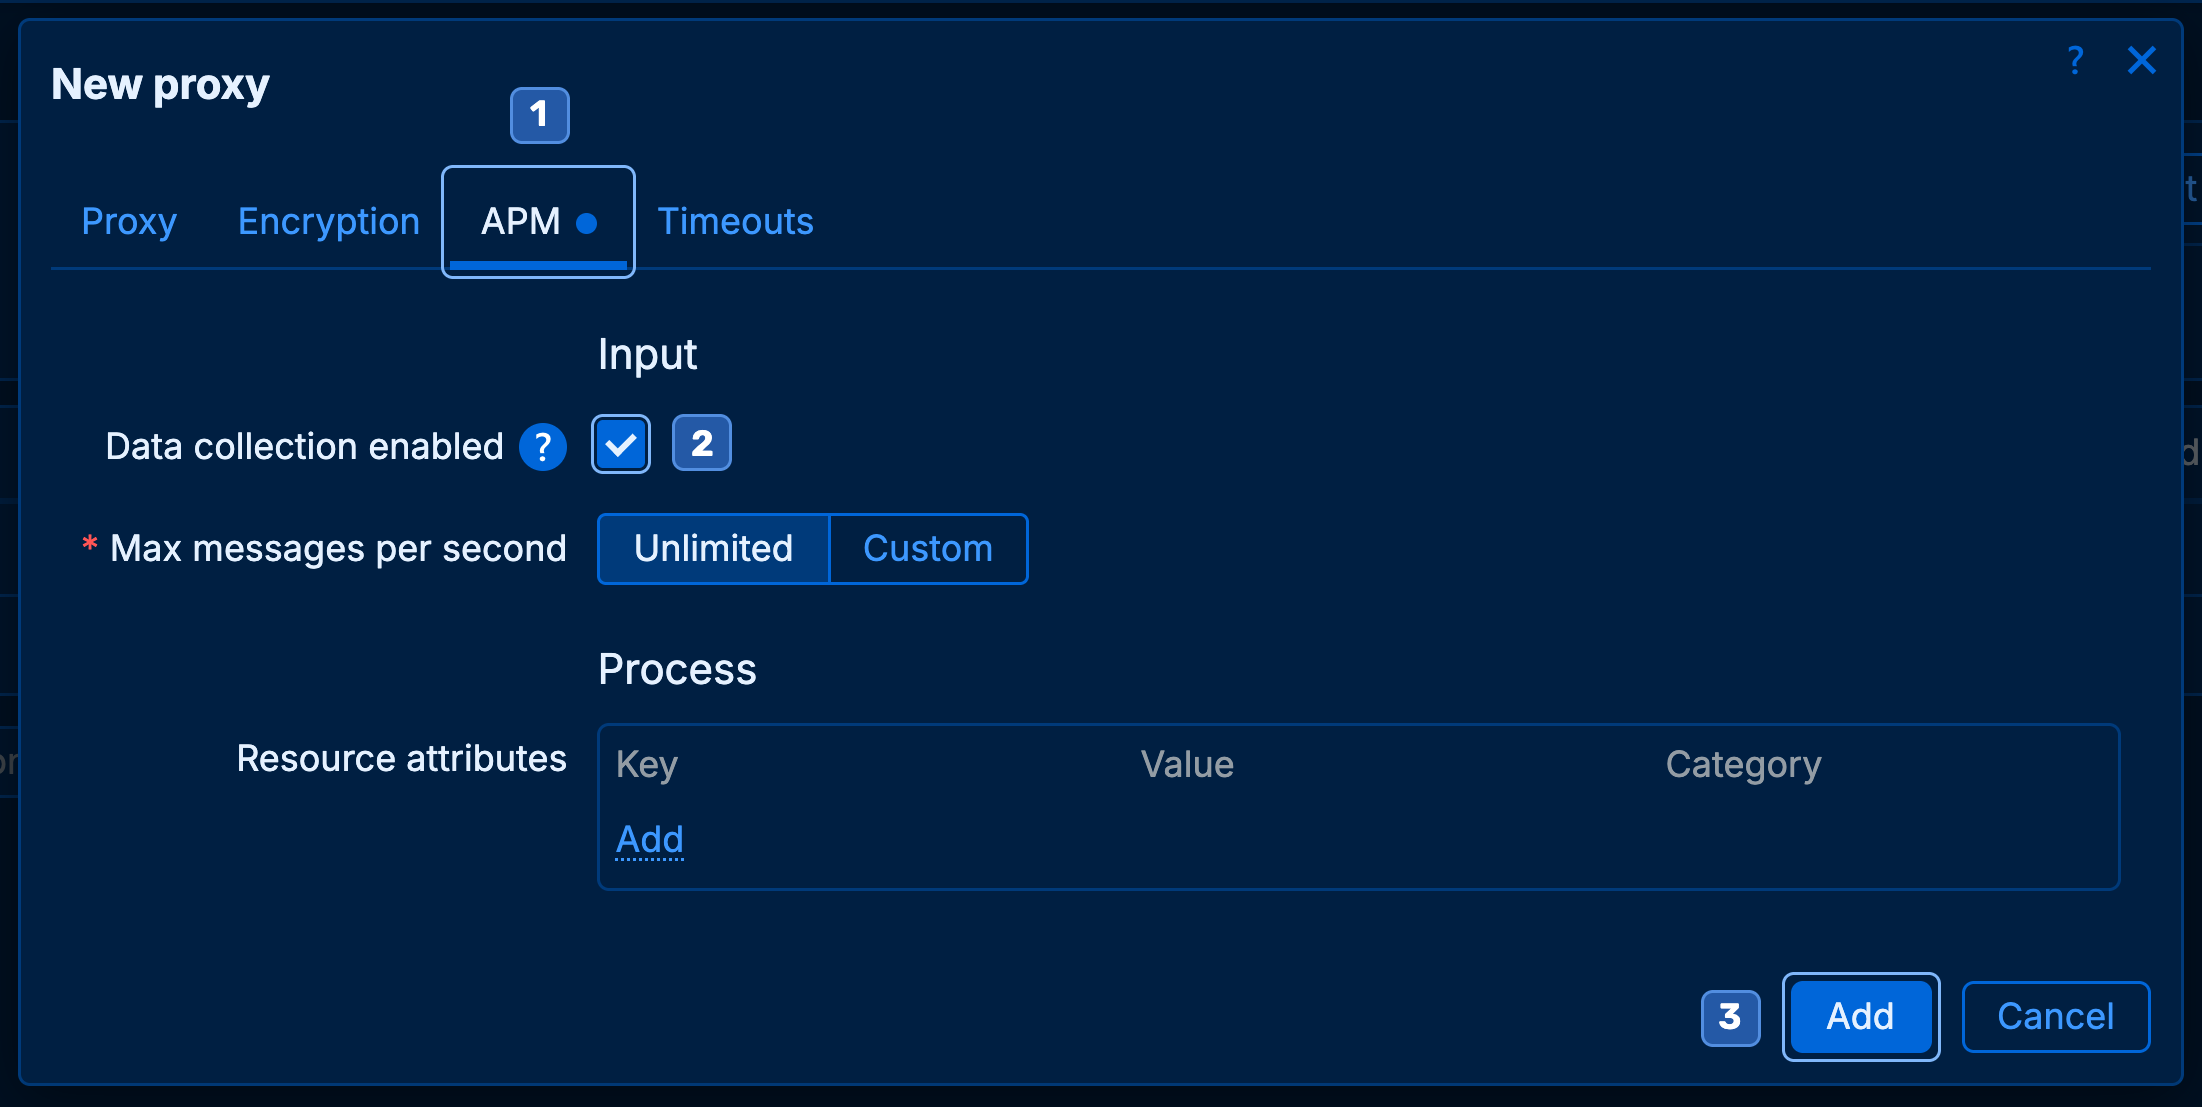
Open Administration → Proxies → Create proxy. Enter apm-proxy as the name and select Active. In Proxy address, enter the source IP from which the proxy connects to the server. Under APM, enable Data collection enabled and click Add.
Run the system administration commands in the shared steps as root on the host specified in each step.
To configure SQLite, edit only DBName in /etc/zabbix/zabbix_proxy.conf. Enter the full path to the .sqlite file. The proxy automatically creates the database file on its first start and manages it thereafter.
For a running proxy, keep its current DBName value. For a new proxy, use a persistent directory writable by the zabbix user. If you do not already have one, create /var/lib/zabbix with the command below.
install -d -o zabbix -g zabbix -m 0750 /var/lib/zabbixOn the proxy host, open the configuration in Nano. Edit these settings in place and keep the rest of the package configuration. Replace Server with your Zabbix server address. Hostname must match the proxy name in the frontend.
nano /etc/zabbix/zabbix_proxy.conf# …
Server=zabbix.example.com
Hostname=apm-proxy
DBName=/var/lib/zabbix/zabbix_proxy.sqlite
StartAPMCollector=1
APMListenIP=0.0.0.0
# …The default 0.0.0.0 lets the proxy accept OTLP/gRPC on all IPv4 interfaces on port 4317. A Collector on the same host connects to 127.0.0.1:4317. If the local Collector is the only sender, keep inbound 4317/TCP from other hosts blocked at the firewall.
Before starting the proxy, allow the zabbix-server service (10051/TCP) on the Zabbix server. Skip this block if you already enabled the service during server installation.
firewall-cmd --permanent --zone=public --add-service=zabbix-serverFor direct OTLP/gRPC from another host, allow inbound 4317/TCP on the proxy host. The command opens the port for the entire public zone. This example assumes a private network for the senders.
firewall-cmd --permanent --zone=public --add-port=4317/tcpAfter adding the rules, reload the firewall once on each host where you changed the rules.
firewall-cmd --reloadValidate the configuration and start the service. In Administration → Proxies, check that Last seen (age) updates for the proxy.
zabbix_proxy -T
systemctl enable zabbix-proxy
systemctl restart zabbix-proxy
On its first configuration sync, Zabbix proxy receives the APM collection setting and global data source from Zabbix server. With StartAPMCollector=1, it then starts the OTLP/gRPC receiver automatically on port 4317.
Connect an application over HTTP or HTTPS
An application using OTLP/HTTP sends data to the OpenTelemetry Collector. The Collector forwards it to Zabbix proxy over OTLP/gRPC. If your applications send telemetry directly to the proxy over gRPC, you can skip to the gRPC test.
Collector configuration for HTTP only
On the proxy host, save the configuration to /etc/otelcol-contrib/config.yaml first. The package’s default configuration uses port 4317, which Zabbix proxy uses in this guide.
mkdir -p /etc/otelcol-contrib
nano /etc/otelcol-contrib/config.yaml
receivers:
otlp:
protocols:
http:
endpoint: 0.0.0.0:4318
processors:
batch: {}
exporters:
otlp_grpc/zabbix:
endpoint: 127.0.0.1:4317
tls:
insecure: true
service:
pipelines:
traces:
receivers: [otlp]
processors: [batch]
exporters: [otlp_grpc/zabbix]
metrics:
receivers: [otlp]
processors: [batch]
exporters: [otlp_grpc/zabbix]
logs:
receivers: [otlp]
processors: [batch]
exporters: [otlp_grpc/zabbix]Receivers defines where the Collector accepts data. 0.0.0.0:4318 makes the receiver available on the proxy host’s network interfaces. Exporters defines where the Collector sends data. 127.0.0.1:4317 is the local Zabbix proxy gRPC receiver. The pipelines connect reception, batching, and export separately for traces, metrics, and logs.
Install and start the Collector
When switching from the earlier container setup, stop the old Collector first so the service can use its port.
Install the official otelcol-contrib package. It includes a systemd unit. The commands below use x86-64 packages. On ARM64, use the package with arm64 in the filename in place of amd64.
Alma/CentOS/RHEL/Rocky 10
dnf install https://github.com/open-telemetry/opentelemetry-collector-releases/releases/download/v0.165.0/otelcol-contrib_0.165.0_linux_amd64.rpmDebian 13. The --force-confold option preserves the configuration you created above.
curl -fLO https://github.com/open-telemetry/opentelemetry-collector-releases/releases/download/v0.165.0/otelcol-contrib_0.165.0_linux_amd64.deb
dpkg --force-confold -i otelcol-contrib_0.165.0_linux_amd64.deb
Allow 4318/TCP for OTLP over HTTP on the Collector host.
firewall-cmd --permanent --zone=public --add-port=4318/tcp
firewall-cmd --reload
Start otelcol-contrib and enable it at boot.
systemctl enable --now otelcol-contribConfigure the application to send telemetry
On the host running the application that sends telemetry, set these OpenTelemetry SDK variables in the application’s process environment. In OTEL_EXPORTER_OTLP_ENDPOINT, replace collector.example.com with the Collector host’s DNS name or IP address. In this guide, the Collector runs on the proxy host.
OTEL_SERVICE_NAME=checkout-demo
OTEL_EXPORTER_OTLP_PROTOCOL=http/protobuf
OTEL_EXPORTER_OTLP_ENDPOINT=http://collector.example.com:4318
Collector configuration for HTTP and HTTPS
On the Collector host, open /etc/otelcol-contrib/config.yaml. The complete example below keeps HTTP on port 4318 and adds HTTPS on port 8443. Both receivers run at the same time and forward traces, metrics, and logs to the same Zabbix proxy.
nano /etc/otelcol-contrib/config.yamlreceivers:
otlp/http:
protocols:
http:
endpoint: 0.0.0.0:4318
otlp/https:
protocols:
http:
endpoint: 0.0.0.0:8443
tls:
cert_file: /etc/otelcol-contrib/tls/collector.crt
key_file: /etc/otelcol-contrib/tls/collector.key
processors:
batch: {}
exporters:
otlp_grpc/zabbix:
endpoint: 127.0.0.1:4317
tls:
insecure: true
service:
pipelines:
traces:
receivers: [otlp/http, otlp/https]
processors: [batch]
exporters: [otlp_grpc/zabbix]
metrics:
receivers: [otlp/http, otlp/https]
processors: [batch]
exporters: [otlp_grpc/zabbix]
logs:
receivers: [otlp/http, otlp/https]
processors: [batch]
exporters: [otlp_grpc/zabbix]The service runs as the otelcol-contrib user. Put the certificate and key at the paths shown above and make both files readable by this user. You can use root:otelcol-contrib ownership and mode 0640 for the key.
For HTTPS only, remove the entire otlp/http receiver from the configuration and set receivers: [otlp/https] in all three pipelines.
Allow 8443/TCP on the Collector host.
firewall-cmd --permanent --zone=public --add-port=8443/tcpWhen switching to HTTPS only, remove the firewall rule for 4318/TCP if it was added solely for this Collector.
After saving the configuration, reload the firewall and restart the Collector.
firewall-cmd --reload
systemctl restart otelcol-contrib
On the host running the application that sends telemetry over HTTPS, set OTEL_EXPORTER_OTLP_ENDPOINT to https://collector.example.com:8443. The protocol is http/protobuf for HTTPS too. The application must trust the Collector certificate.
Connect an application directly over gRPC
If the application sends OTLP/gRPC directly from another host, point it to the proxy’s private IP or DNS name. On the proxy, allow 4317/TCP only from the sender addresses and configure mutual TLS (mTLS). When using both routes, configure a trusted CA, client certificate, and key in the Collector exporter and use an address that matches the proxy certificate. TLS parameters for Zabbix APM
Test telemetry ingestion
- OTLP/gRPC goes directly from the sender to Zabbix proxy on port
4317. - OTLP over HTTP or HTTPS goes from the sender to the OpenTelemetry Collector on port
4318or8443. The Collector forwards the trace to Zabbix proxy over gRPC.
Choose the test that matches your setup. For telemetry sent directly to the proxy over gRPC, run the first test. If you send telemetry through the Collector, use the HTTP or HTTPS test.
Send a test trace directly over gRPC
On the host that will send the test, install the otel-cli v0.4.5 package as root for the sender’s OS using the selector above. The commands are for Linux on x86-64. On ARM64, replace amd64 with arm64 in the filename.
Alma/CentOS/RHEL/Rocky 10
dnf install https://github.com/equinix-labs/otel-cli/releases/download/v0.4.5/otel-cli_0.4.5_linux_amd64.rpmDebian 13
curl -fLO https://github.com/equinix-labs/otel-cli/releases/download/v0.4.5/otel-cli_0.4.5_linux_amd64.deb &&
  apt install ./otel-cli_0.4.5_linux_amd64.deb
Run without a system installation. You can extract the prebuilt binary into the directory where you will save the script. On ARM64, use linux_arm64 in the archive filename.
archive=otel-cli_0.4.5_linux_amd64.tar.gz
curl -fLO "https://github.com/equinix-labs/otel-cli/releases/download/v0.4.5/$archive" &&
  tar -xzf "$archive" otel-cli
Open a new file. If you use the extracted binary, save the script next to it.
nano test-apm-grpc.shPaste the following contents and save the file.
#!/usr/bin/env bash
set -euo pipefail

endpoint=${1:?Usage: ./test-apm-grpc.sh PROXY_ENDPOINT [otel-cli options]}
shift
unset TRACEPARENT

PATH="$(dirname -- "$0"):$PATH" otel-cli span \
  --protocol grpc --endpoint "$endpoint" --timeout 5s \
  --service apm-test-grpc --name test-request \
  --fail --verbose --tp-print "$@"
printf '\nService: apm-test-grpc\n'
Make the file executable.
chmod +x test-apm-grpc.shLocal test without TLS. Run it on the Zabbix proxy host if its OTLP/gRPC receiver runs without TLS.
./test-apm-grpc.sh 127.0.0.1:4317 --insecureTest with mutual TLS. Run this command on the sender. Replace proxy.example.com with the name on the proxy certificate. The ca.crt file verifies the proxy certificate. client.crt and client.key are the sender’s certificate and key. Adjust the file paths as needed.
./test-apm-grpc.sh proxy.example.com:4317 \
  --tls-ca-cert ca.crt --tls-client-cert client.crt --tls-client-key client.key
After a successful send, the script prints the trace ID and the service name. Use trace id to identify the trace in Zabbix.
# trace id: 7ba3eae5ce58b4a7b54e077e4e324029
#  span id: 1e205f37114e72b6
TRACEPARENT=00-7ba3eae5ce58b4a7b54e077e4e324029-1e205f37114e72b6-01

Service: apm-test-grpc
Send a test trace through the Collector
On the Linux host that will send telemetry, open a new file.
nano test-apm-http.shPaste the following contents and save the file.
#!/usr/bin/env bash
set -euo pipefail

collector_url=${1:?Usage: ./test-apm-http.sh COLLECTOR_URL}
now_ns=$(date +%s%N)
read -r trace_id < /proc/sys/kernel/random/uuid
trace_id=${trace_id//-/}

curl -fsS --max-time 10 \
  -H 'Content-Type: application/json' \
  --data-binary @- "${collector_url%/}/v1/traces" <<JSON
{
  "resourceSpans": [{
    "resource": {
      "attributes": [{"key": "service.name", "value": {"stringValue": "apm-test-http"}}]
    },
    "scopeSpans": [{"spans": [{
      "traceId": "$trace_id",
      "spanId": "0000000000000001",
      "name": "test-request",
      "kind": 2,
      "startTimeUnixNano": "$((now_ns - 10000000))",
      "endTimeUnixNano": "$now_ns"
    }]}]
  }]
}
JSON
printf '\nService: apm-test-http\nTrace ID: %s\n' "$trace_id"
Make the script executable and choose the command that matches your Collector configuration. In either example, replace collector.example.com with your Collector’s address.
chmod +x test-apm-http.shHTTP on port 4318
./test-apm-http.sh http://collector.example.com:4318HTTPS on port 8443. Run this test if the Collector uses TLS and the sender trusts its certificate.
./test-apm-http.sh https://collector.example.com:8443Example output after the Collector accepts the request. The Trace ID changes on every run.
{"partialSuccess":{}}
Service: apm-test-http
Trace ID: be034f426cd944f9afbb09e198313f93
Verify the first data in Zabbix
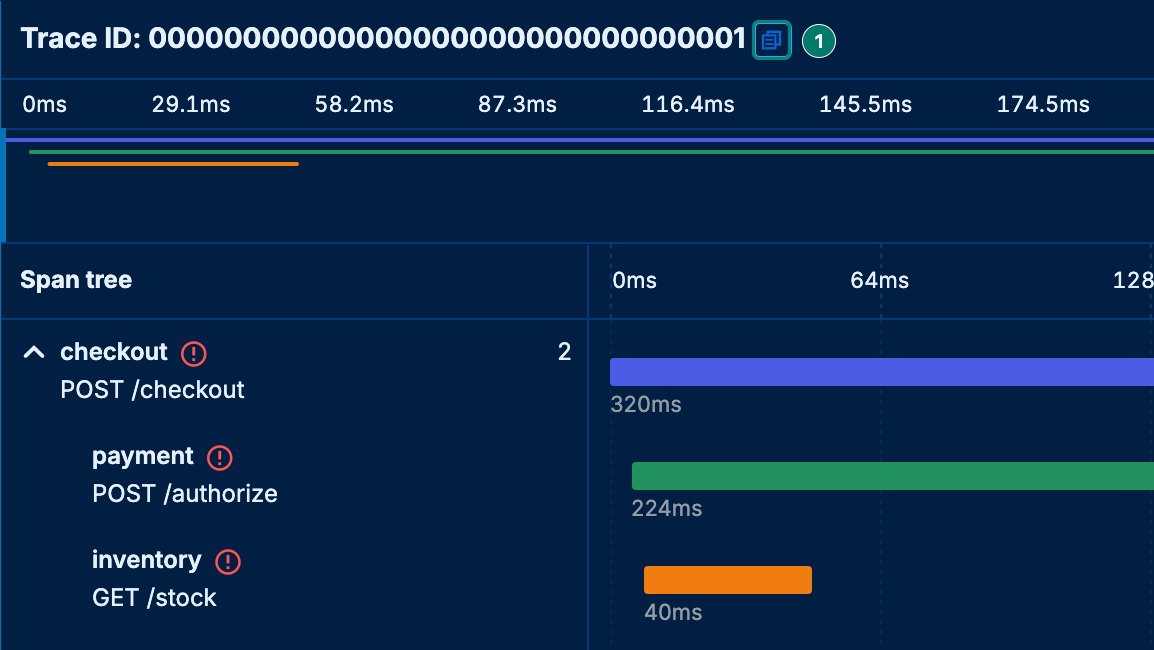
Open APM → Traces, select the last 15 minutes, and find apm-test-http for the test through the Collector or apm-test-grpc for the direct proxy test. Open the resulting trace and compare its Trace ID with the script output. To verify your own application, trigger a request and search for its OTEL_SERVICE_NAME value. If the app also exports metrics and logs, find them under APM → Metrics and APM → Logs. You can look up related logs by Trace ID when the app includes it.
If data is missing, check the proxy log. If you use the Collector, check its log too. For ClickHouse connection errors, verify the URL, account, and permissions in the data source.
tail -n 50 /var/log/zabbix/zabbix_proxy.logjournalctl -u otelcol-contrib -n 50 --no-pageruxMAX for APM
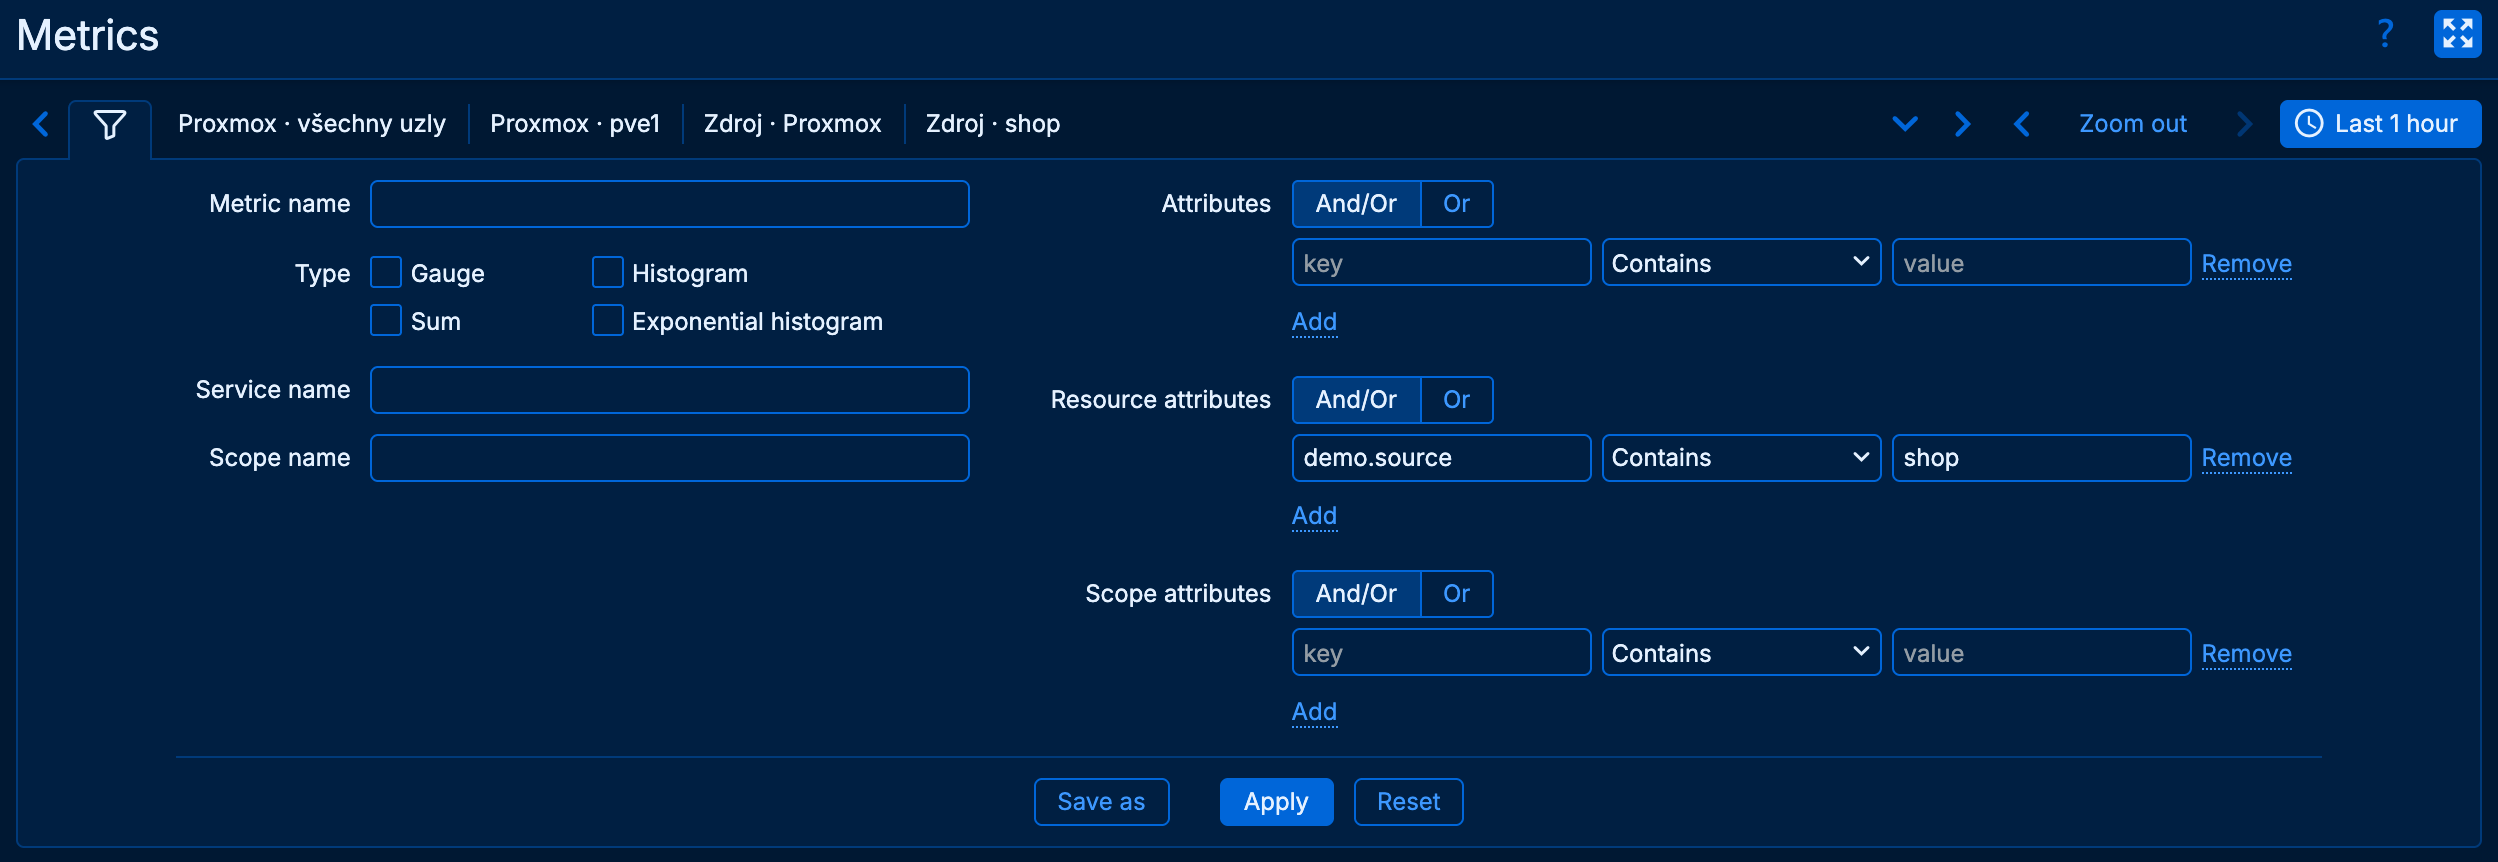
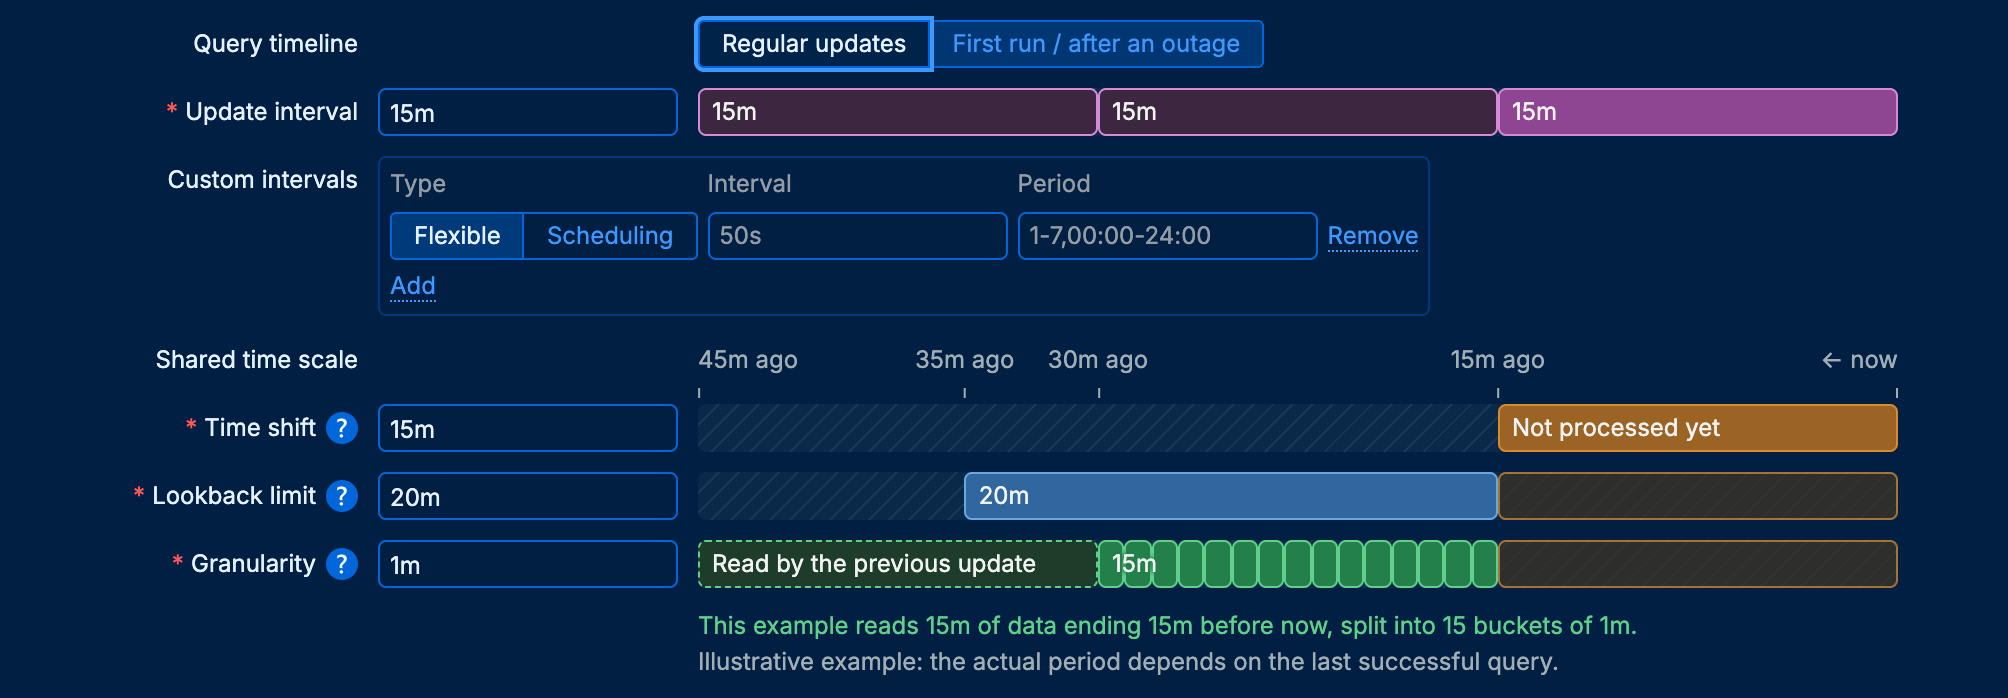
For working with APM, we recommend the free uxMAX module. In Traces, Metrics and Logs, use Save as to keep your own filters and selected time range for later use. Save changes to an existing filter with Update. When configuring Telemetry query items, the timeline illustrates the read window, Granularity buckets and possible gaps or overlaps. Open the guided installer in the initMAX Portal, select your operating system and run the commands on the server hosting your Zabbix frontend.
Optionally override the global data source in a configuration file
Use this section when a component needs its own database or account. A file setting overrides Administration → Data source only for the component where you set it. Add these blocks to the existing configuration files and retain the other settings.
Proxy for telemetry writes
On the Zabbix proxy host, open its configuration.
nano /etc/zabbix/zabbix_proxy.conf# Set the URL, database, account and password for this component.
TelemetryProvider=clickhouse;url=http://clickhouse.example.com:8123,db=otel,username=otel_zabbix,password="REPLACE_OTEL_PASSWORD"zabbix_proxy -T
systemctl restart zabbix-proxyServer for telemetry queries
On the Zabbix server host, open its configuration.
nano /etc/zabbix/zabbix_server.conf# Set the URL, database, account and password for this component.
TelemetryProvider=clickhouse;url=http://clickhouse.example.com:8123,db=otel,username=otel_zabbix,password="REPLACE_OTEL_PASSWORD"zabbix_server -T
systemctl restart zabbix-serverFrontend for APM views
On the frontend host, add the full block to the existing PHP file, which also contains the connection to the main Zabbix database.
nano /etc/zabbix/web/zabbix.conf.php// Set the ClickHouse connection for the frontend.
$TELEMETRY_PROVIDERS[] = [
'provider' => 'clickhouse',
'url' => 'http://clickhouse.example.com:8123',
'db' => 'otel',
'username' => 'otel_zabbix',
'password' => 'REPLACE_OTEL_PASSWORD'
];php -l /etc/zabbix/web/zabbix.conf.phpReload APM to verify the change. The global data source Test button checks the values entered in its form. Telemetry data source documentation
Zabbix APM documentation · Official ClickHouse packages · Collector configuration
Give us a Like, share us, or follow us 😍
So you don’t miss anything: