
Description
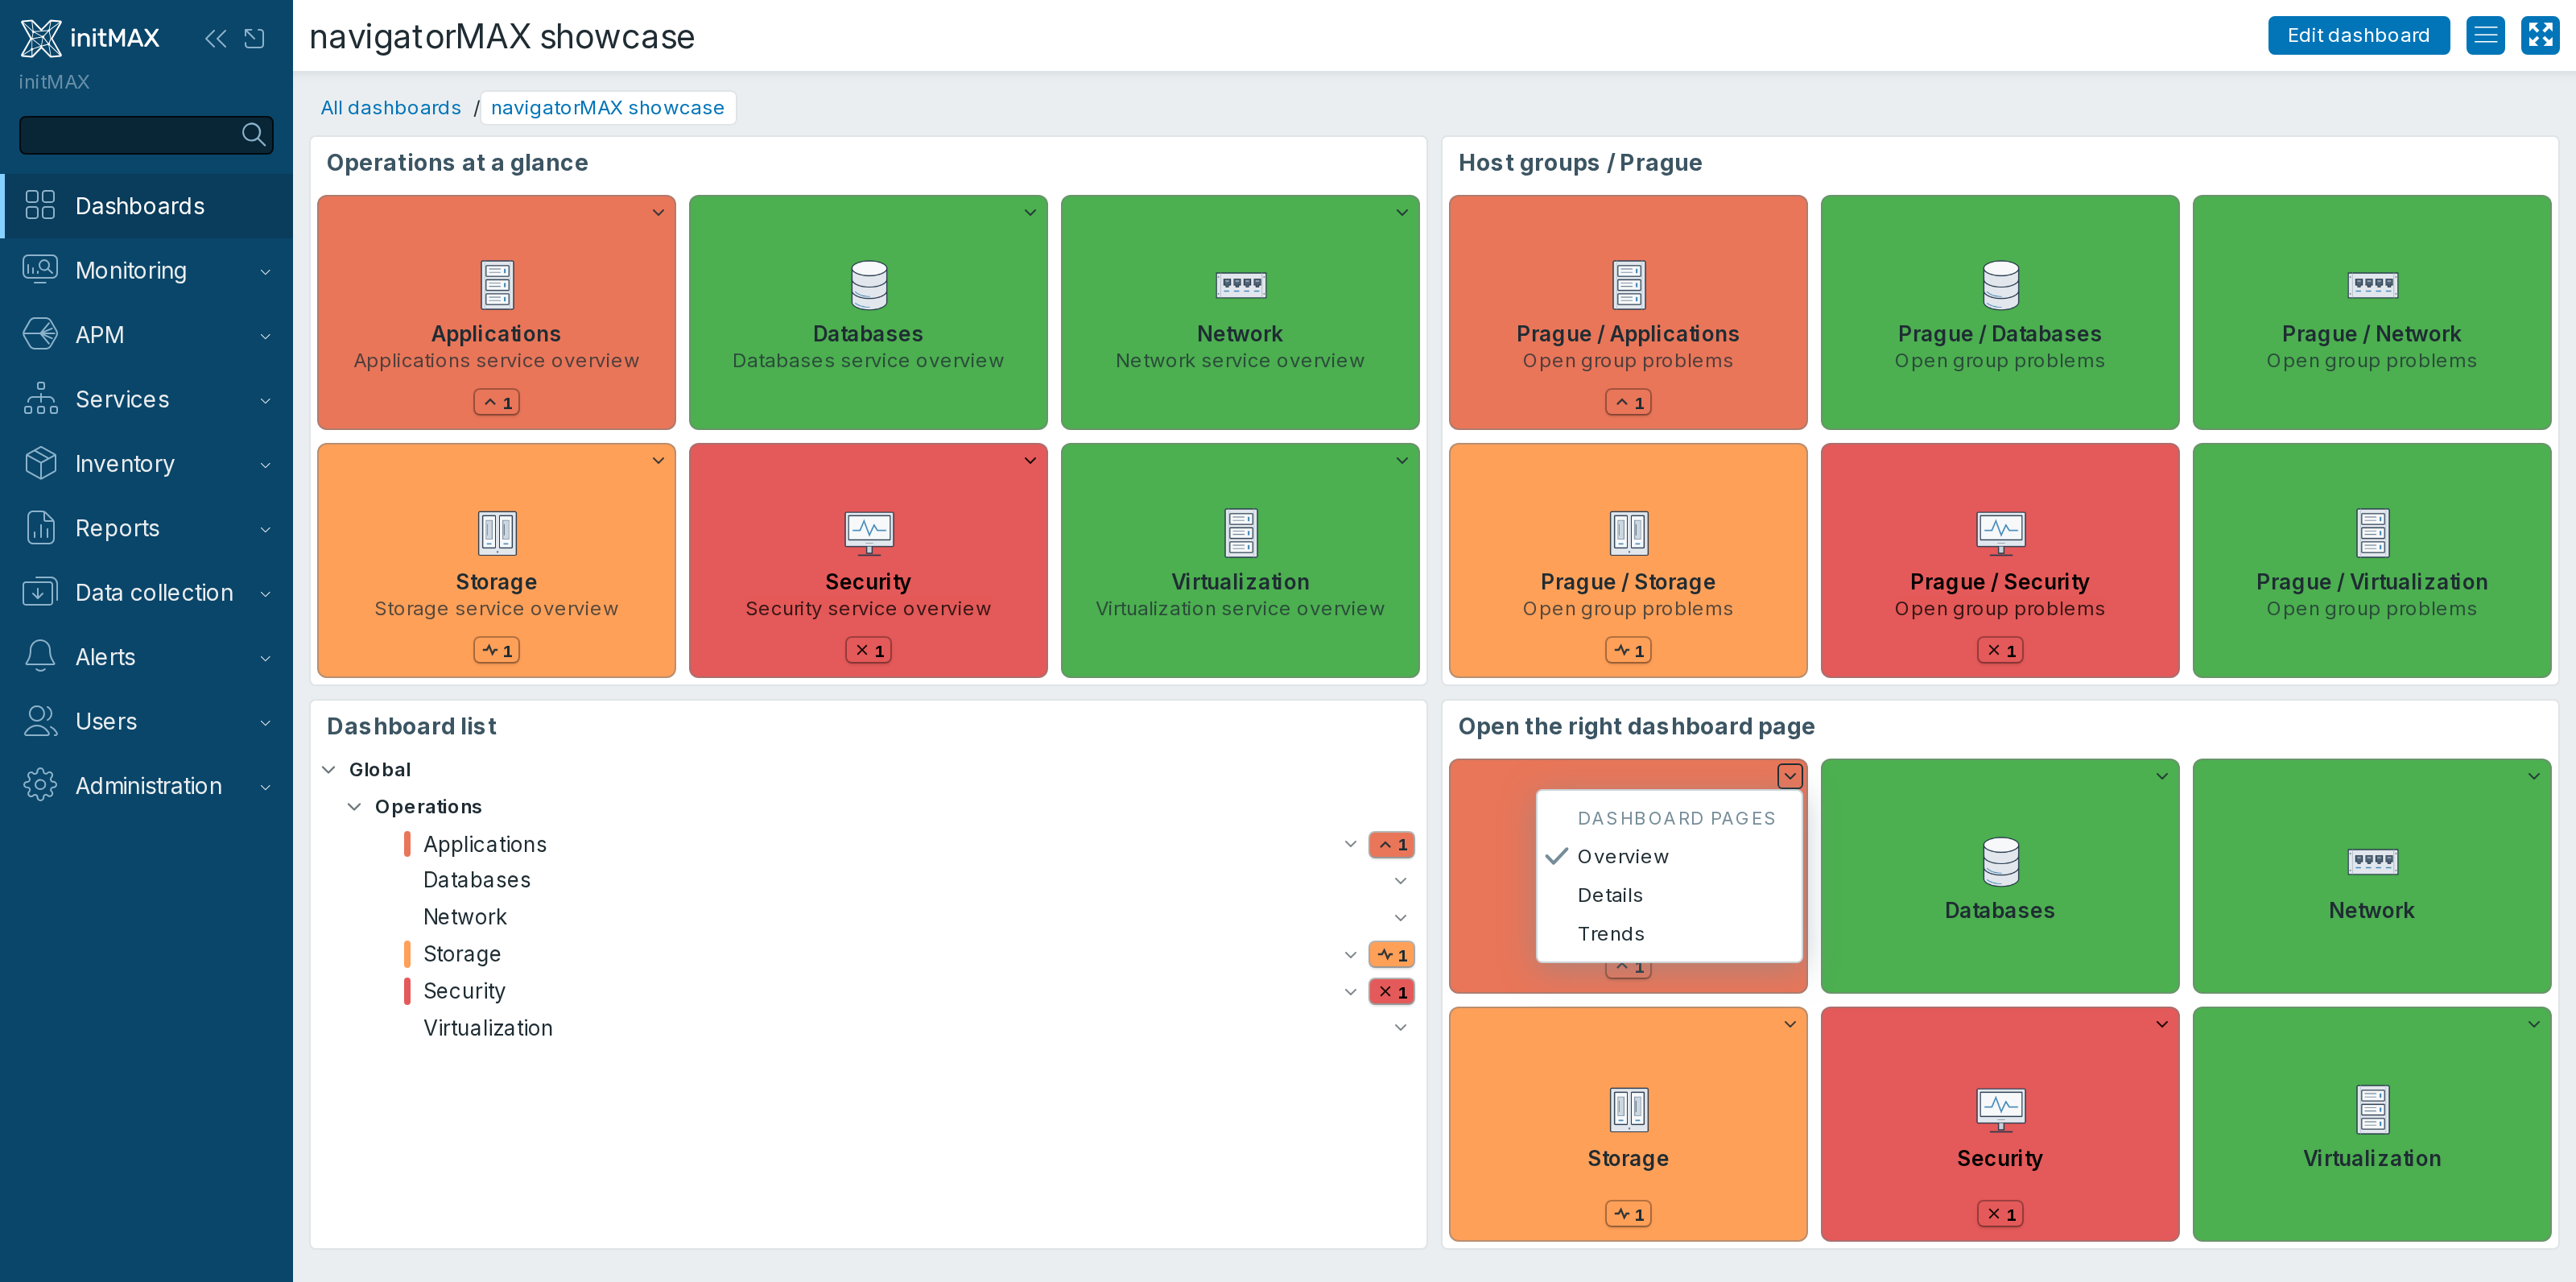
navigatorMAX creates navigation tiles from your Zabbix dashboards. Build one overview for operators, link directly to the right dashboard page and show host problem colours and counts before opening detail. Choose a paged button grid or a collapsible list.
FREE gives operators a dashboard navigator with a tile grid or list, direct page links, a shared appearance and live problem colours and counts for host dashboards.
PRO adds navigation by host groups and subgroups, template dashboards, host selection by tags, regular expressions and custom URLs. Individual tiles can have their own icon, colour and problem filter; shared presets make a setup easy to reuse.
The widget uses the current viewer’s Zabbix permissions. Sharing a dashboard does not grant access to its destination hosts, groups, items or other dashboards. Install the package on every frontend node in an HA setup; shared presets live in the Zabbix module configuration.
Zabbix 8.0 compatibility is currently tested on 8.0.0rc2. Global dashboards do not have a destination host: their default tile colour is an appearance setting, not a health check. PRO can use an explicit problem filter for those tiles.
Usage examples
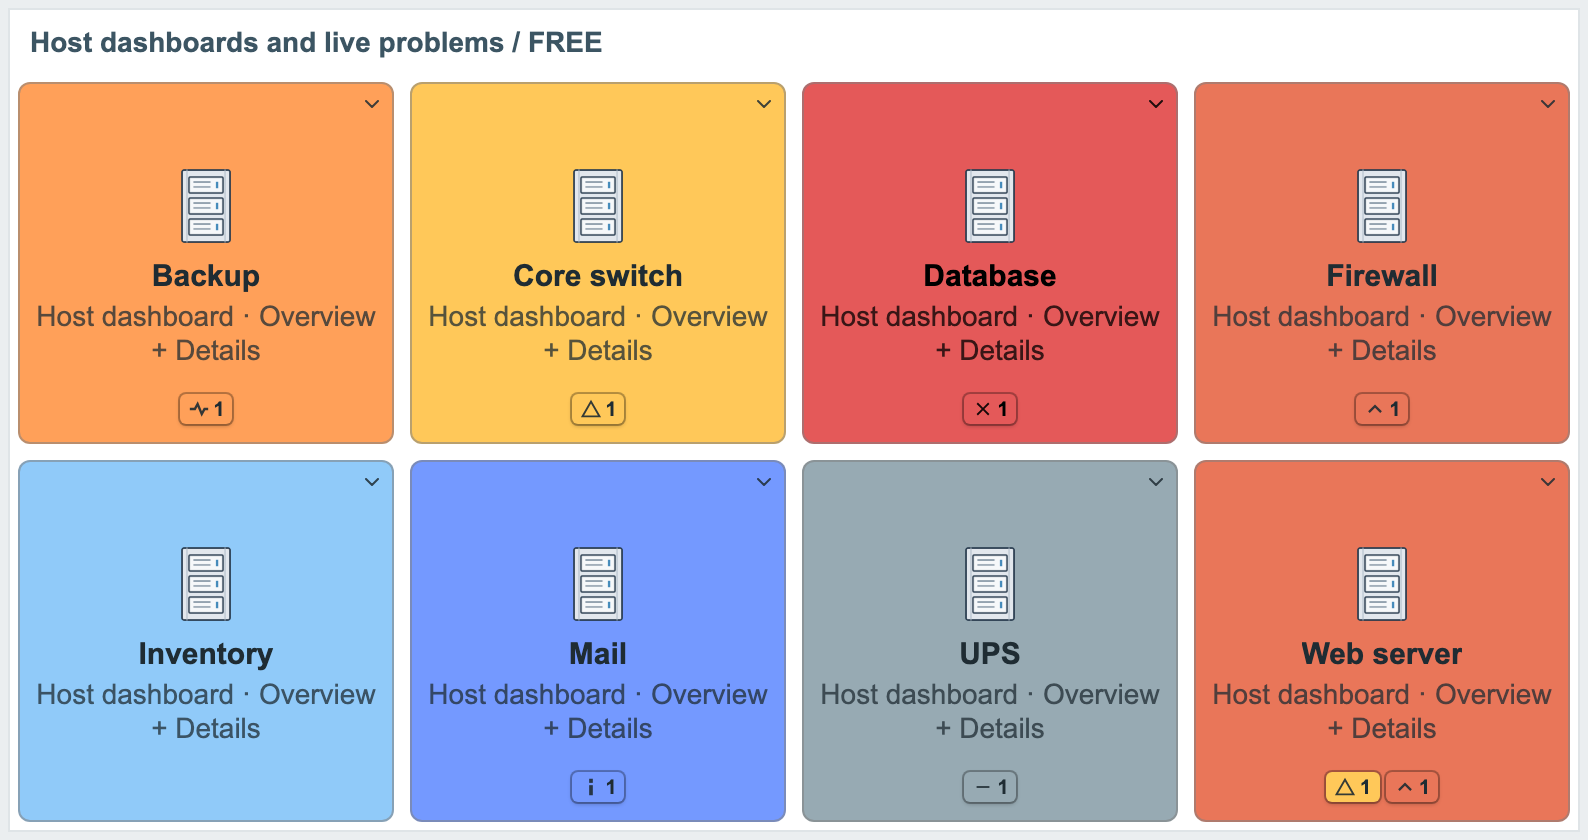
Example 1 – Host dashboards and live problems (FREE)
Select Host dashboard and match technical host names or a * pattern, then load the selection. The FREE build below uses one shared icon and automatic per-host severity colours and counts. Each tile opens that host’s dashboard; its menu selects Overview or Details.
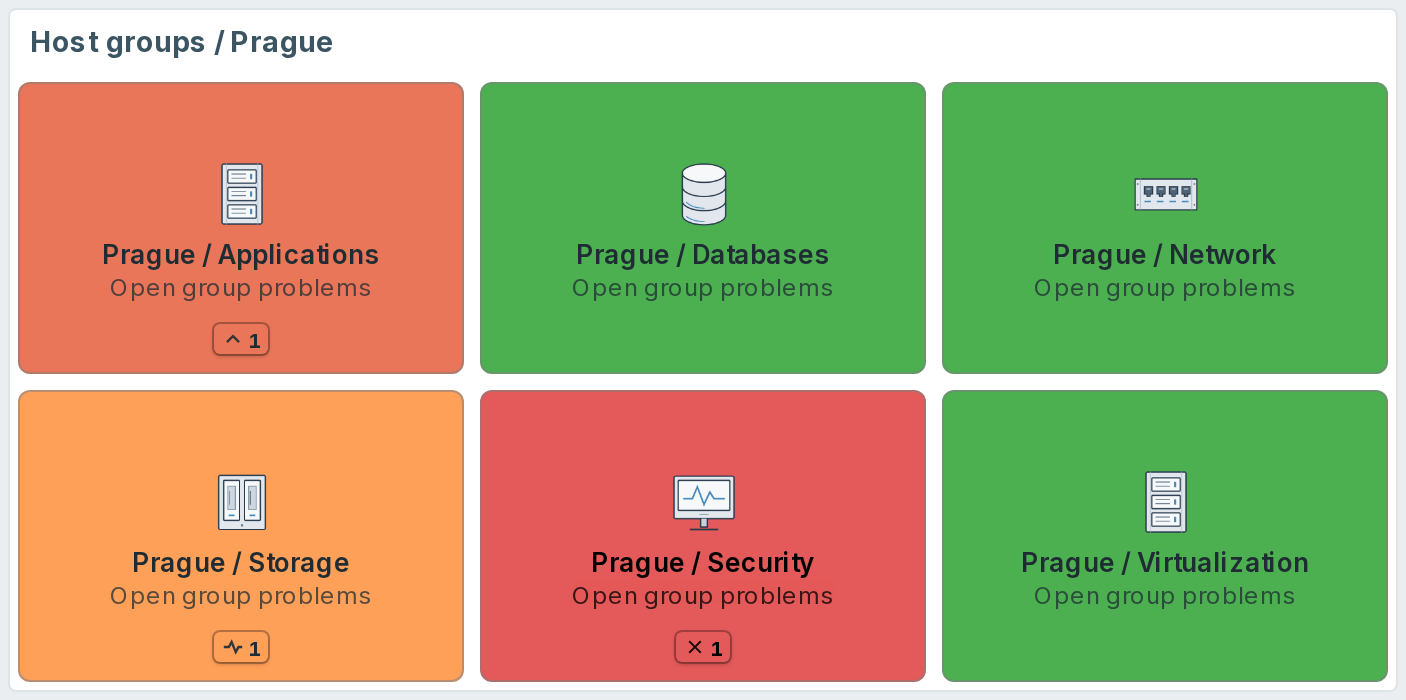
Example 2 – Sites and host-group problems (PRO)
Match a group hierarchy such as s4/000/network and enable Include subgroups when descendants should become separate tiles. No dashboard is required behind a group tile: it opens that group’s Problems view. * can also match slash characters, so it is not a one-level-only selector.
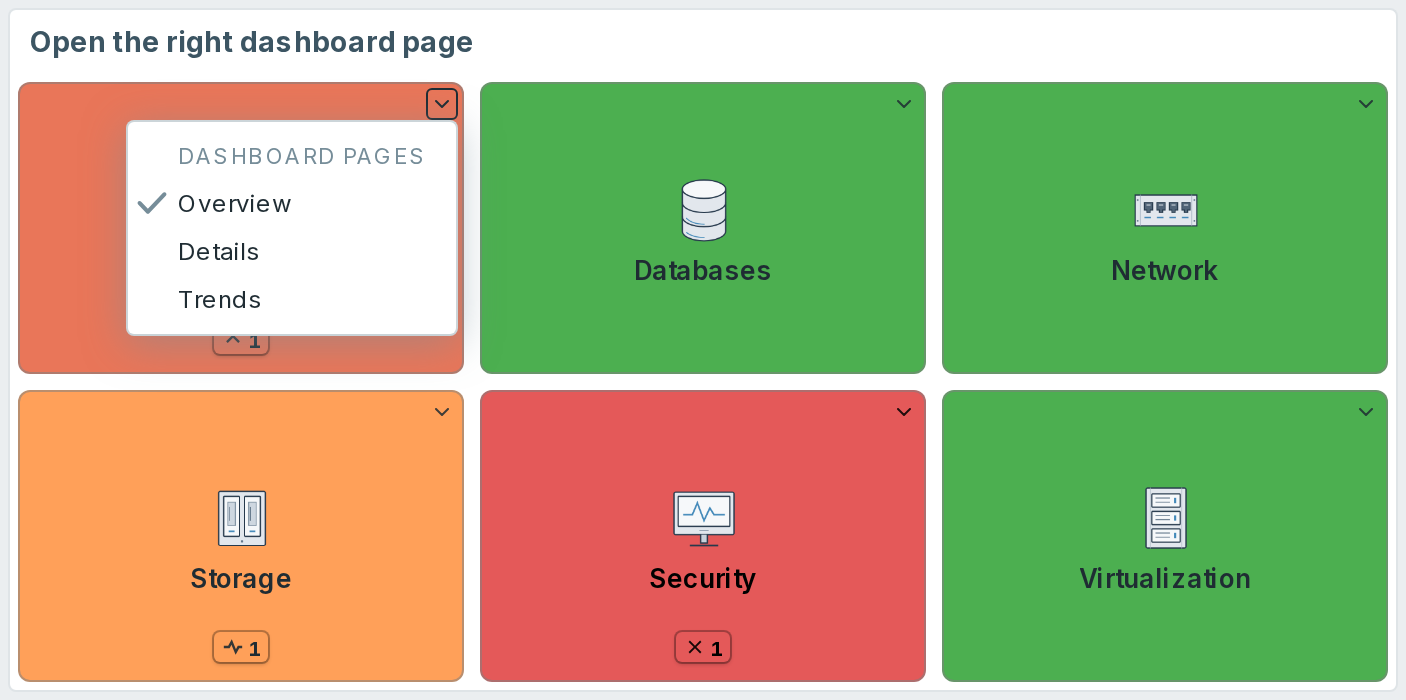
Example 3 – Open a dashboard page (FREE/PRO)
Use the page menu on a tile to open Overview, Details or Trends directly. Page navigation is shared by both editions. This PRO example also has explicit problem-filter colours, which require PRO for global dashboards.
Example 4 – A compact navigation tree (FREE/PRO)
Switch to List and group slash-separated dashboard names into a collapsible tree. List navigation is shared by both editions; the coloured markers/counts in this PRO example come from custom problem filters.
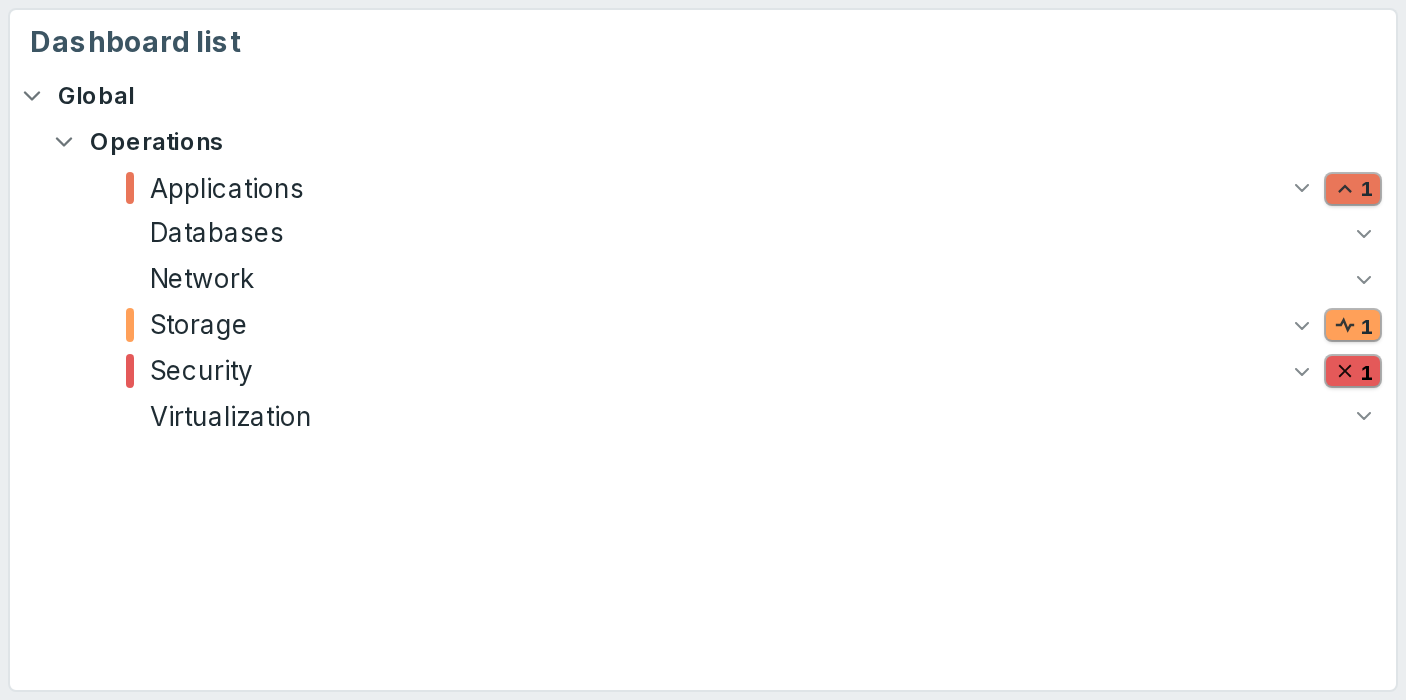
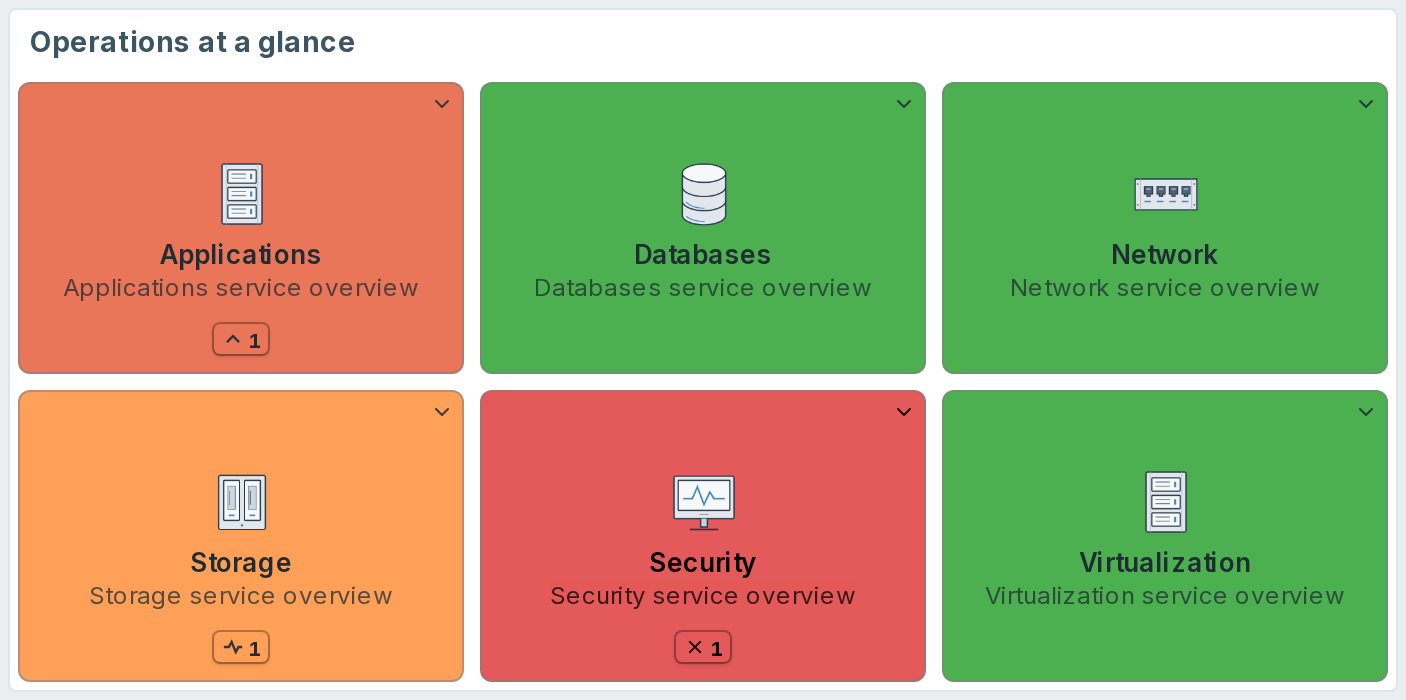
Example 5 – Icons and custom problem filters (PRO)
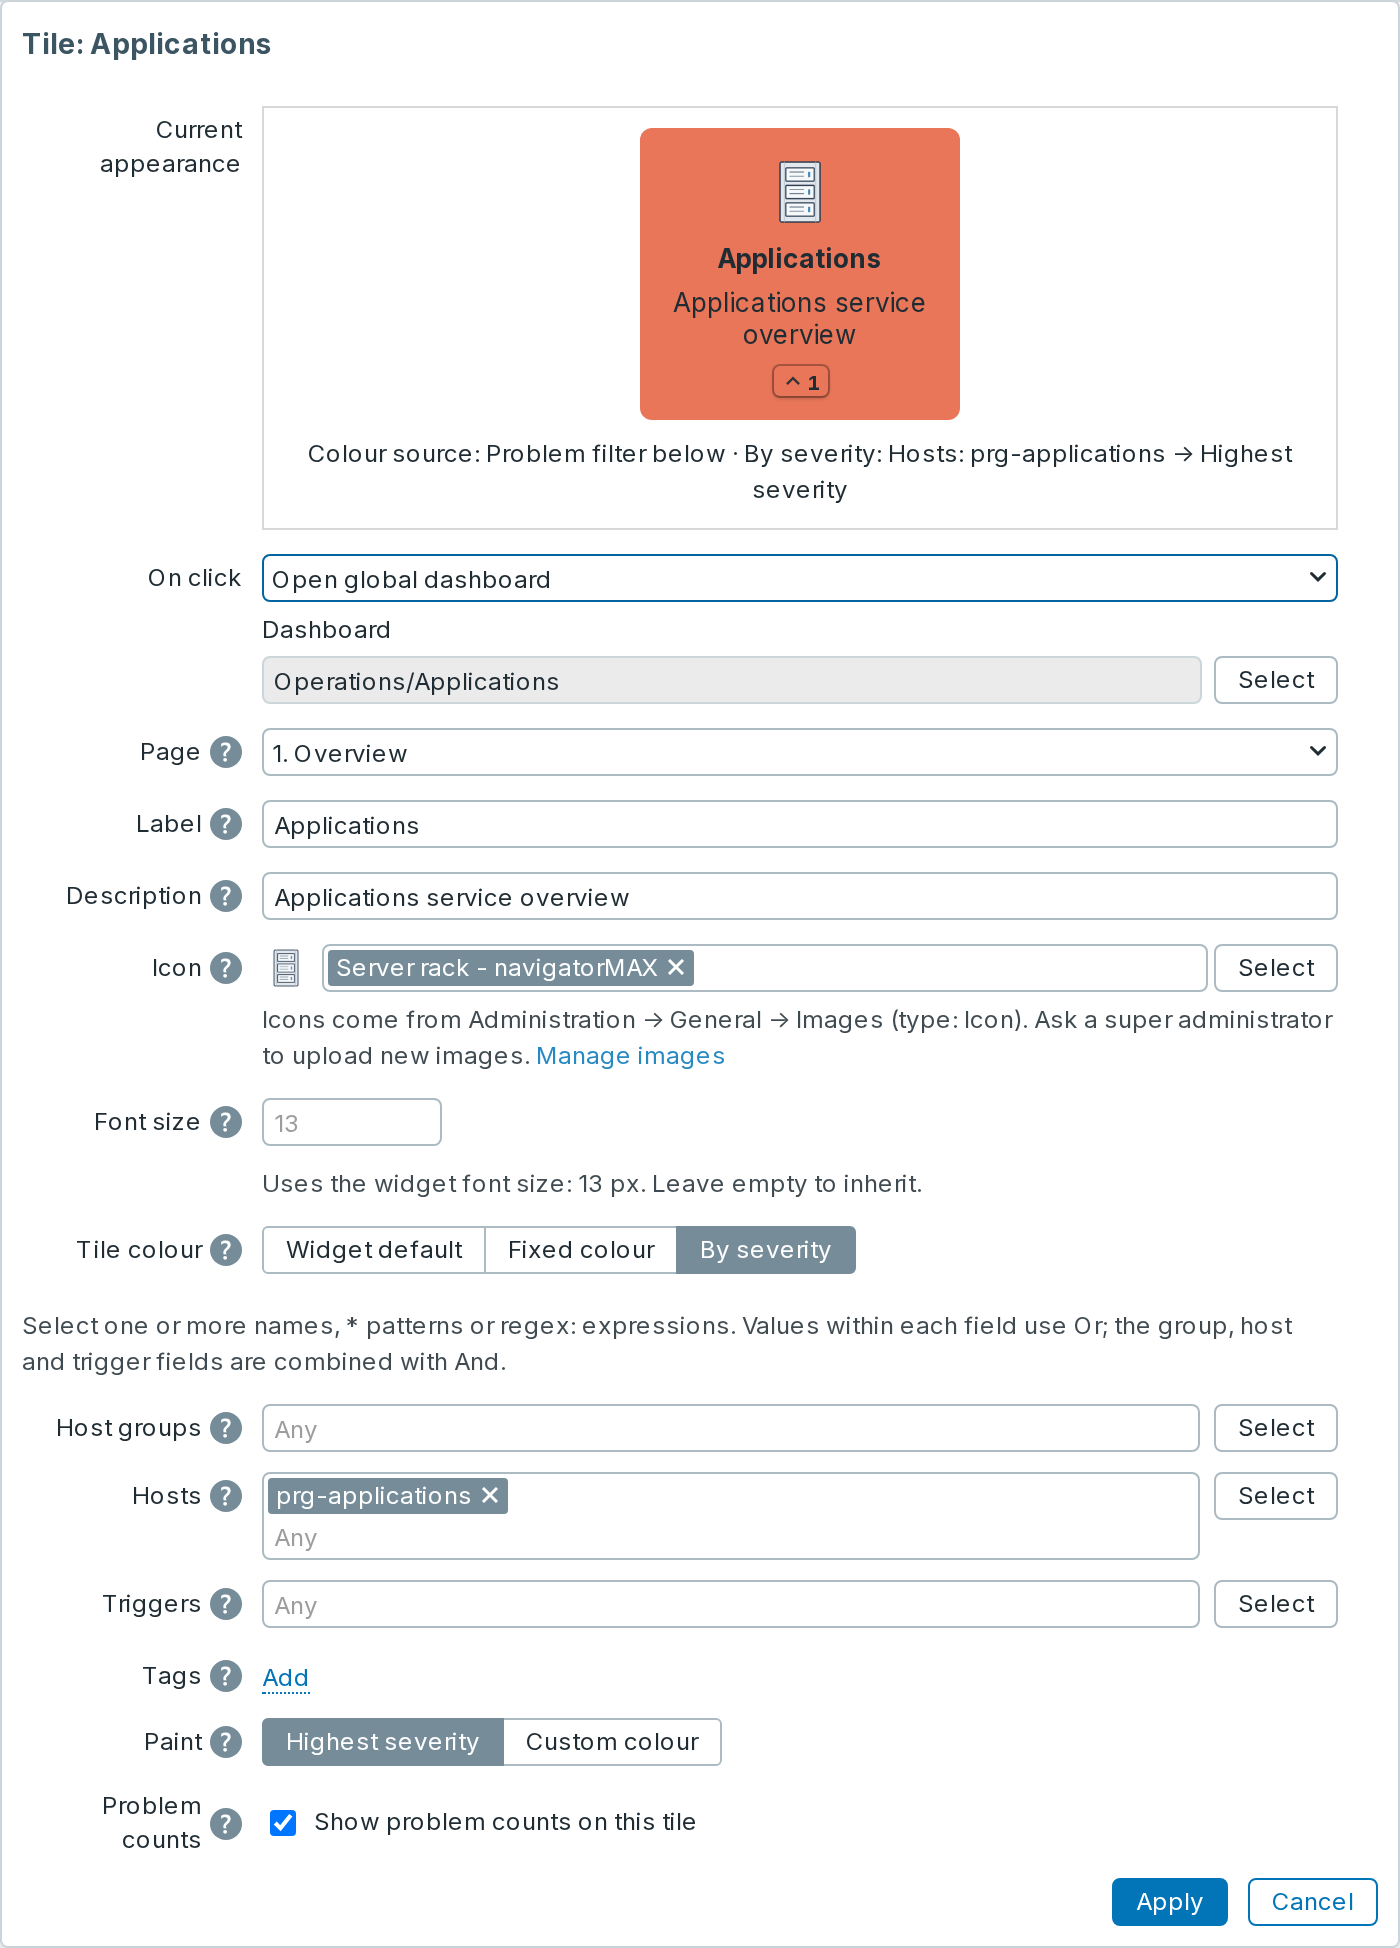
Give each tile a suitable icon and choose a fixed colour or a problem filter. Multiple host/group/trigger selectors and tags let a global dashboard tile represent the exact monitored scope its operators need.
Installation
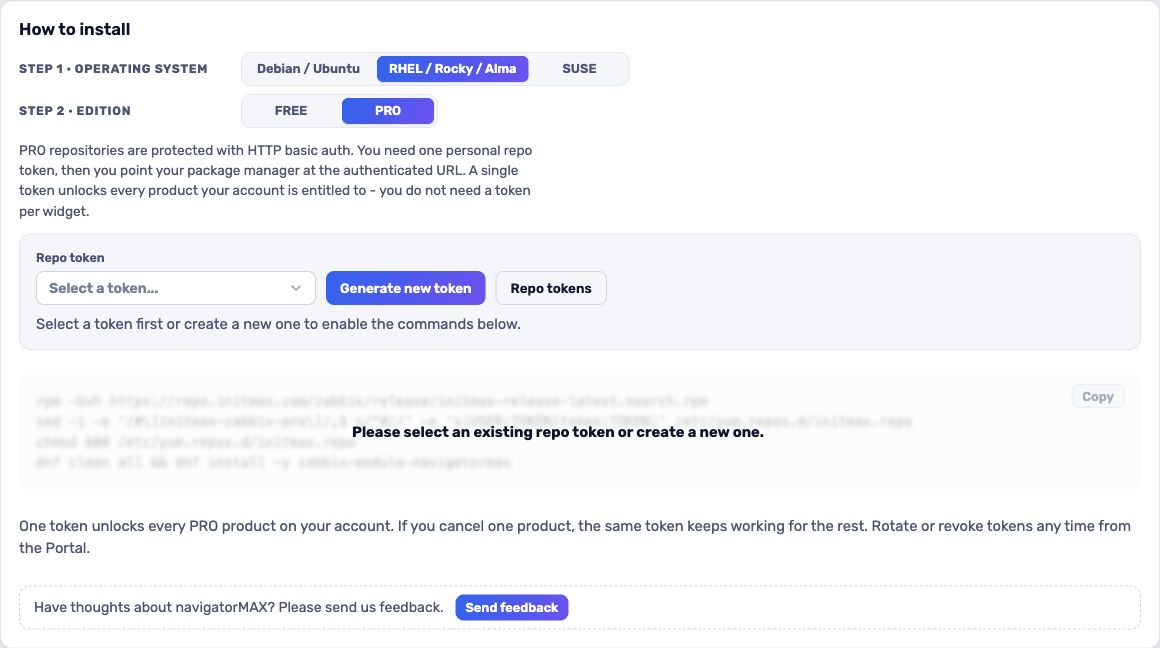
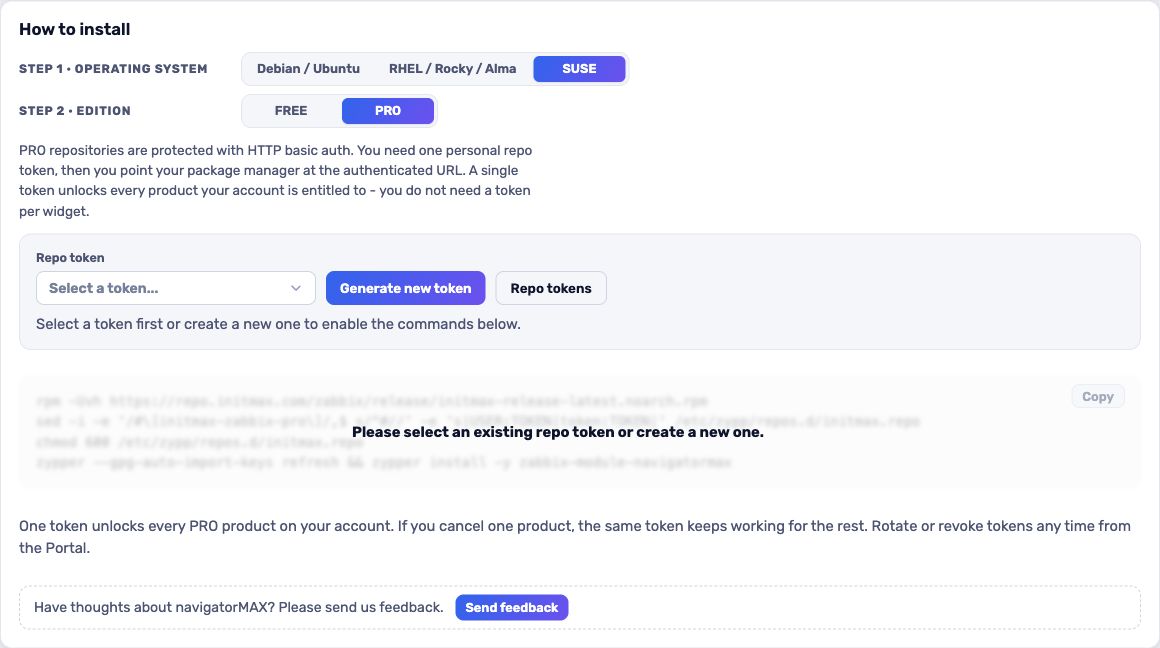
Signed DEB and RPM packages are delivered through the initMAX repository. The Portal guided installer supplies the distribution-specific commands and fills in your PRO repository credentials after sign-in.
RHEL / Rocky / Alma

FREE edition
# RHEL / Rocky / Alma
rpm -Uvh https://repo.initmax.com/zabbix/release/initmax-release-latest.noarch.rpm
dnf clean all && dnf install -y zabbix-module-navigatormax
PRO edition
The easiest route is the Portal: choose your operating system and PRO, then sign in. Your repository token is filled into the install command automatically. Open the Portal installer.
SUSE
FREE edition
# SUSE
rpm -Uvh https://repo.initmax.com/zabbix/release/initmax-release-latest.noarch.rpm
zypper --gpg-auto-import-keys refresh && zypper install -y zabbix-module-navigatormax
PRO edition
The easiest route is the Portal: choose your operating system and PRO, then sign in. Your repository token is filled into the install command automatically. Open the Portal installer.
Debian / Ubuntu
FREE edition
# Debian / Ubuntu
wget https://repo.initmax.com/zabbix/release/initmax-release-latest_all.deb
dpkg -i initmax-release-latest_all.deb
apt update && apt install zabbix-module-navigatormax
PRO edition
The easiest route is the Portal: choose your operating system and PRO, then sign in. Your repository token is filled into the install command automatically. Open the Portal installer.
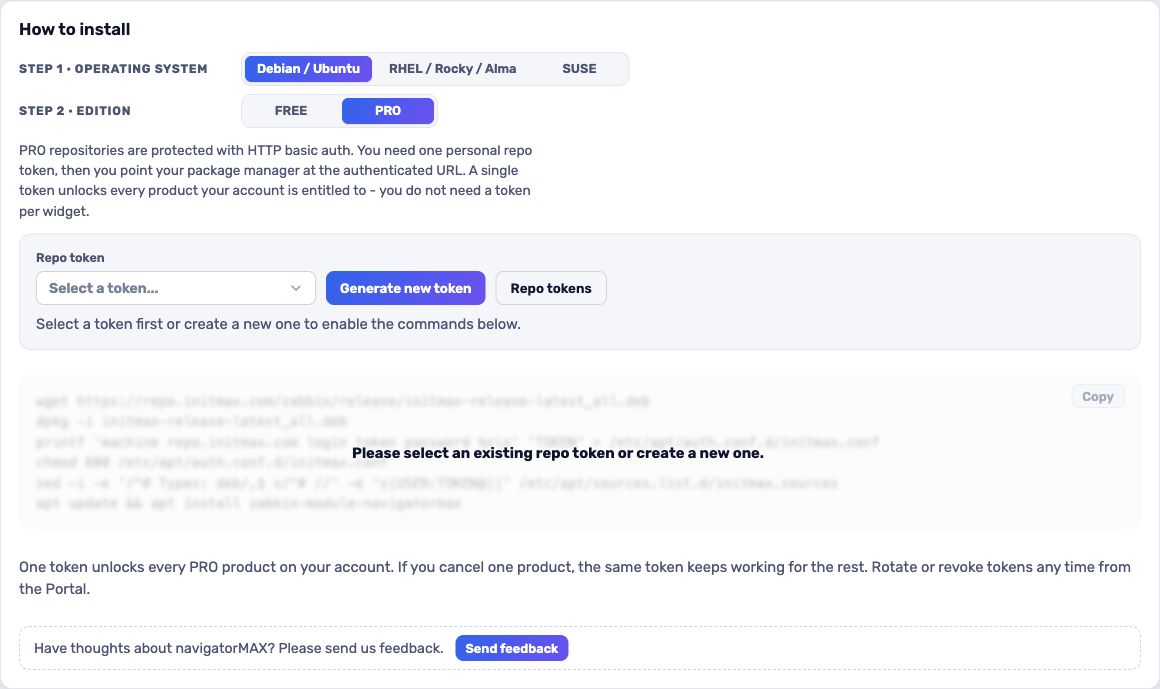
Prefer a ZIP archive for an offline or manual installation? Download FREE from the repository, or PRO from the Portal after signing in. The Portal installer provides the current installation and upgrade instructions.
Configuration
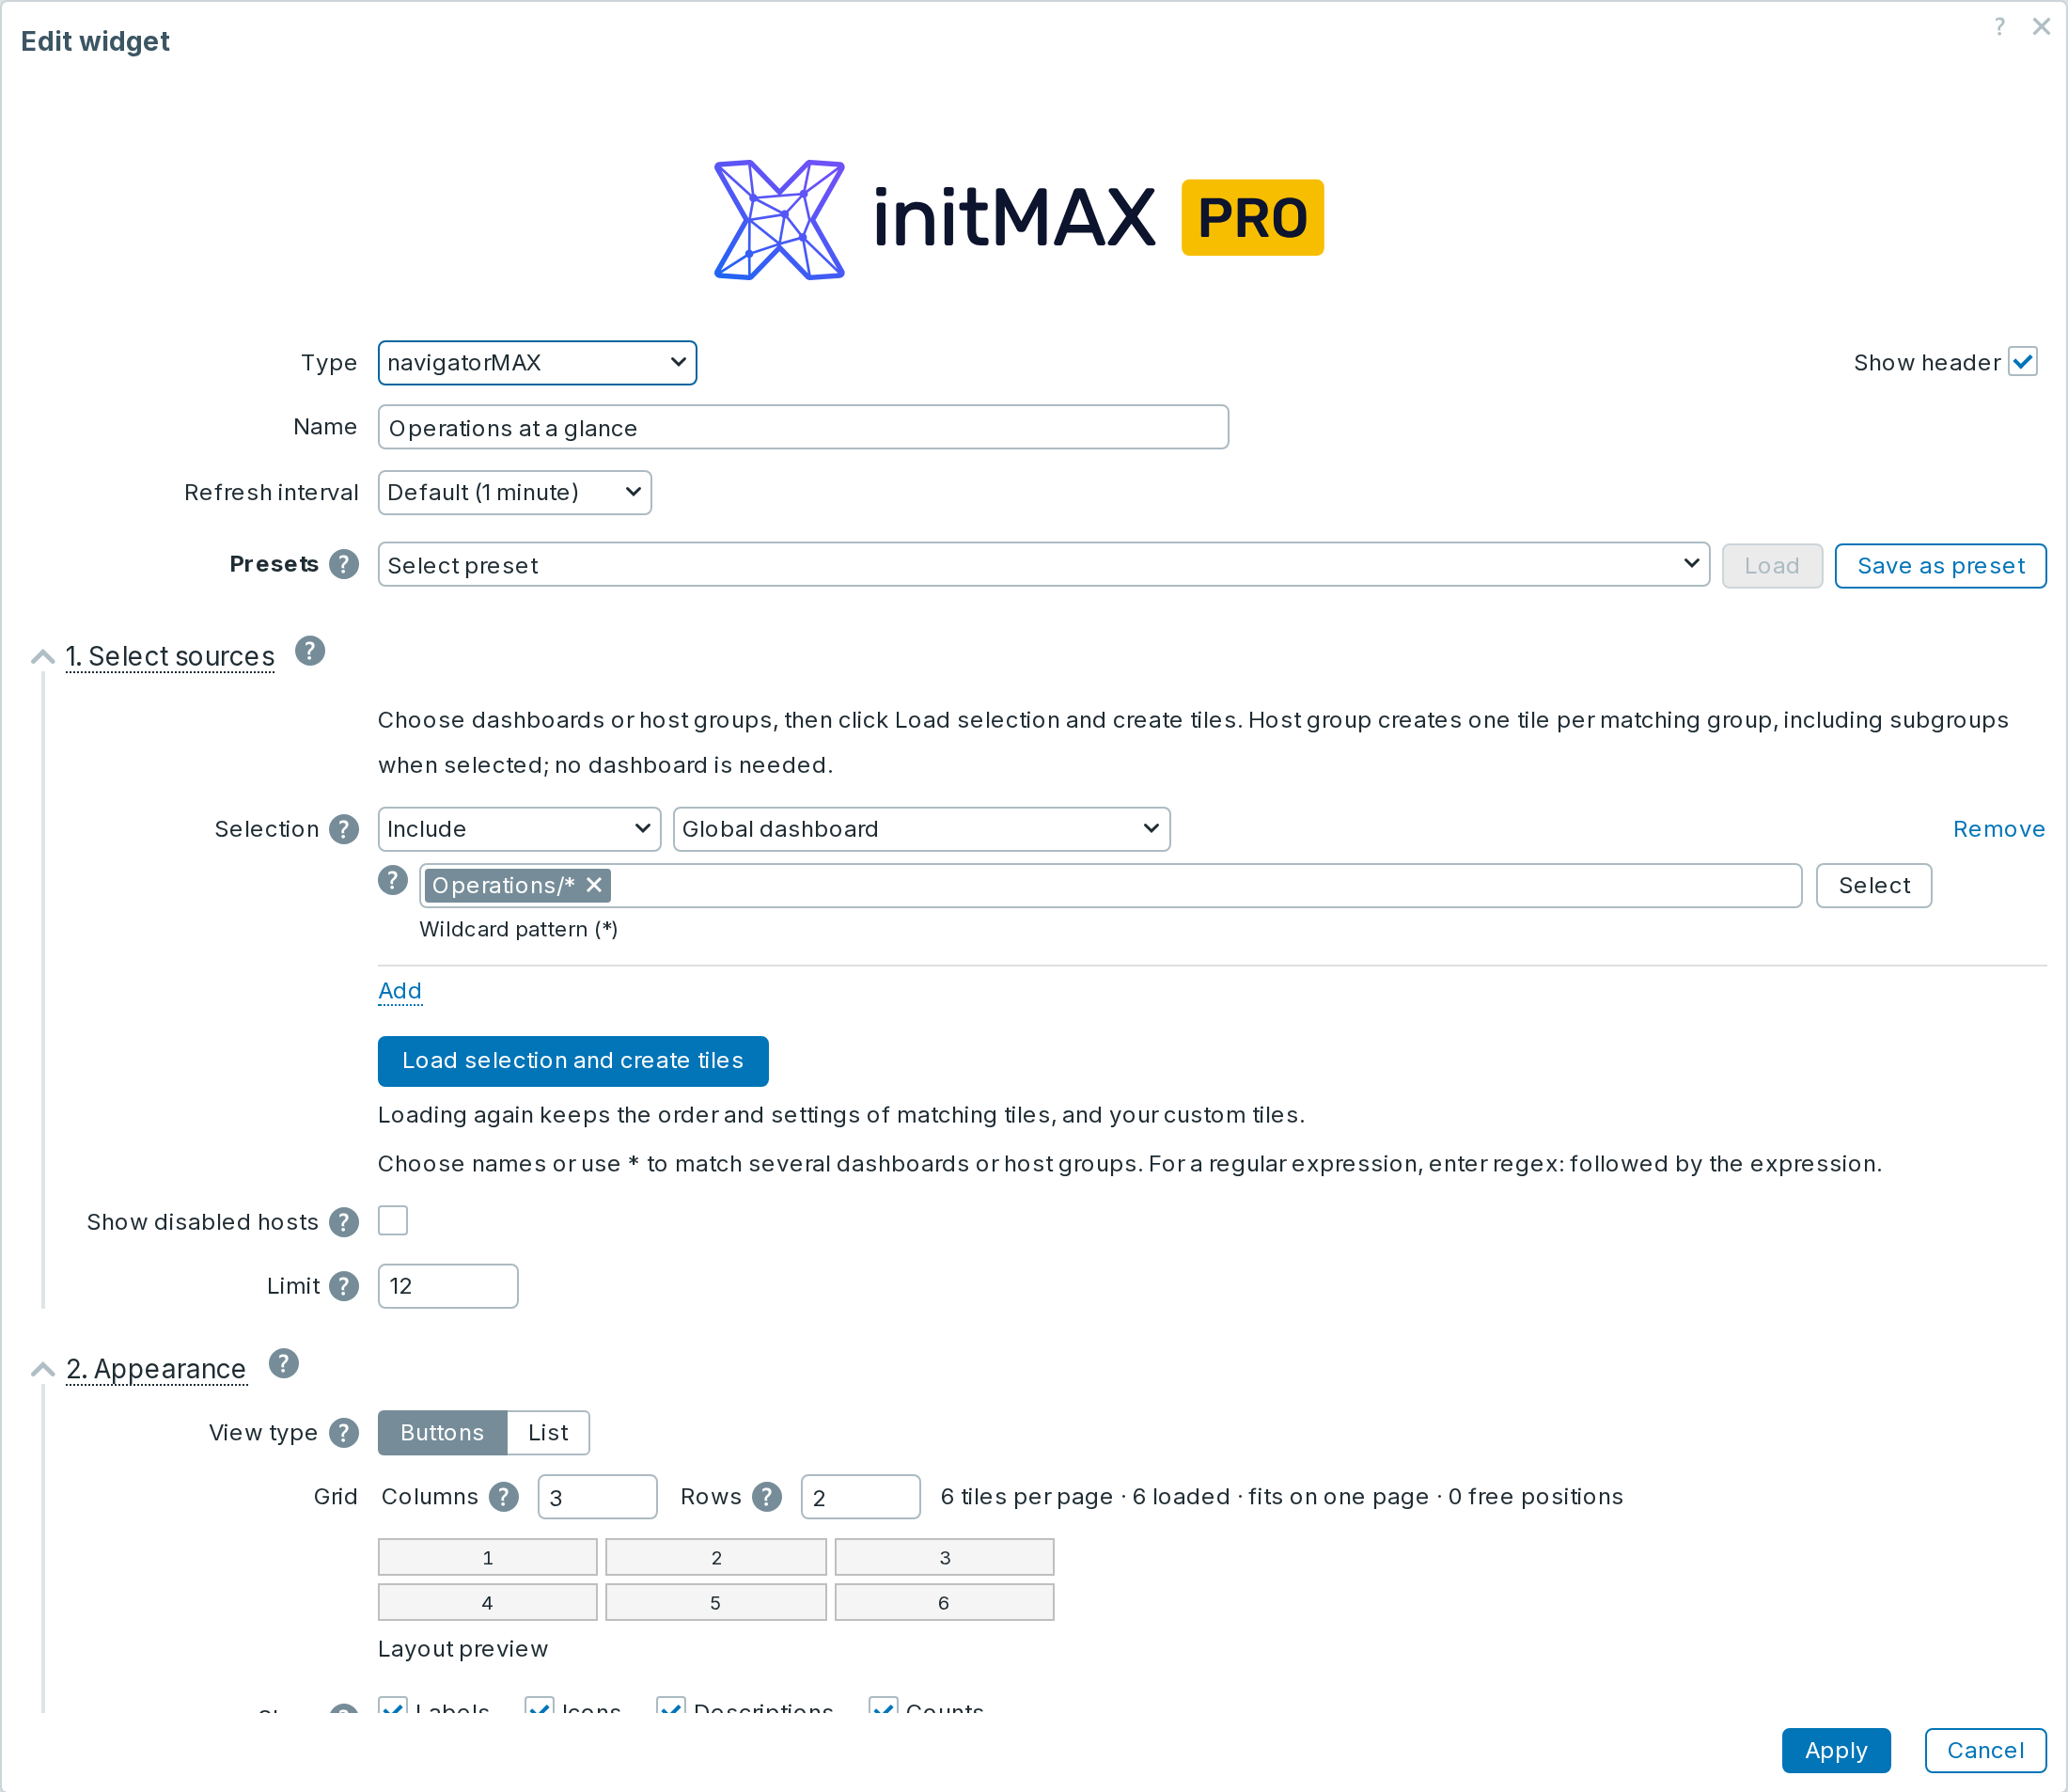
Add navigatorMAX to a dashboard, select sources, click Load selection and create tiles, arrange the tiles and Apply. Save the dashboard to persist the change. In FREE, PRO controls remain visible with a padlock.
Fields marked (PRO) require the PRO edition. Other settings are available in both editions.
General settings
1. Select sources
2. Appearance
3. Arrange tiles
Find tiles, drag them into order or use the arrows. Edit opens the tile settings; Clone duplicates a tile and Remove deletes it from this widget. Add custom tile (PRO) adds an independent tile, such as a custom URL.
Display defaults
Problem display
Tile editor
Live values in descriptions
Descriptions use the native Zabbix expression-macro resolver. For example: Available disk space: {?last(/Zabbix server/navigatormax.demo.storage.free)}. Use an explicit technical host name and item key. The raw template remains saved; displayed values refresh under the viewer’s permissions. Missing or inaccessible values follow the installed Zabbix version’s native behaviour.
Permissions and unavailable data
Automatic host-state lookup is bounded at 10,000 matching problem events per refresh. If that limit is exceeded or the lookup fails, affected tiles show an unavailable state and a link to Problems; incomplete totals are not presented as complete. The source selection separately caps tiles at the configured Limit.
Where to get it?
Compare the editions and get navigatorMAX on the product page.