In this guide, we will show you how to set up SNMP trap in Zabbix on the RHEL 9 operating system, both for SNMPv2 and SNMPv3!
This process is identical for both Zabbix Server and Zabbix Proxy, and in case of using HA, it needs to be repeated on all cluster nodes.
Installation of additional components
For functioning SNMP traps, you need to install the following packages on the server:
- net-snmp (main package containing all necessary binaries and libraries)
- net-snmp-perl (perl module for SNMP)
- net-snmp-utils (tools mostly for debugging – optional)
dnf install net-snmp-utils net-snmp-perl net-snmpSNMP Trap configuration at the OS level
First, download the perl script for receiving SNMP traps and sending the data to Zabbix from the official Zabbix repository.
curl -o /usr/bin/zabbix_trap_receiver.pl https://git.zabbix.com/projects/ZBX/repos/zabbix/raw/misc/snmptrap/zabbix_trap_receiver.plThen set this script as executable:
chmod +x /usr/bin/zabbix_trap_receiver.plNext, you need to configure this script – open it:
nano /usr/bin/zabbix_trap_receiver.plHere, set the variable $SNMPTrapperFile, which specifies where the SNMP trap file will be stored.
Set the path in a way that it is guaranteed that the given file will not be deleted even when, for example, the server is restarted.
In our case it will be the file /var/log/snmptrap/snmptrap.log.
### Option: SNMPTrapperFile
#       Temporary file used for passing data to the server (or proxy). Must be the same
#       as in the server (or proxy) configuration file.
#
# Mandatory: yes
# Default: /tmp/zabbix_traps.tmp
$SNMPTrapperFile = '/var/log/snmptrap/snmptrap.log';
Create this folder then:
mkdir /var/log/snmptrapSNMP settings
When you have set up the script to receive SNMP traps and send the data to Zabbix, you need to configure SNMP next.
Open the configuration file /etc/snmp/snmptrapd.conf:
nano /etc/snmp/snmptrapd.confBelow you can see an example configuration for SNMPv1, SNMPv2 and SNMPv3, including the script mentioned above (you can define more than one SNMP community).
Attention: The line containing call to the perl script for SNMP traps must be the very last line in this configuration file!
Attention: The minimum password length for SNMPv3 must be at least 8 characters, in our example the password is: %Password123%.
#SNMPv3
createUser -e 0x800000020109840301 monitoring SHA512 zabbix_trap AES256 %Password123%
authUser execute monitoring

#SNMPv1,2
authCommunity execute initmax

#Zabbix SNMP trap receiver
perl do "/usr/bin/zabbix_trap_receiver.pl";
Configure log rotation for snmptrap.log file
Create logrotate configuration file:
nano /etc/logrotate.d/snmptrapIn here, set up the following parameters:
/var/log/snmptrap/snmptrap.log {
    weekly
    rotate 12
    compress
    delaycompress
    missingok
    notifempty
}
Enable SNMP port in firewall (optional)
Use the following commands to add port 162/UDP as a firewall exception:
firewall-cmd --permanent --add-service=snmptrap
firewall-cmd --reload
Applying the SNMP Trap configuration
Run the following commands to restart the snmptrapd service and enable it to run after system boot.
systemctl restart snmptrapd
systemctl enable snmptrapd
Stop unnecessary services
If you don’t want to monitor the server using SNMP, you can stop and disable the snmpd service.
This does not affect the process of collection and sending of the configured SNMP traps to Zabbix.
systemctl disable snmpd --nowYou’ve now successfully completed the SNMP traps collection setup and you can move on to setting up Zabbix itself.
Zabbix Server configuration
First, enable the SNMP trapper and set the path to the trapper log file.
Open Zabbix Server configuration file /etc/zabbix/zabbix_server.conf:
nano /etc/zabbix/zabbix_server.confEdit the following configuration directives here and save the file.
### Option: SNMPTrapperFile
#       Temporary file used for passing data from SNMP trap daemon to the server.
#       Must be the same as in zabbix_trap_receiver.pl or SNMPTT configuration file.
#
# Mandatory: no
# Default:
# SNMPTrapperFile=/tmp/zabbix_traps.tmp

SNMPTrapperFile=/var/log/snmptrap/snmptrap.log

### Option: StartSNMPTrapper
#       If 1, SNMP trapper process is started.
#
# Mandatory: no
# Range: 0-1
# Default:
# StartSNMPTrapper=0

StartSNMPTrapper=1
To apply the changed configuration parameters, restart the Zabbix Server:
systemctl restart zabbix-serverZabbix Proxy configuration (optional)
If you are setting up Zabbix Proxy, the procedure is exactly the same.
The only difference is that the same configuration directives will be modified in the Zabbix Proxy configuration file in /etc/zabbix/zabbix_proxy.conf:
nano /etc/zabbix/zabbix_proxy.confHere, modify the configuration directives StartSNMPTrapper and SNMPTrapperFile same as with the Zabbix Server:
### Option: SNMPTrapperFile
#       Temporary file used for passing data from SNMP trap daemon to the proxy.
#       Must be the same as in zabbix_trap_receiver.pl or SNMPTT configuration file.
#
# Mandatory: no
# Default:
# SNMPTrapperFile=/tmp/zabbix_traps.tmp

SNMPTrapperFile=/var/log/snmptrap/snmptrap.log

### Option: StartSNMPTrapper
#       If 1, SNMP trapper process is started.
#
# Mandatory: no
# Range: 0-1
# Default:
# StartSNMPTrapper=0

StartSNMPTrapper=1
Following by a restart of the Zabbix Proxy system service:
systemctl restart zabbix-proxyNow, you have completed the entire setup for collecting SNMP traps, and all that remains is to test the functionality and apply the collection of this data in Zabbix.
Testing the configuration using CLI
Send a test SNMPv2 trap (simulatin “linkDown”) with the following command:
snmptrap -v 2c -c initmax localhost '' SNMPv2-MIB::snmpMIB IF-MIB::linkDown s eth0You can verify that the SNMP trap was sent correctly in the created SNMP trap file in the path /var/log/snmptrap/snmptrap.log:
tail -n15 /var/log/snmptrap/snmptrap.logTo give you an idea of what the output looks like directly in the log, here is an example:
2024-02-10T00:53:43+0100 ZBXTRAP 127.0.0.1
PDU INFO:
  notificationtype               TRAP
  errorstatus                    0
  transactionid                  9
  version                        1
  errorindex                     0
  community                      public
  requestid                      1092987547
  receivedfrom                   UDP: [127.0.0.1]:32856->[127.0.0.1]:162
  messageid                      0
VARBINDS:
  DISMAN-EVENT-MIB::sysUpTimeInstance type=67 value=Timeticks: (2804608) 7:47:26.08
  SNMPv2-MIB::snmpTrapOID.0      type=6  value=OID: SNMPv2-MIB::snmpMIB
  IF-MIB::linkDown               type=4  value=STRING: "eth0"
Sending an SNMPv3 trap is a bit more complicated. So the test command simulating “linkDown” of the network adapter for SNMPv3 looks like this.
Remember to adapt the SNMP settings to your specific device or local infrastructure settings.
snmptrap -v3 -umonitoring -lauthPriv -aSHA512 -Azabbix_trap -xAES256 -X%Password123% -e0x800000020109840301 localhost "" SNMPv2-MIB::snmpMIB IF-MIB::linkDown s eth1You can then find the output again in the file /var/log/snmptrap/snmptrap.log:
tail -n20 /var/log/snmptrap/snmptrap.logYou can see an example of the output for SNMP trap version 3 here:
2024-02-10T01:11:42+0100 ZBXTRAP 127.0.0.1
PDU INFO:
  contextName
  errorstatus                    0
  notificationtype               TRAP
  securitylevel                  3
  requestid                      1877627576
  version                        3
  securityName                   monitoring
  transactionid                  1
  securitymodel                  3
  errorindex                     0
  messageid                      653771479
  contextEngineID                0x80001f888081e0634397b4c66500000000
  receivedfrom                   UDP: [127.0.0.1]:53391->[127.0.0.1]:162
  securityEngineID               0x800000020109840301
VARBINDS:
  DISMAN-EVENT-MIB::sysUpTimeInstance type=67 value=Timeticks: (2912564) 8:05:25.64
  SNMPv2-MIB::snmpTrapOID.0      type=6  value=OID: SNMPv2-MIB::snmpMIB
  IF-MIB::linkDown               type=4  value=STRING: "eth1"
We intentionally send test commands here to a different network interface for SNMPv2 (eth0) and SNMPv3 (eth1) so that they can be easily distinguished from each other.
Now we can move on to setting up the host and creating a template for monitoring using SNMP in Zabbix.
Configuration in Zabbix
First, you must prepare the selected host for monitoring using SNMP in Zabbix.
You can do this by adding an SNMP interface to it and setting the correct IP address and port to this interface.
In our test configuration, we will use localhost and the default port 161 for monitoring.
The SNMP community (variable {$SNMP_COMMUNITY}) needs to be adapted for standard SNMP monitoring.
For SNMP Trap, the community is already evaluated at the level of the configuration file for the snmptrapd daemon, see the /etc/snmp/snmptrapd.conf section. Therefore, it will not affect the SNMP Trap item and it needs to be taken into account in the settings.
You can do this either globally, in the Administration -> Macros section, or locally at the host level – in the Macros tab.
However, you can also make this change only at the level of the created SNMP interface, as you can see in the image below.
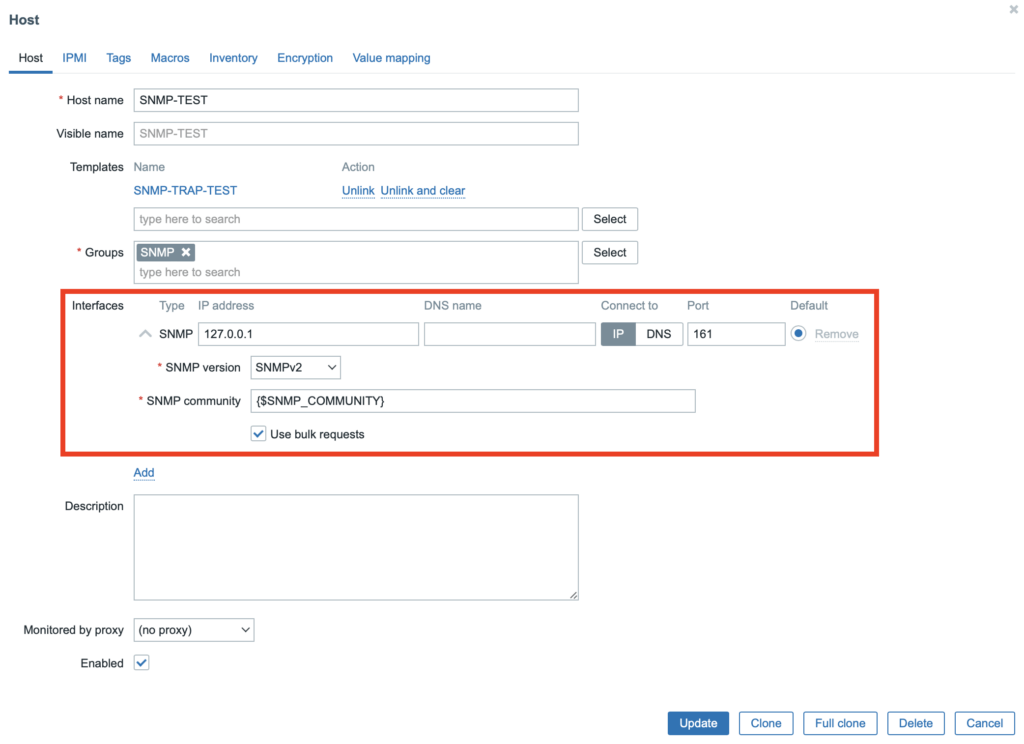
Save the host settings and at this point you are ready to start monitoring using SNMP.
If you want to try the basic functionality of SNMP, we have prepared a sample template for Zabbix 6.0 and later, which you can download from the link below.
Example SNMP trap template for Zabbix 6.0+ can be downloaded here: zabbix_snmptrap_example_template.xml.
However, if you like to research, or if you need to get a better understanding of the whole process, you can continue in the chapters below, where we will guide through you step by step.
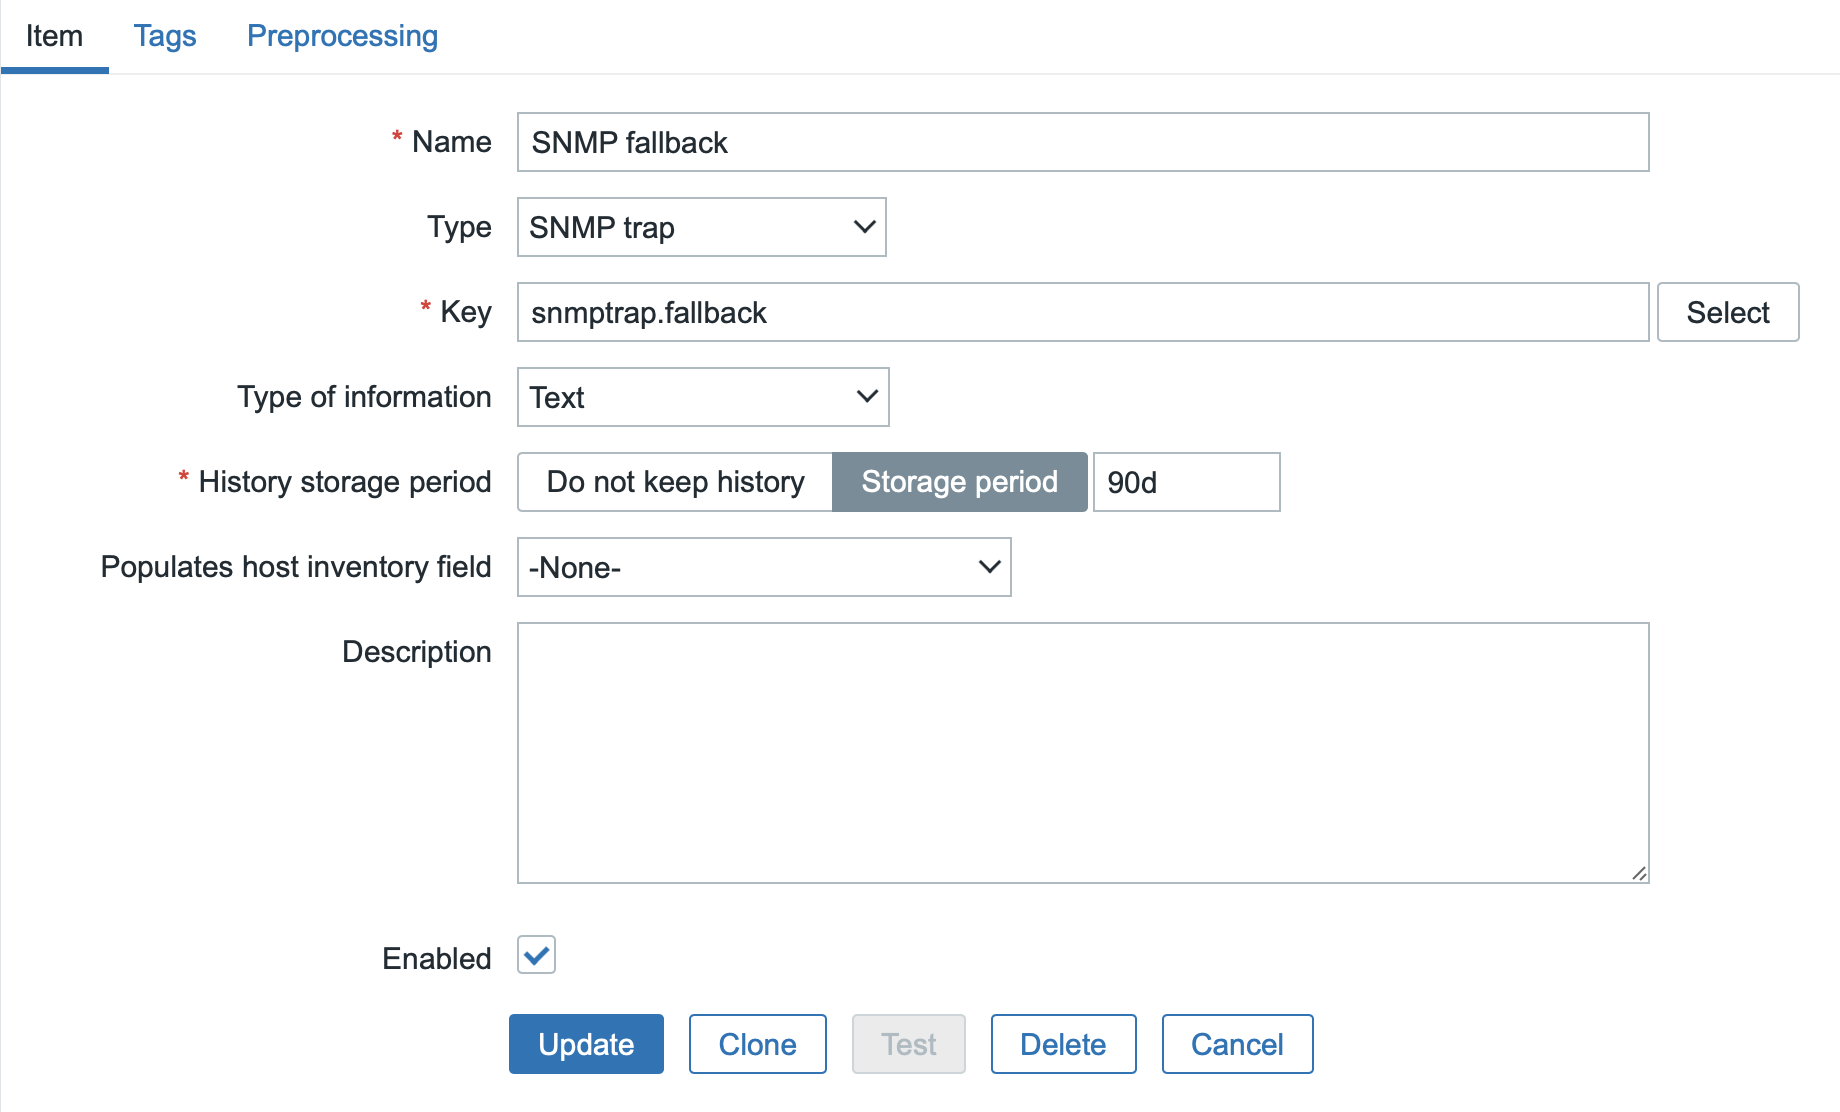
Creating snmptrap.fallback test item (optional)
The fallback type item is primarily used to capture all SNMP messages that were not previously captured by any other specific item in the given template.
Therefore, we will create an item of this type first – create a new template and add a new item to it and set it up as you can see in the image below.
Now try running the already used test command for SNMPv2 simulating linkDown on eth0 again:
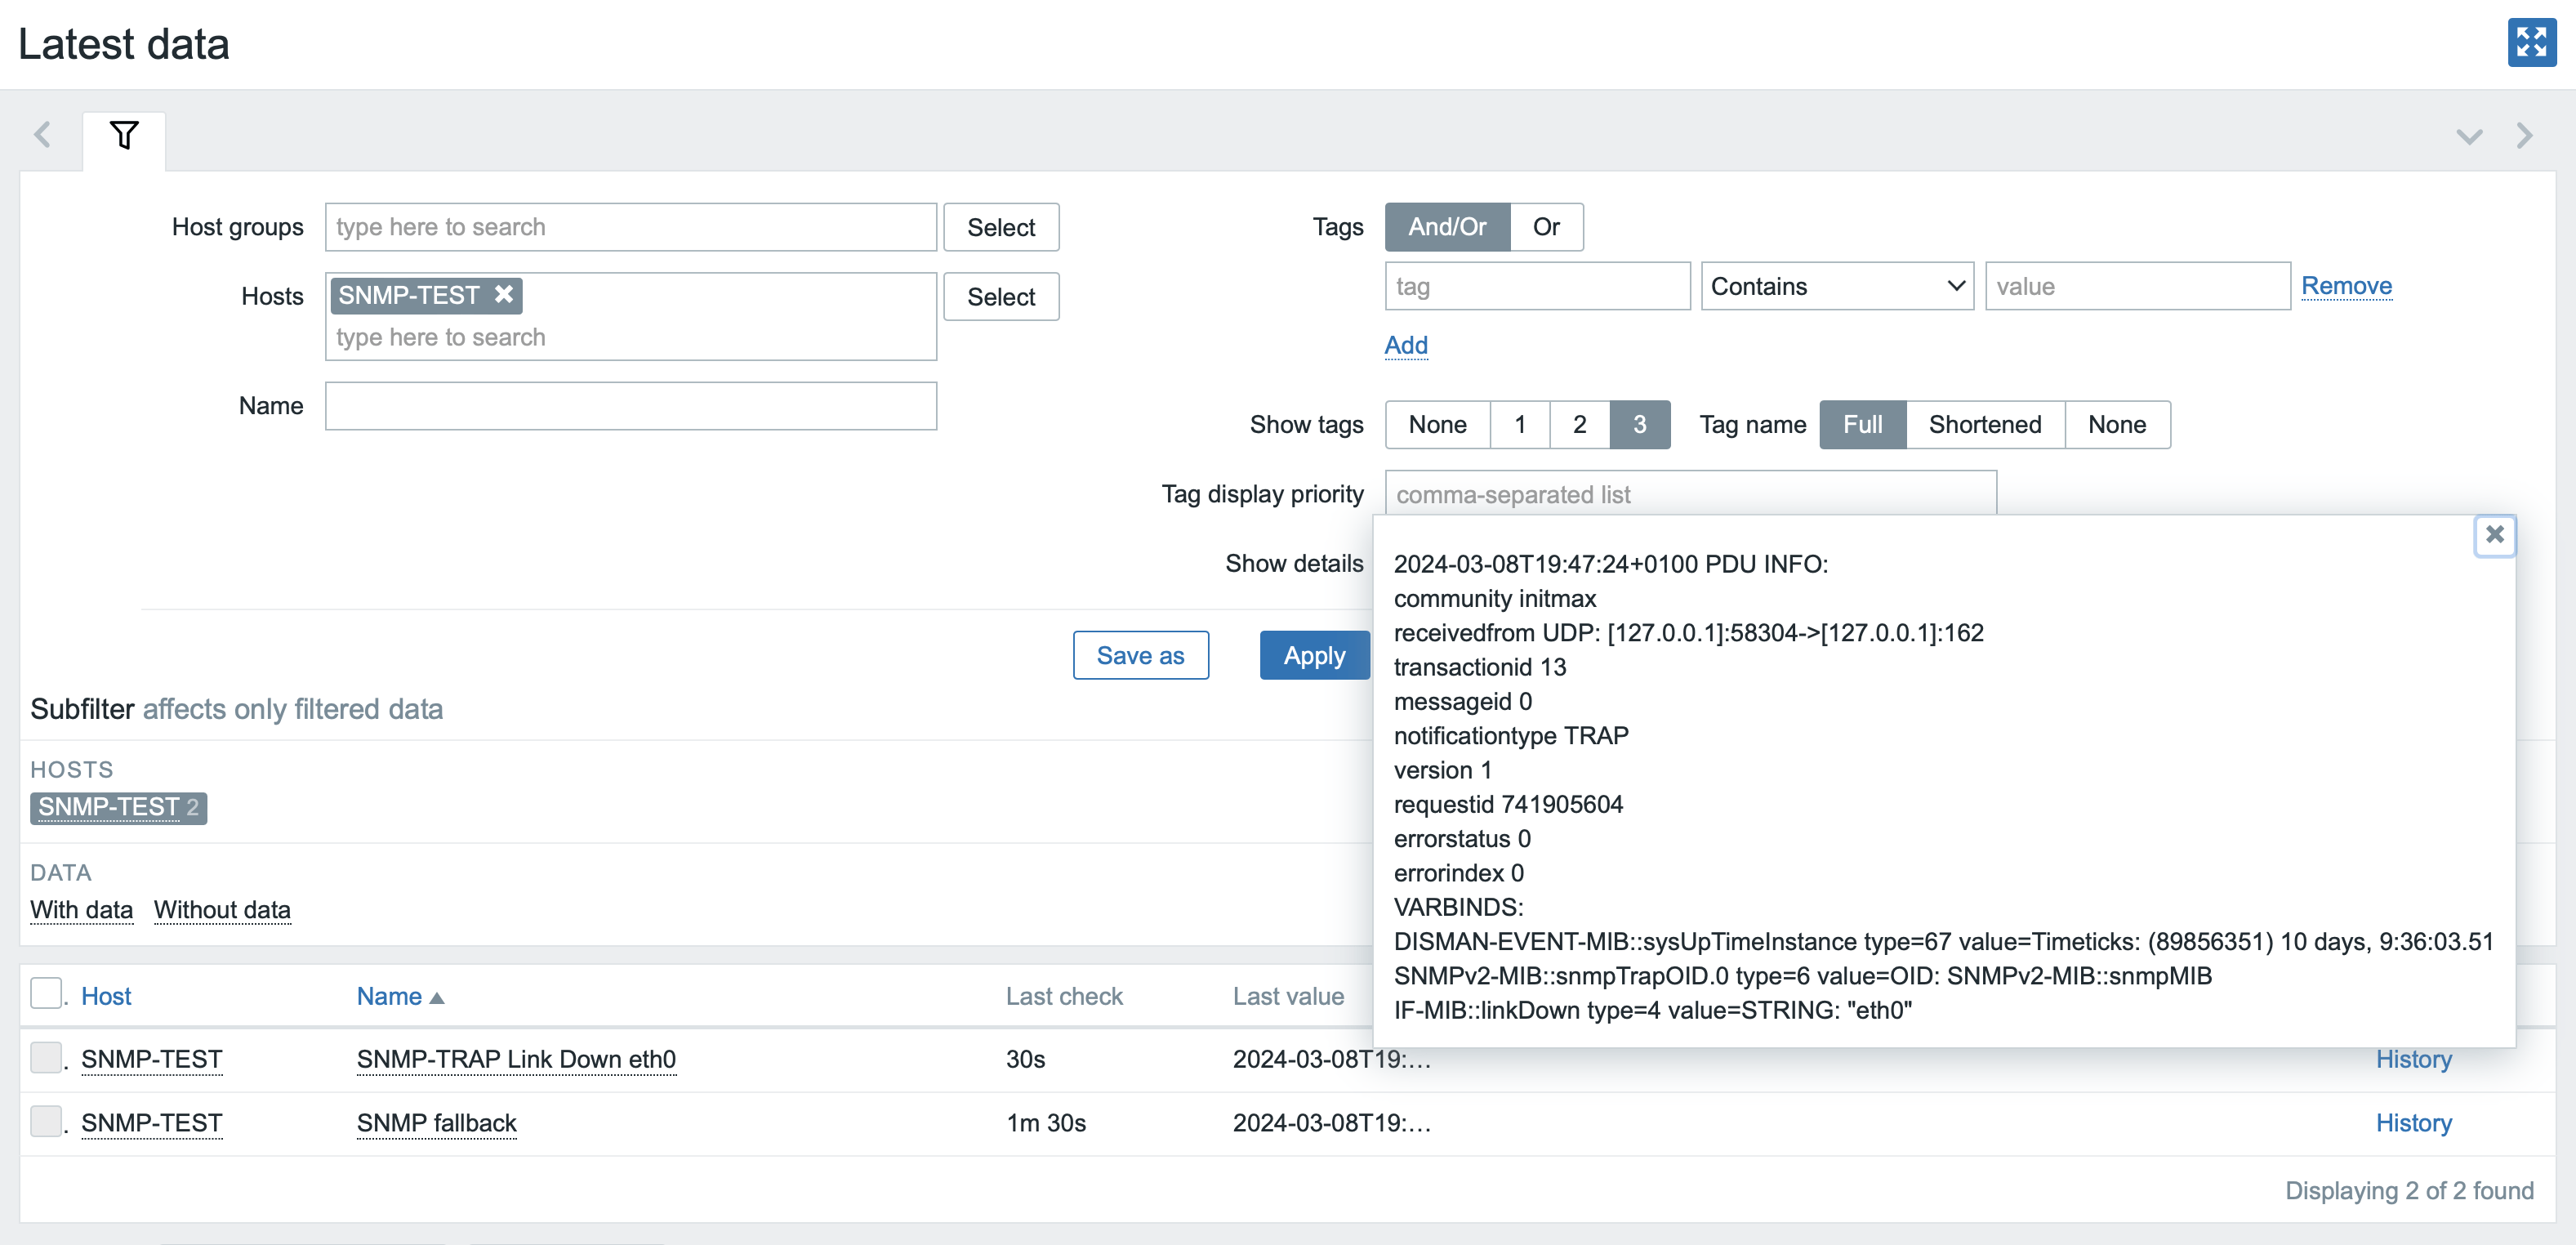
snmptrap -v 2c -c initmax localhost '' SNMPv2-MIB::snmpMIB IF-MIB::linkDown s eth0In Zabbix, in the Monitoring -> Latest data section, check on your test host that the data has arrived correctly.
Here you can see that the test data has indeed arrived correctly. The message has the correct SNMP community, the source server is indeed localhost, and the message data contains the sent string.
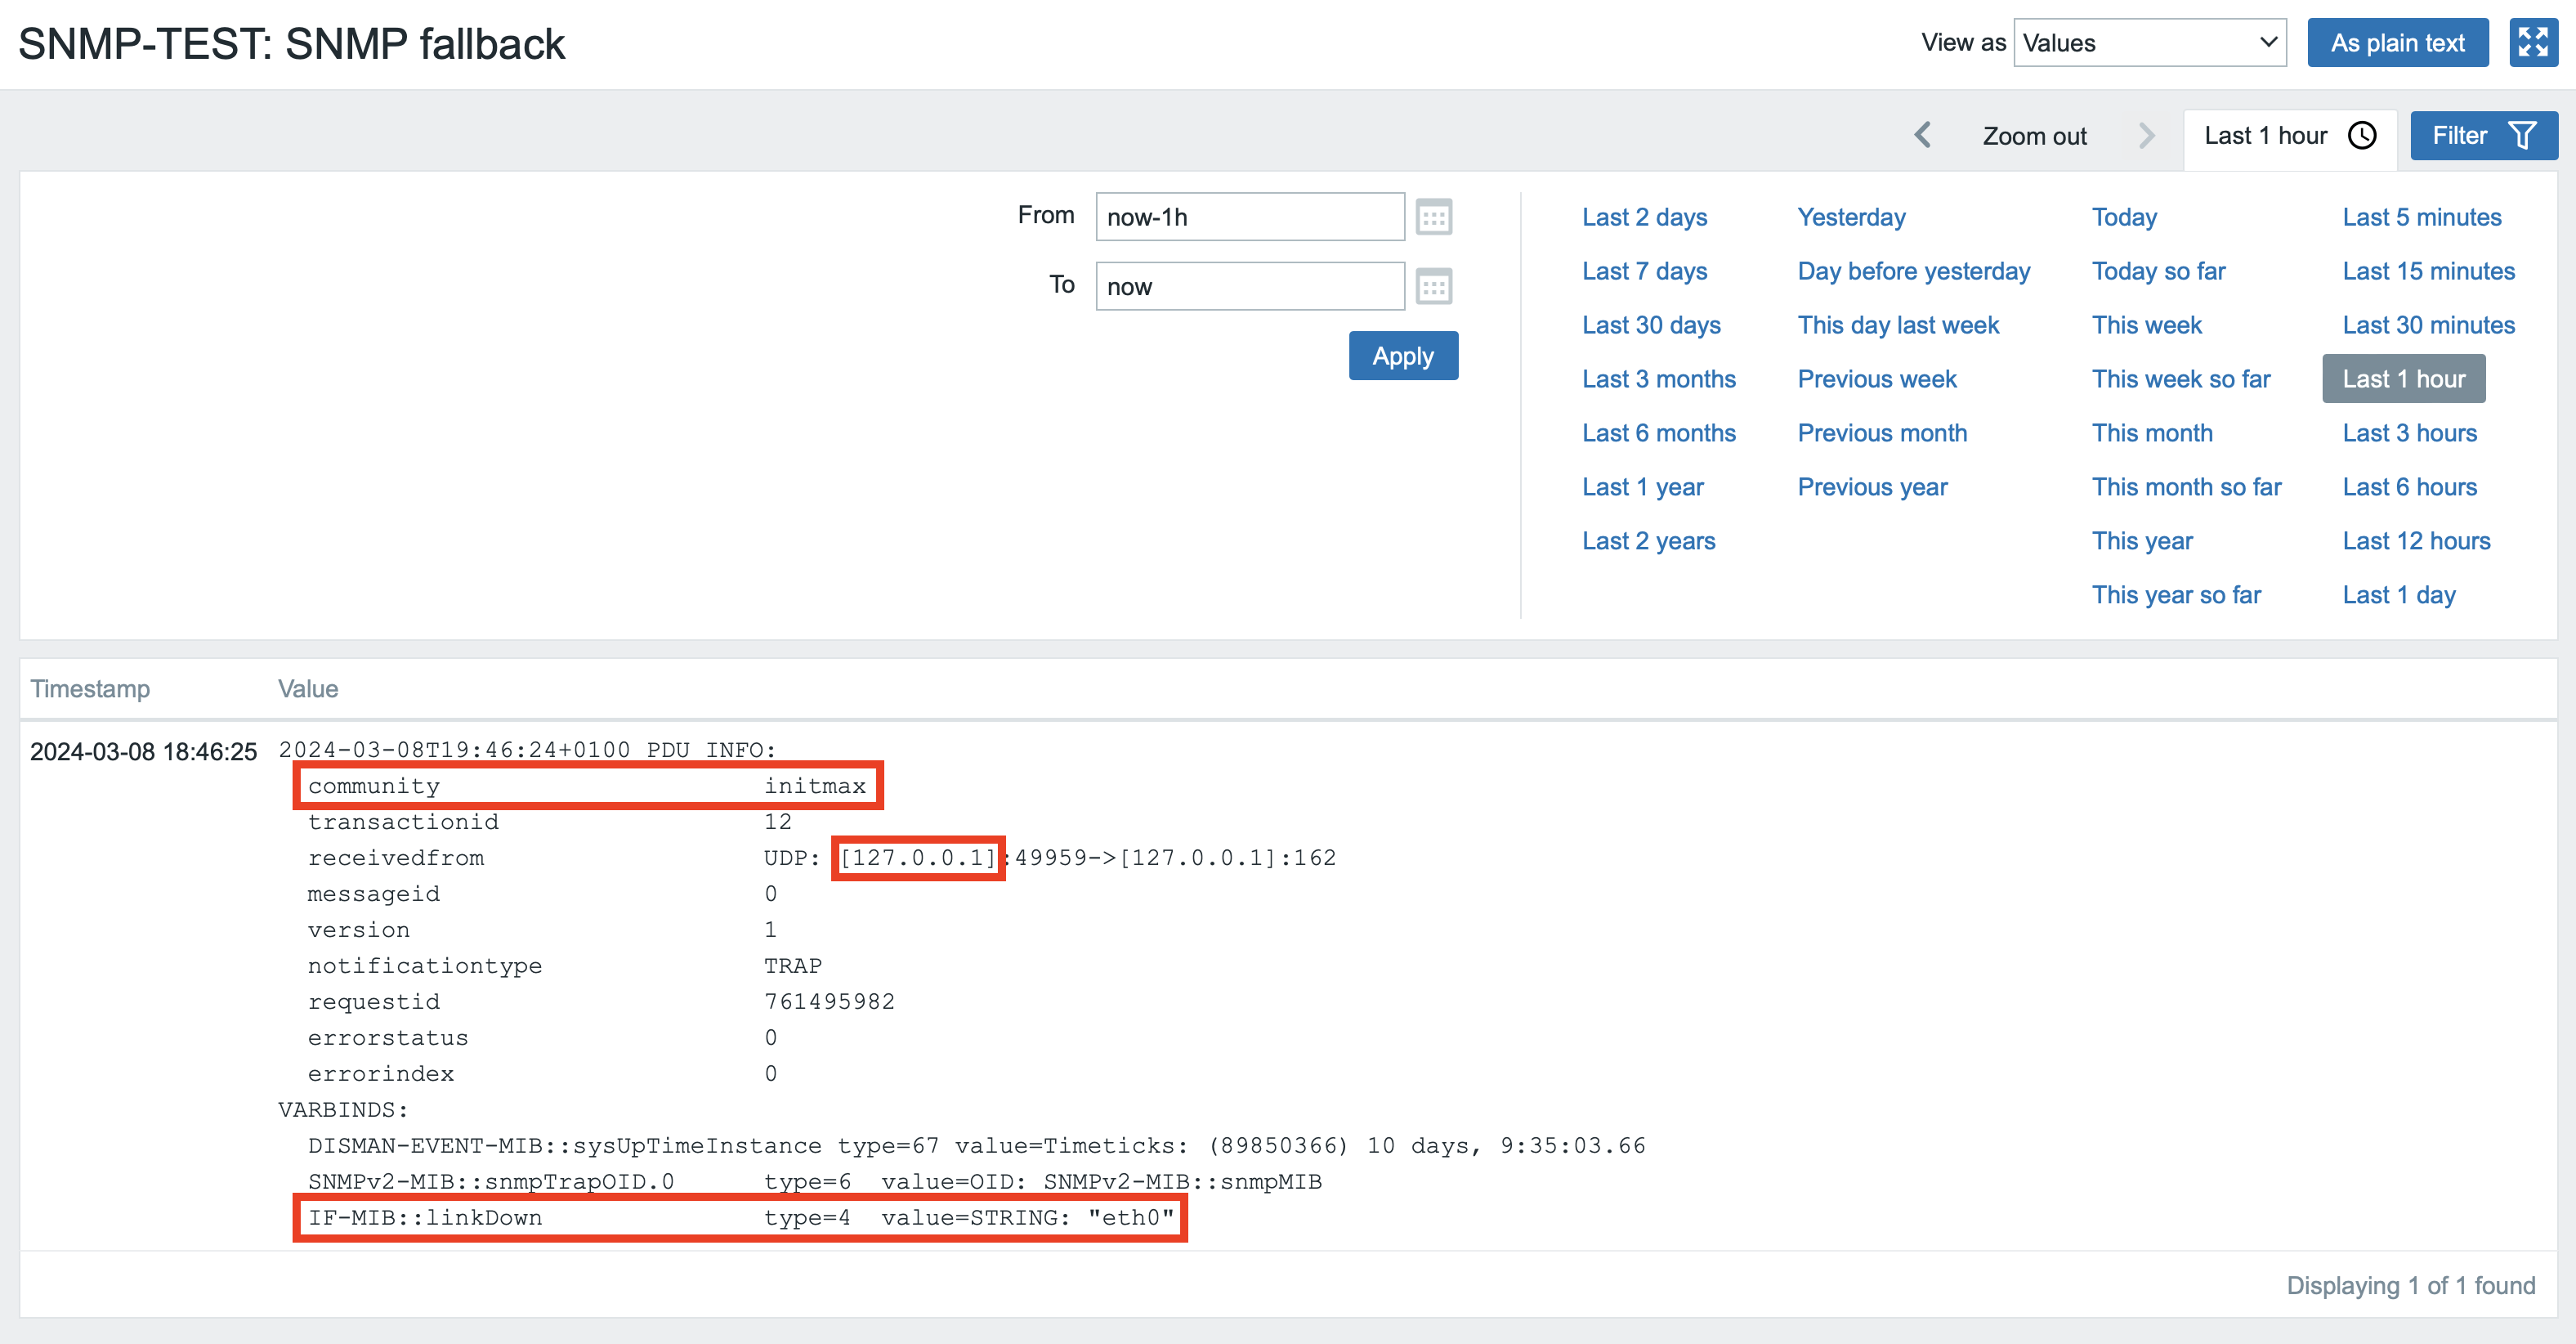
Now we can move to creating specific items for individual monitored items.
Creating snmptrap test item (optional)
In your new template, create new SNMP trap items that will correspond to the test commands from previous steps.
For simplicity, we will use a regular expression in the key of these items as you can see here:
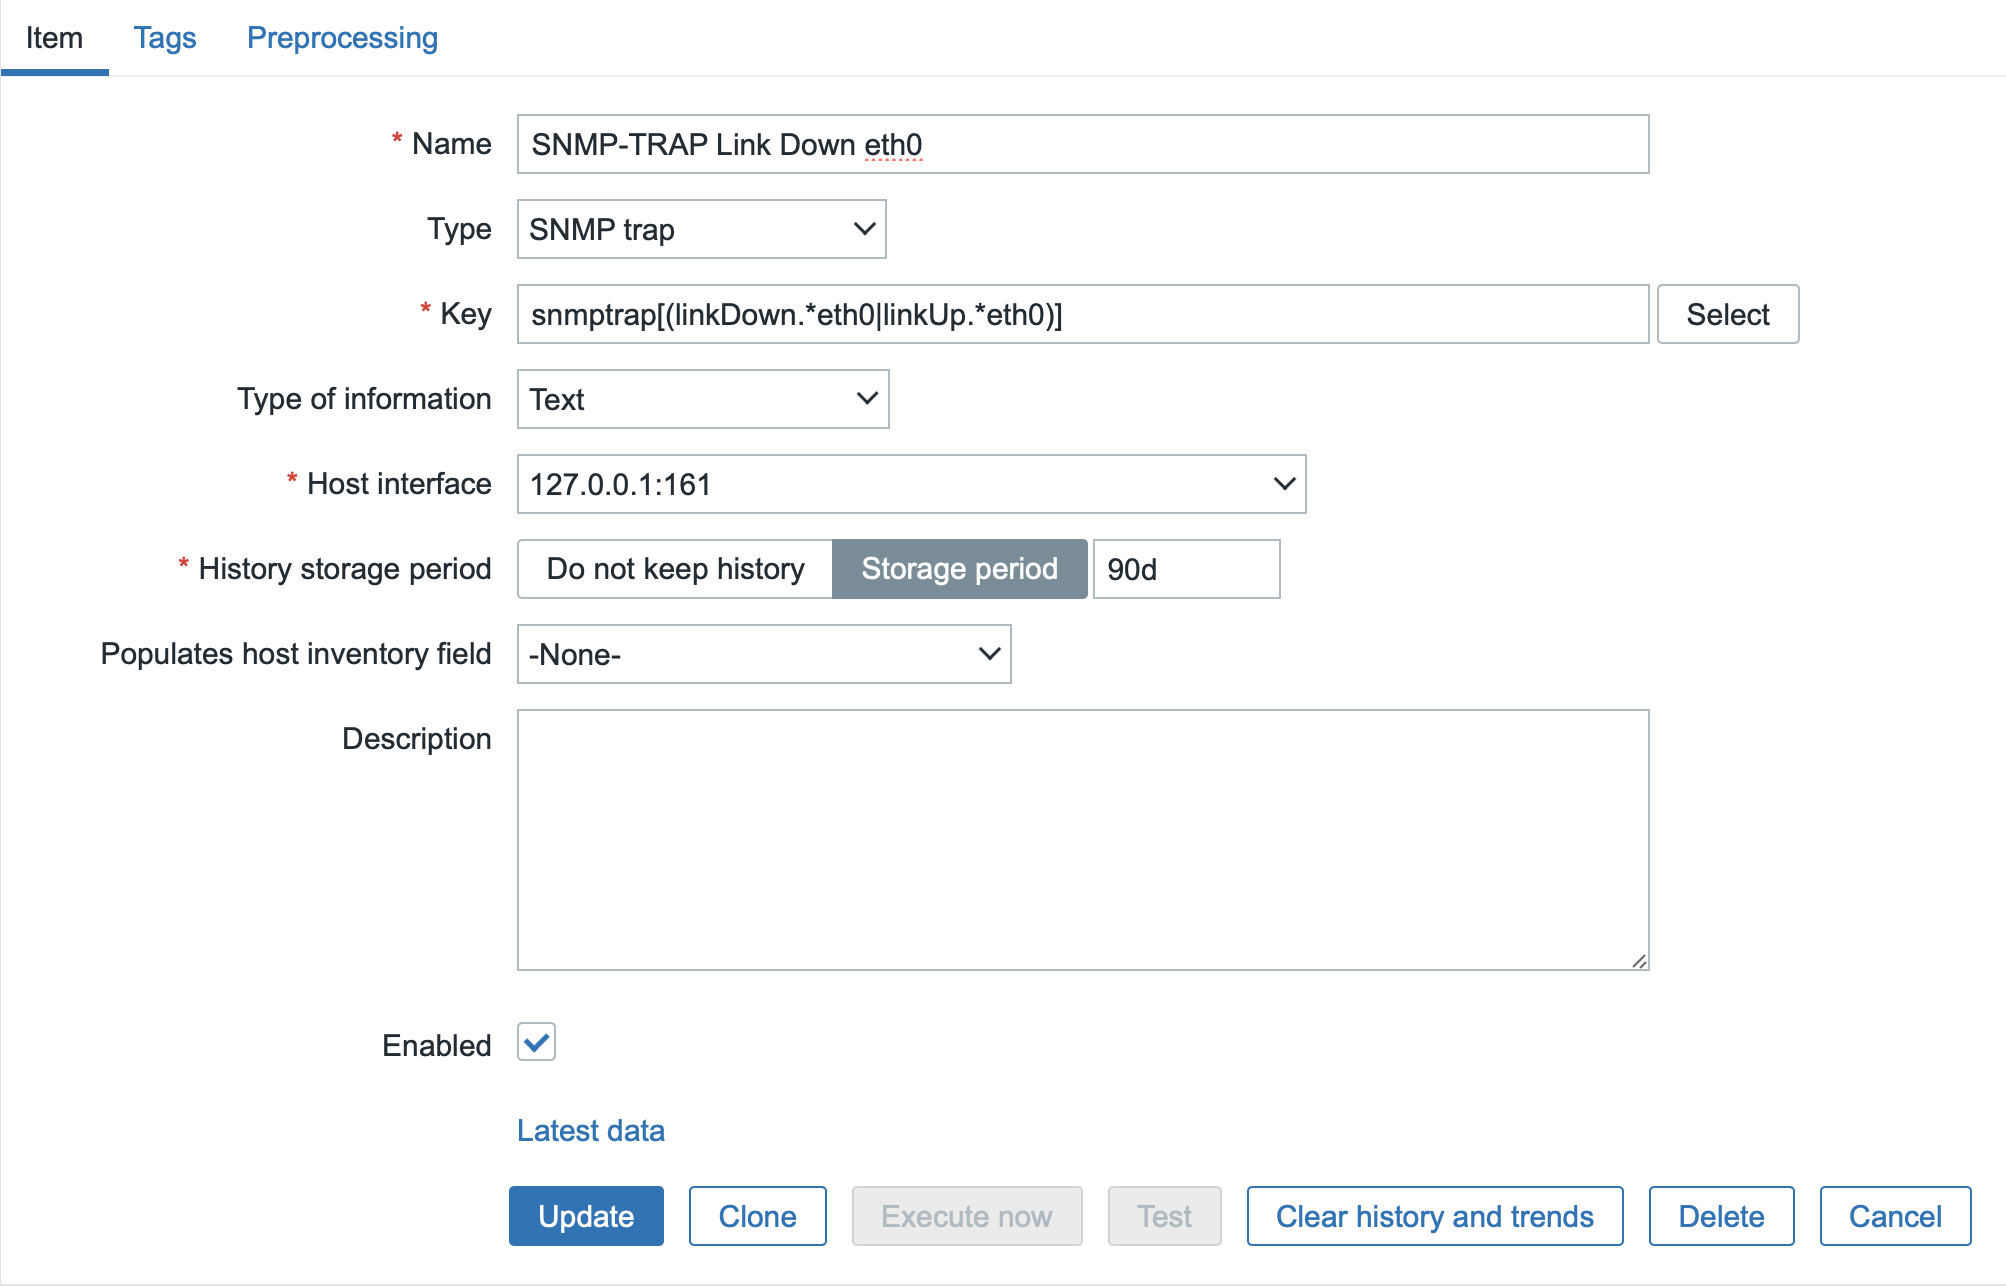
You can simply clone the second item for the test command on eth1 via SNMPv3 from the newly created item, and only change the name of the network interface to eth1 in the regular expression.
Save the template configuration and run our two test commands again.
For SNMPv2 on eth0:
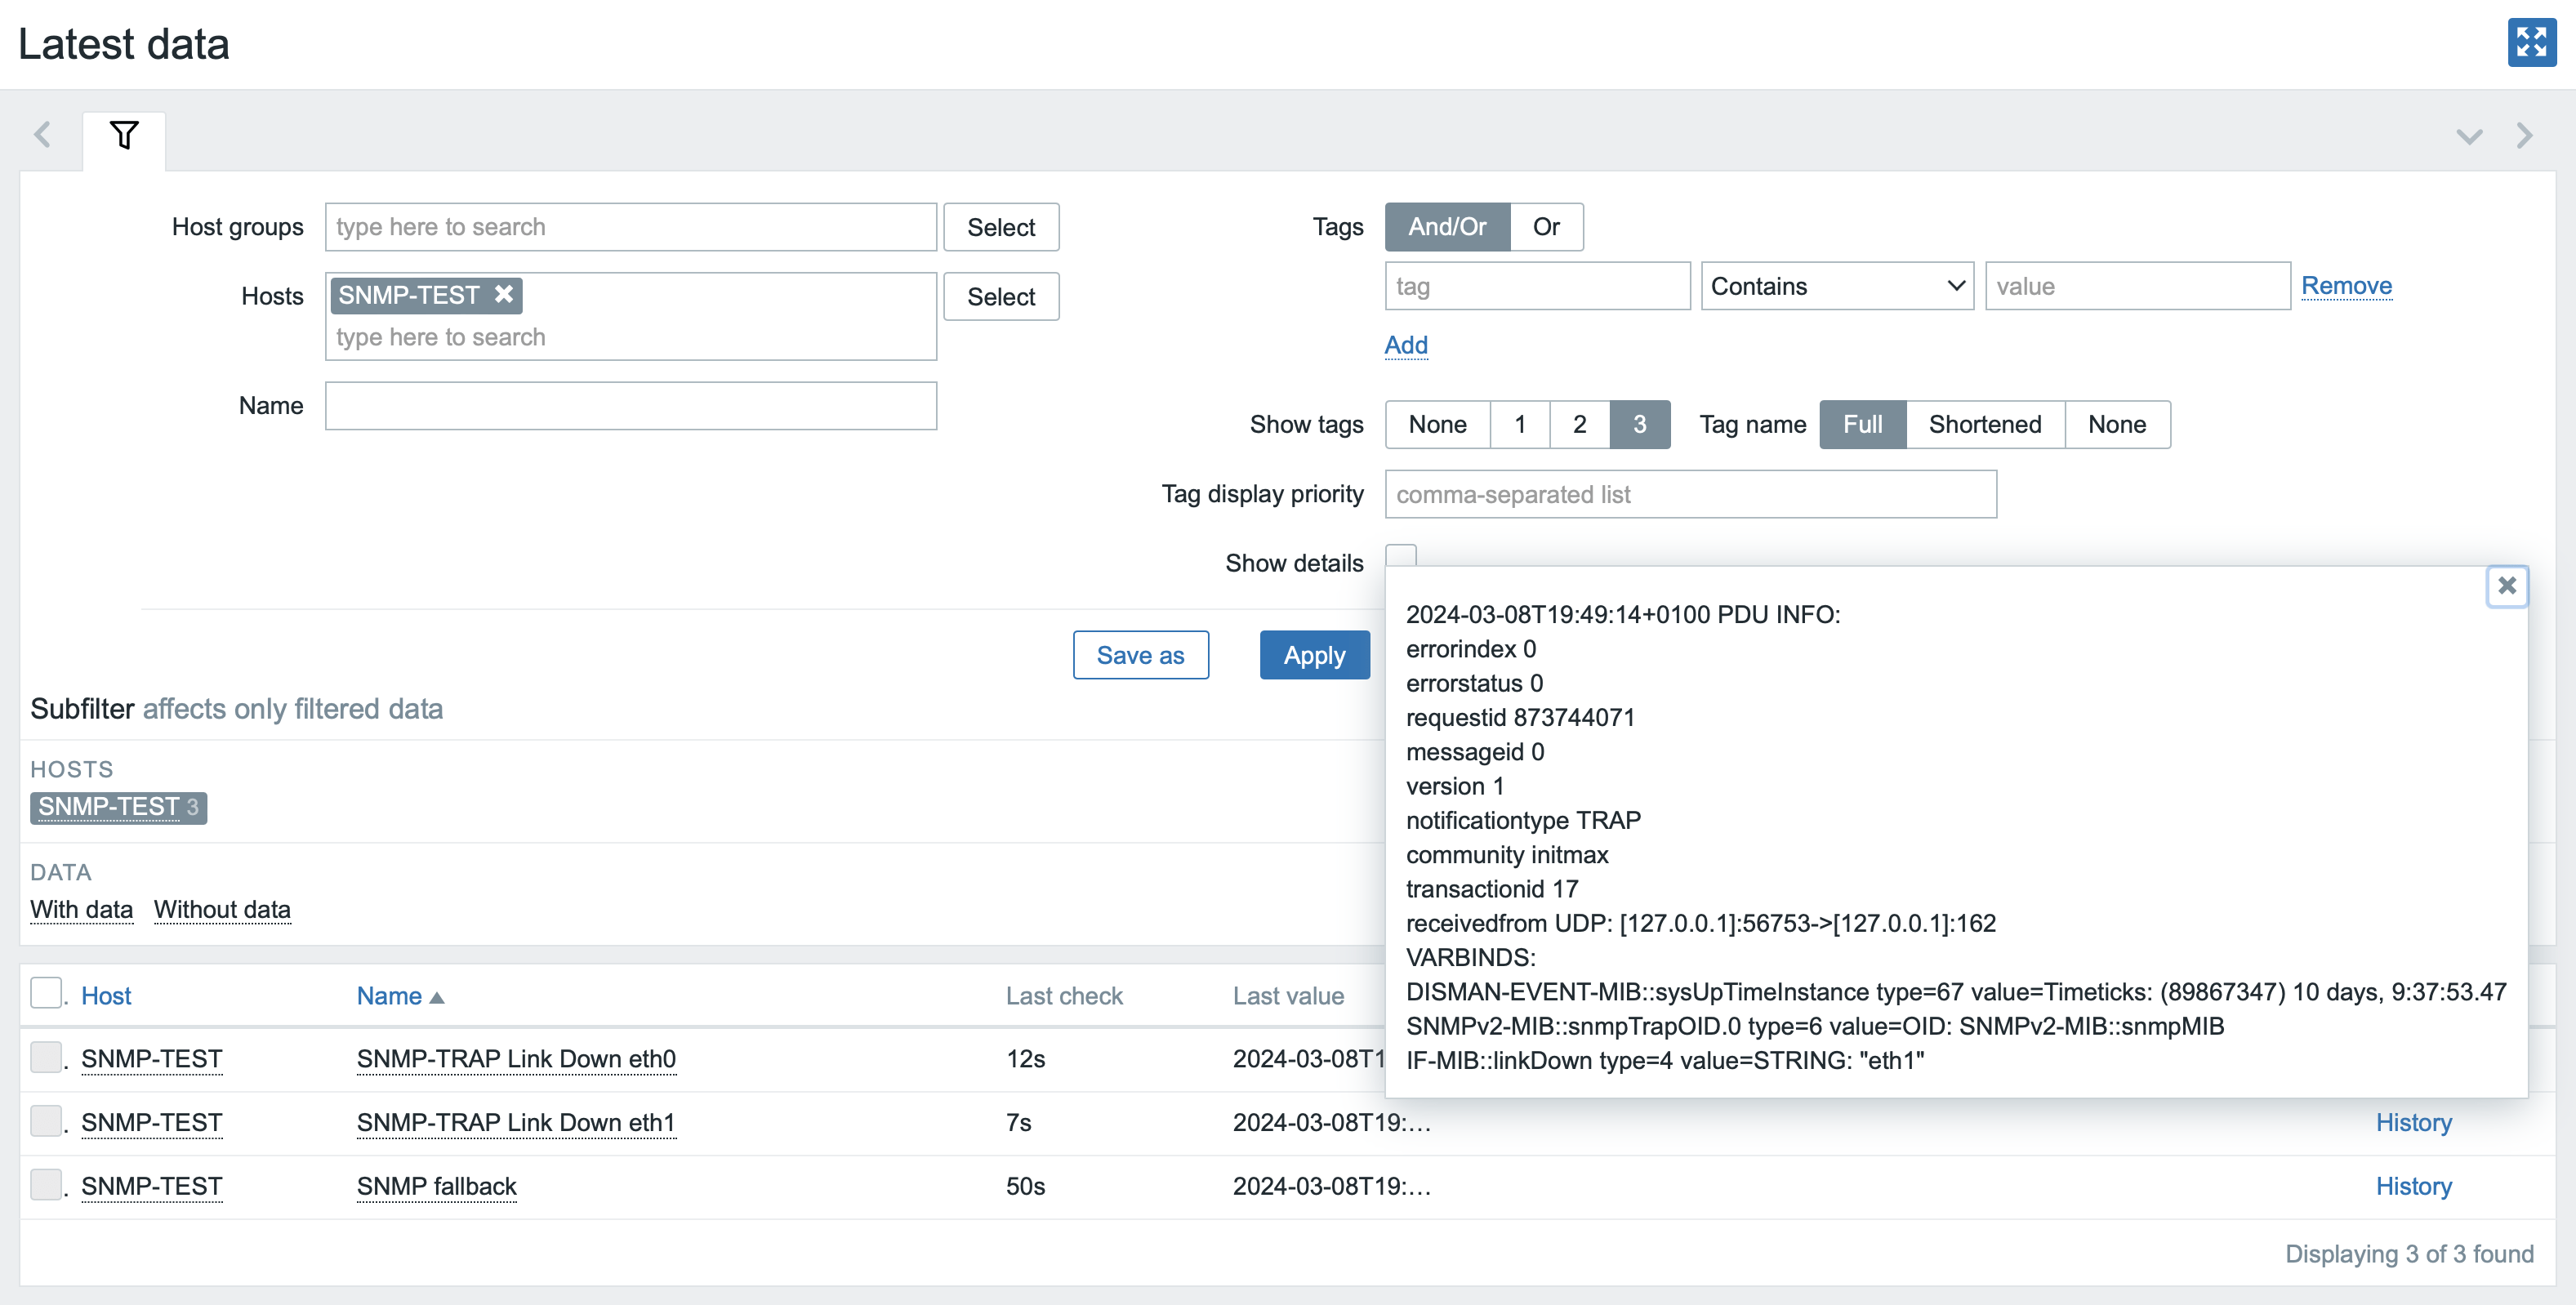
snmptrap -v 2c -c initmax localhost '' SNMPv2-MIB::snmpMIB IF-MIB::linkDown s eth0In the latest data, you will then see that this test did not catch snmptrap.fallback this time, but the correct item for this interface that you created beforehand.
And in the same way we will verify the functionality of the second snmptrap item for eth1.
Run our test command again for SNMPv3 to linkDown on interface eth1:
snmptrap -v3 -umonitoring -lauthPriv -aSHA512 -Azabbix_trap -xAES256 -X%Heslo123% -e0x800000020109840301 localhost "" SNMPv2-MIB::snmpMIB IF-MIB::linkDown s eth1And in latest data, verify that the message was successfully captured using this item:
Congratulations, this sample configuration is complete and you have successfully determined the basics of monitoring with SNMP traps!
Give us a Like, share us, or follow us 😍
So you don’t miss anything: