Zabbix version 7.0 LTS is here!
New version of Zabbix 7.0 LTS brings a number of interesting innovations.
| Contact us for a free consult | CONTACT US FOR A CONSULT AND FREE DEMO |
| We have prepared new thematic webinars and workshops for you |
what’s new in zabbix 7.0 lts (CZE) upgrade to the latest version 7.0 (CZE) INSTALLATION OF ZABBIX 7.0 IN 5 MINUTES (CZE) WORKSHOP: ZABBIX 7.0 Monitoring with browser item using selenium (CZE) Workshop: zabbix 7.0 zabbix proxy in high availibility and load balancing (CZE) |
| Training courses for the latest LTS version (Zabbix 7.0) | MORE INFORMATION ABOUT TRAINING COURSES |
| You can also click-through our DEMO Zabbix. Login confirmation can be done by clicking „sign in as guest„ button | SIGN IN TO THE ZABBIX DEMO |
New widgets
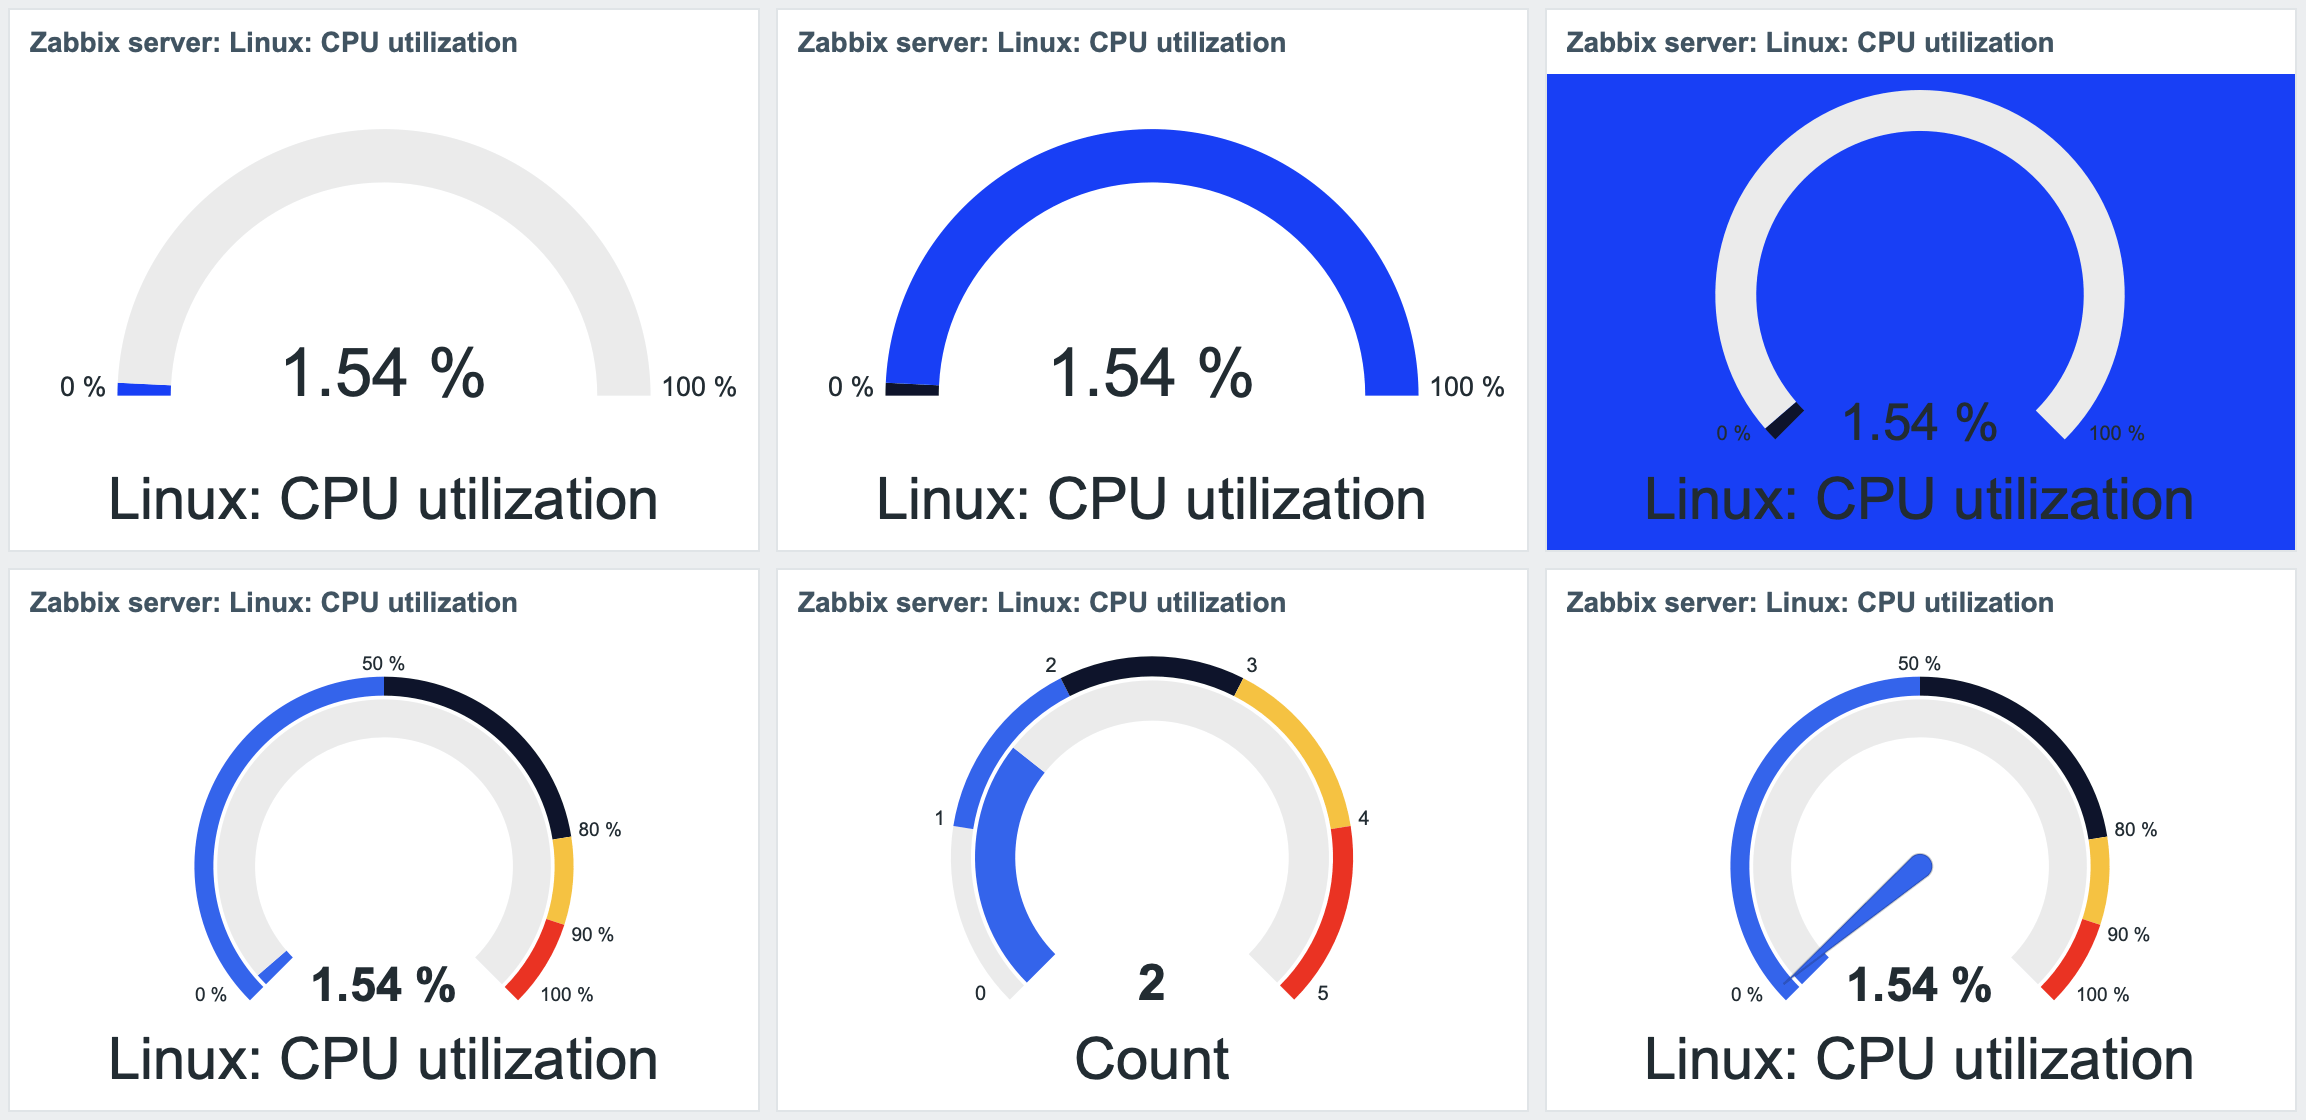
Gauge widget – This widget allows you to display the measured value on a scale with accurate visualization, similar to a clock. This enables quick and easy evaluation of the status of monitored metrics or indicators. The Gauge widget is ideal for displaying measurements such as temperature, humidity, data transmission rate or any other numeric indicator. A wide range of configuration options are available.
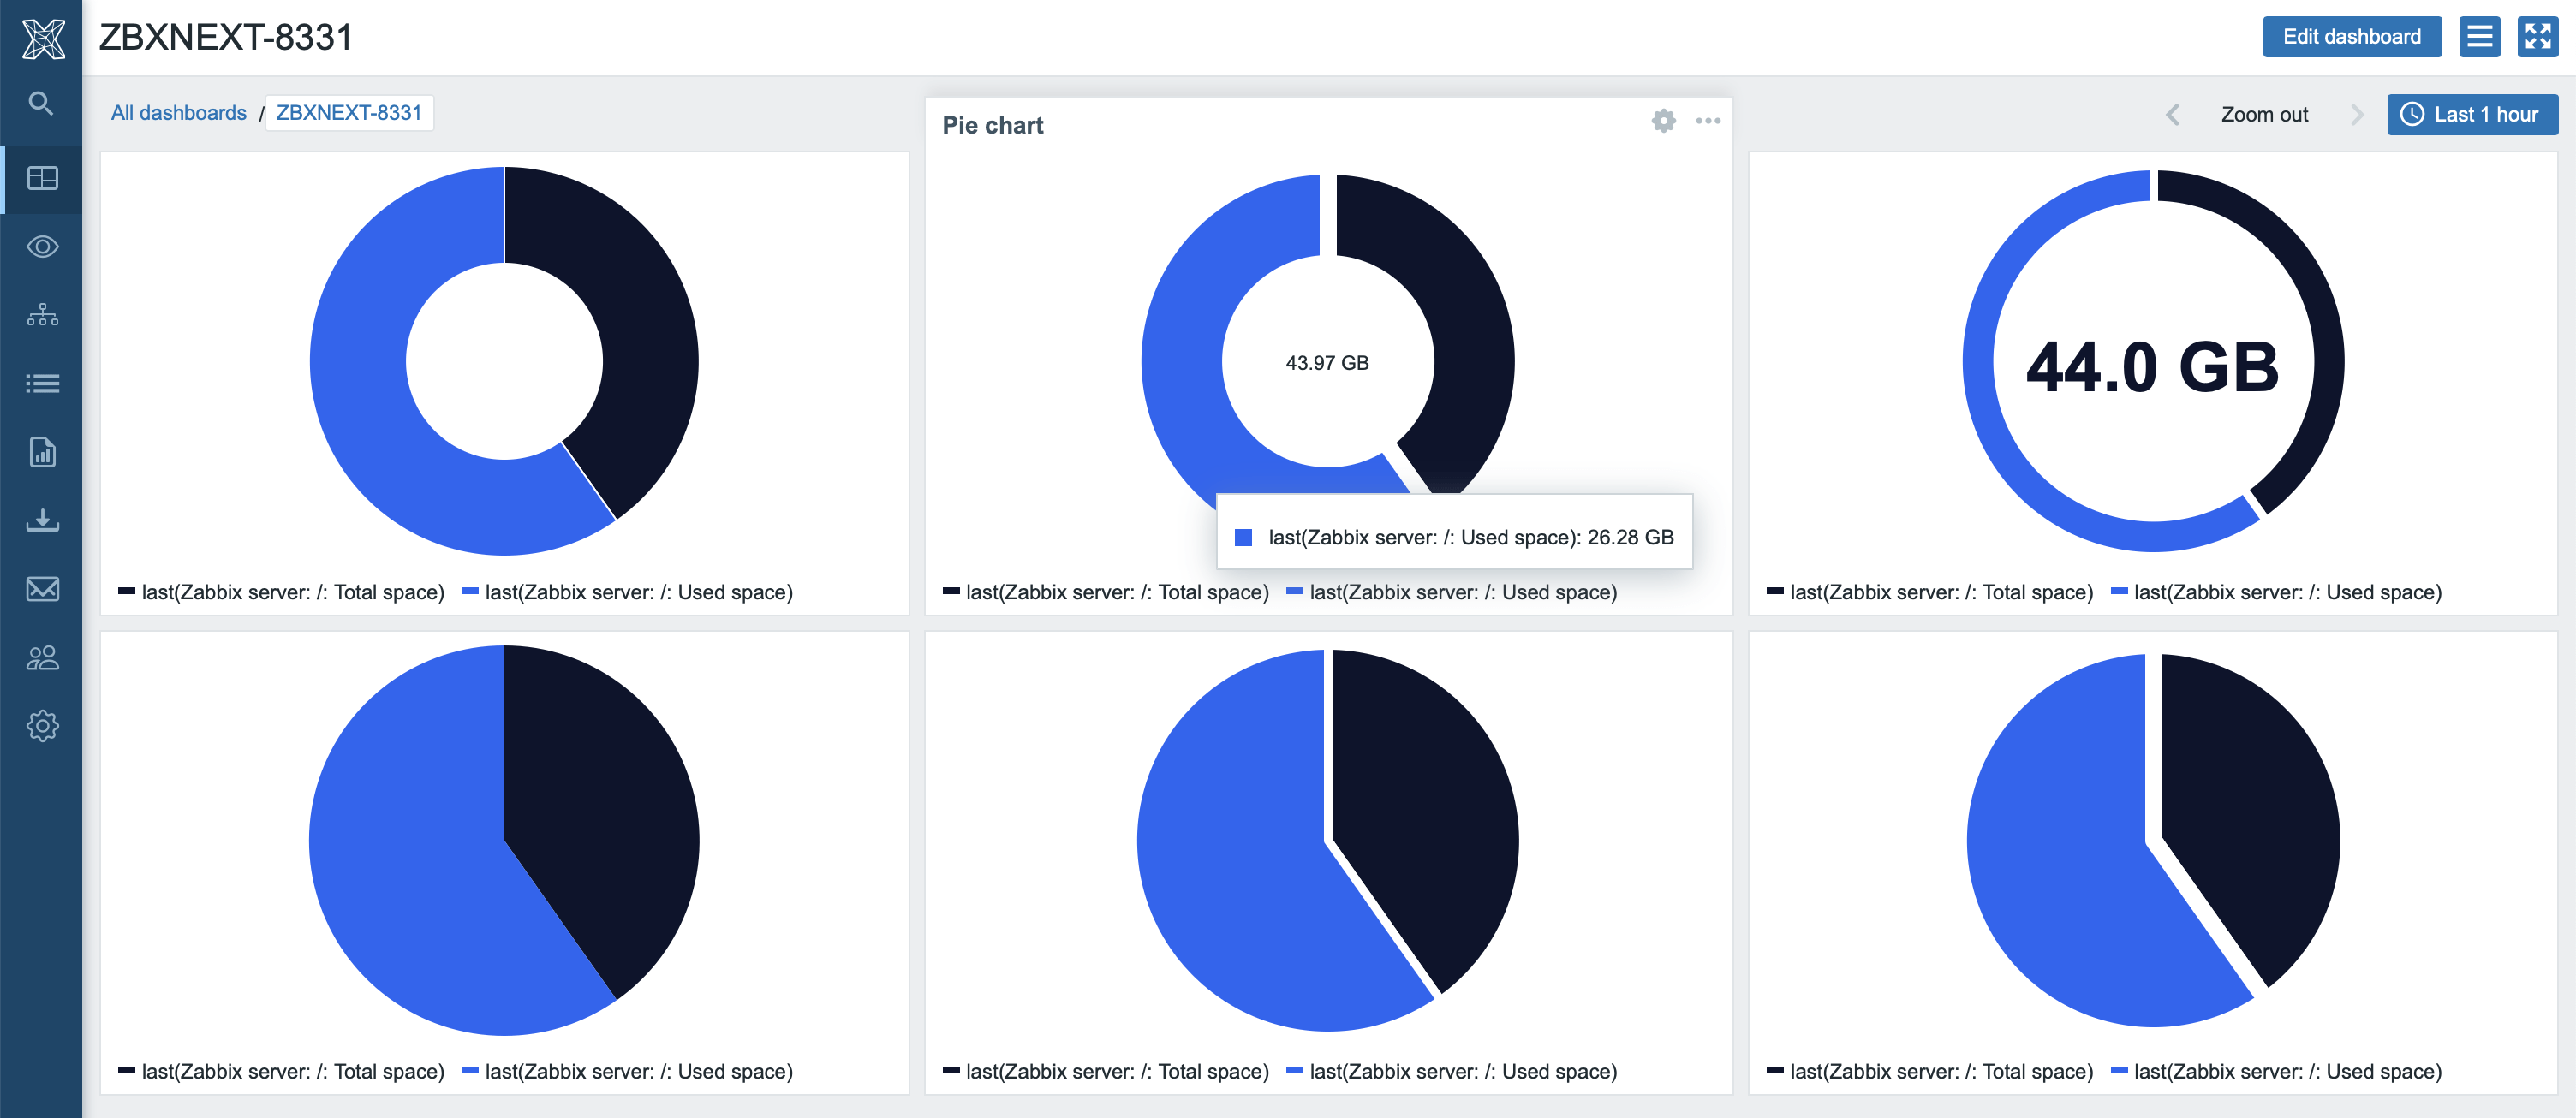
Pie widget – This widget in Zabbix offers various options for visualizing data using two basic types of pie charts: Pie and Donut.
- The Pie chart is a classic representation of the proportion of individual elements within a specific dataset. Each element is depicted as a slice of the pie, with the size of the slice relative to its value or percentage compared to the other elements.
- The Donut chart is a variation of the pie chart that adds empty space in the center, creating a “donut” effect. This visualization allows for displaying additional information or labels in the center of the chart, which can provide further details or context.
With these two visualizations, Zabbix users can easily visualize data using pie charts and gain an overview of the proportion of individual elements within their dataset. This way, they can quickly identify trends, distributions, or relationships among the data.
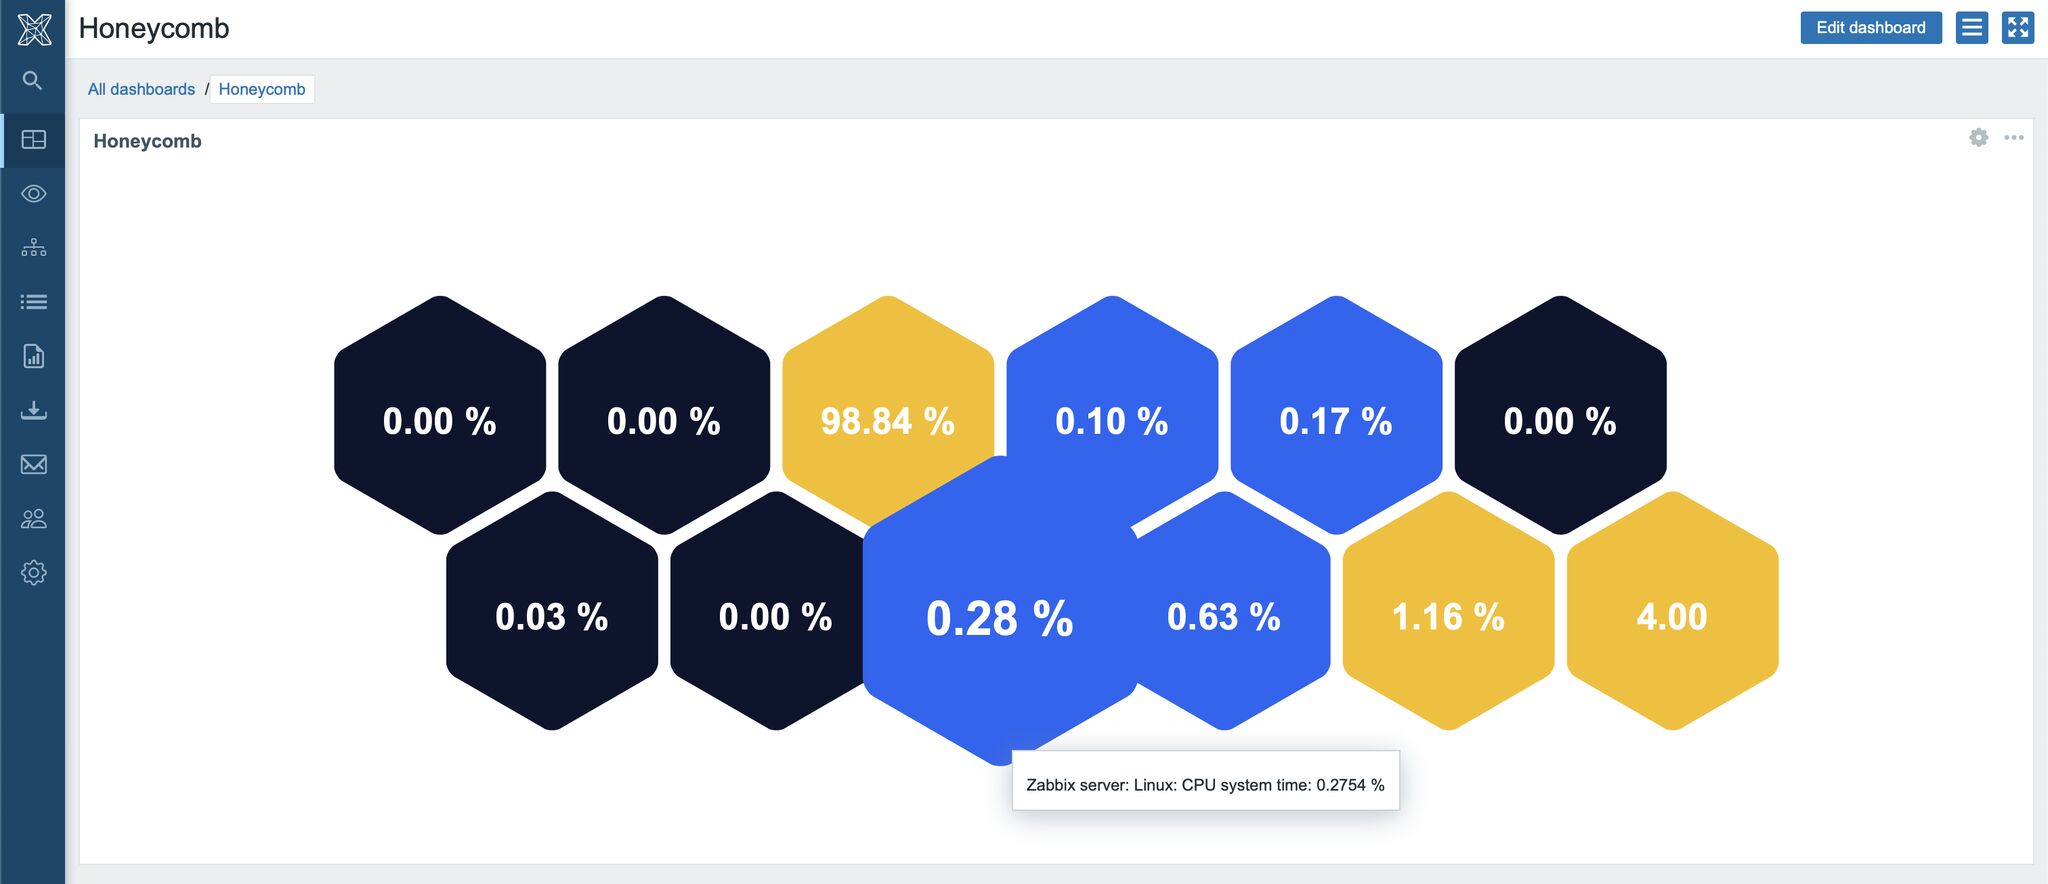
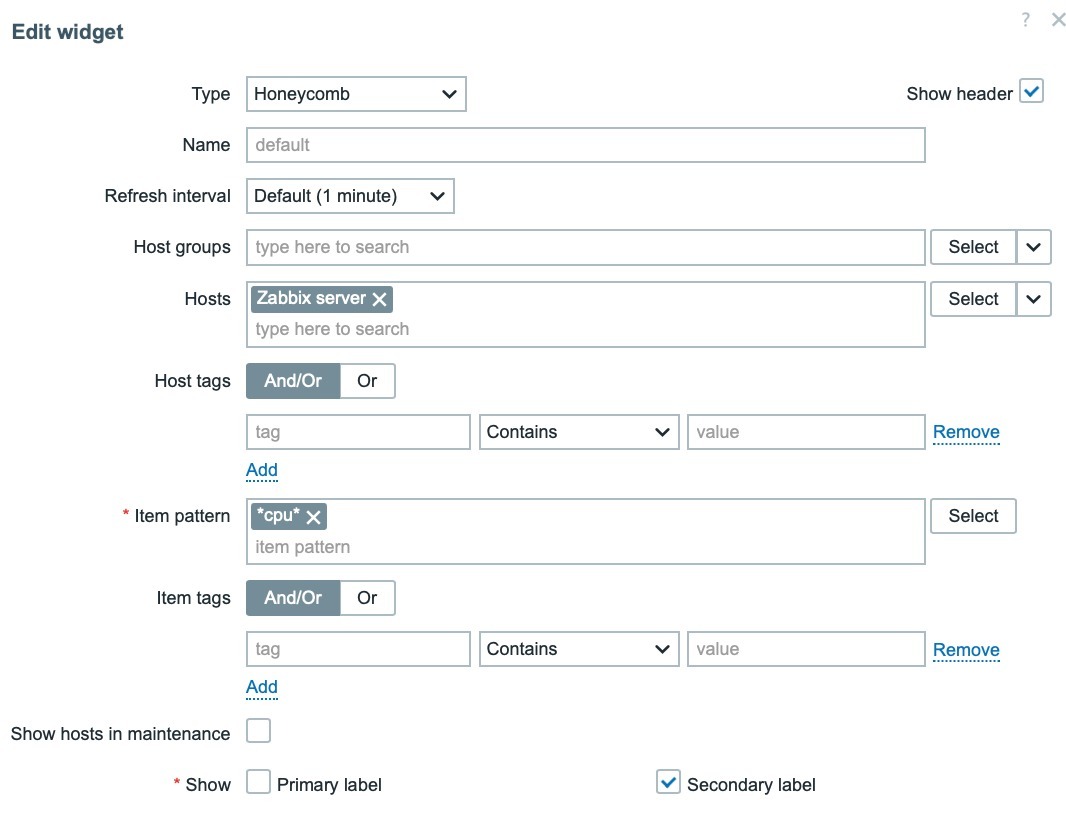
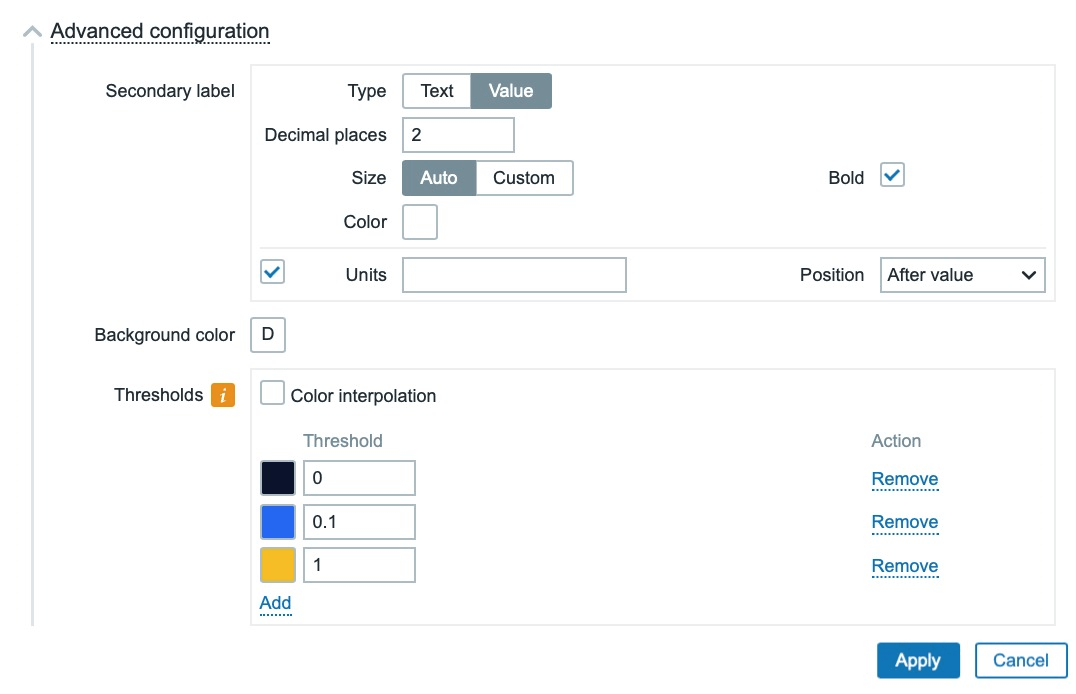
Honeycomb widget – This additional, all-new widget allows you to create honeycomb-style hexagonal information blocks displaying statistics and information on both sides in one unit. The widget can filter by hosts, host groups, hosts tags, item tags and item patterns. Each cell contains the name of the item or host, and its color changes depending on a specific value.
Here you can see the configuration options which are available for this new widget:
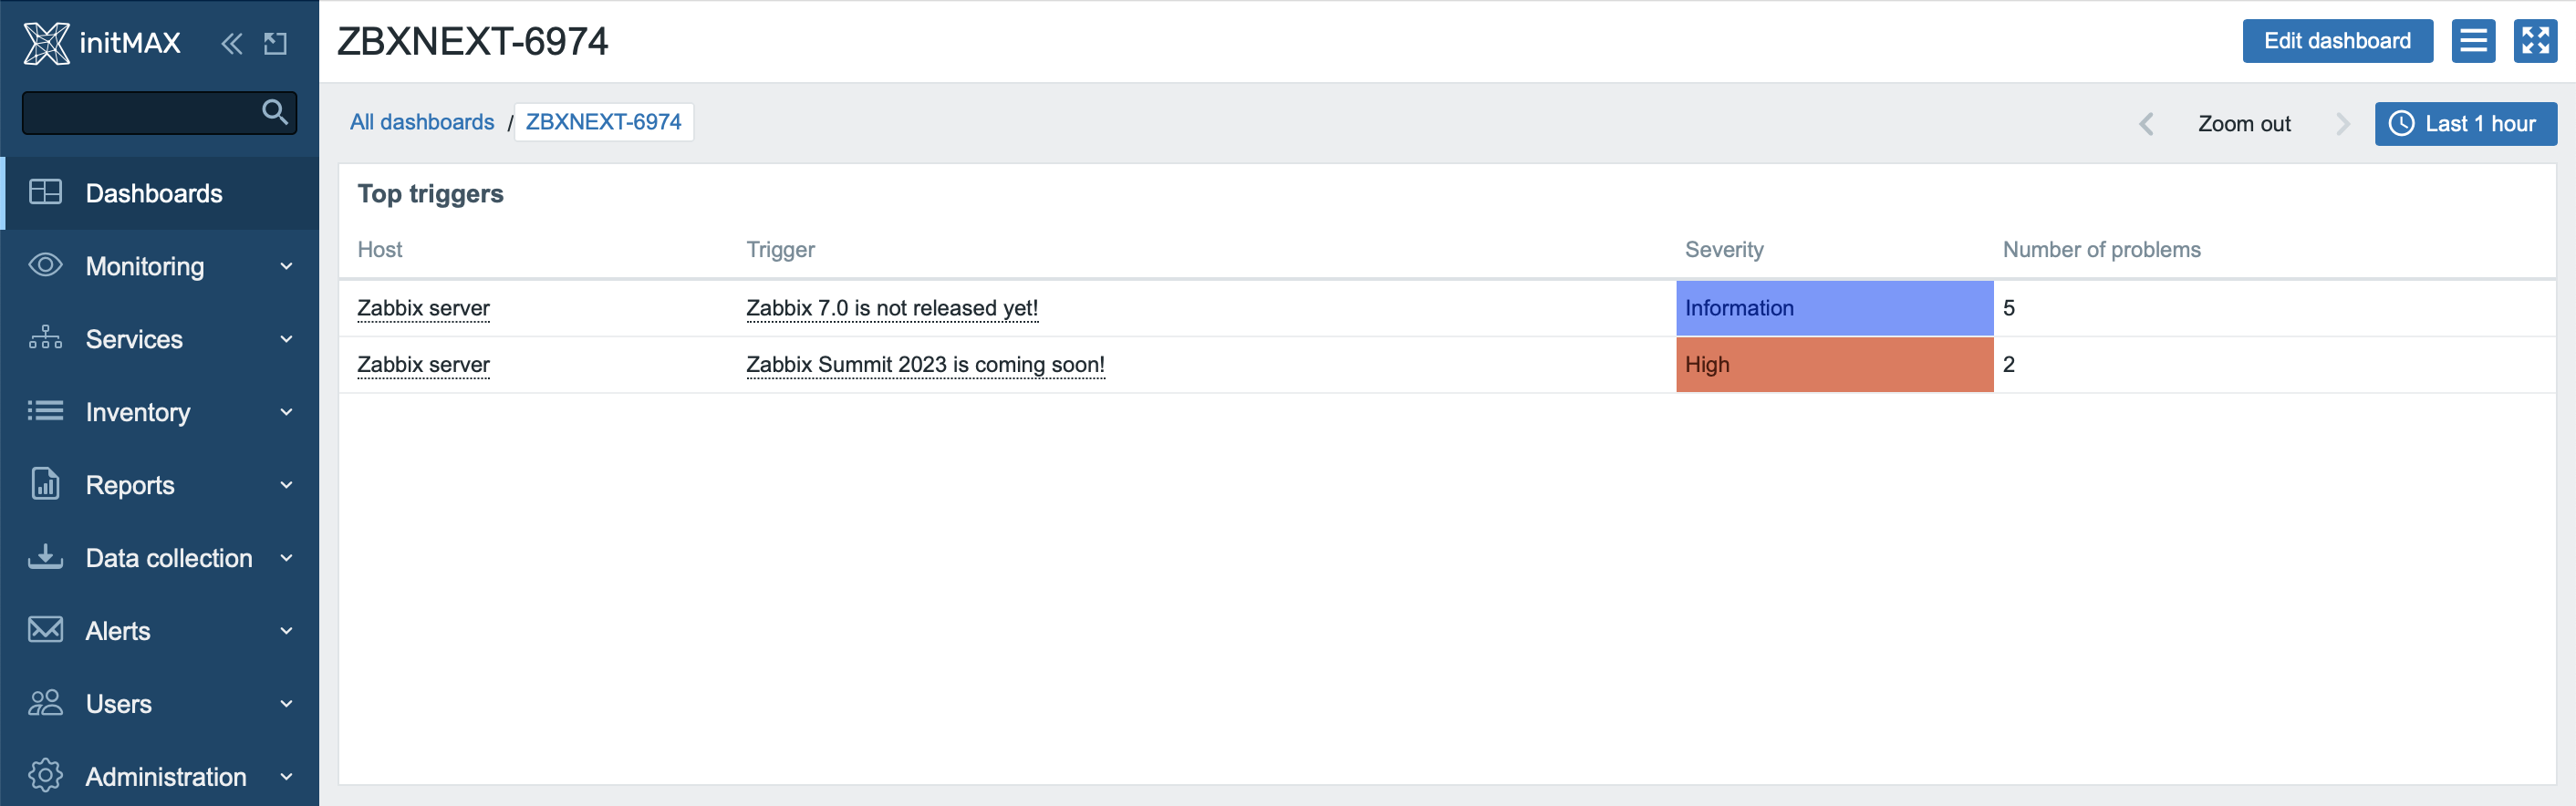
Top Triggers widget – In this widget, you can see the triggers that have most frequently changed their state during the evaluation period, sorted by the number of state changes. You can also filter them by hosts, host groups, tags, problem name and severity. Additionally, there is an option to set the number of displayed rows.
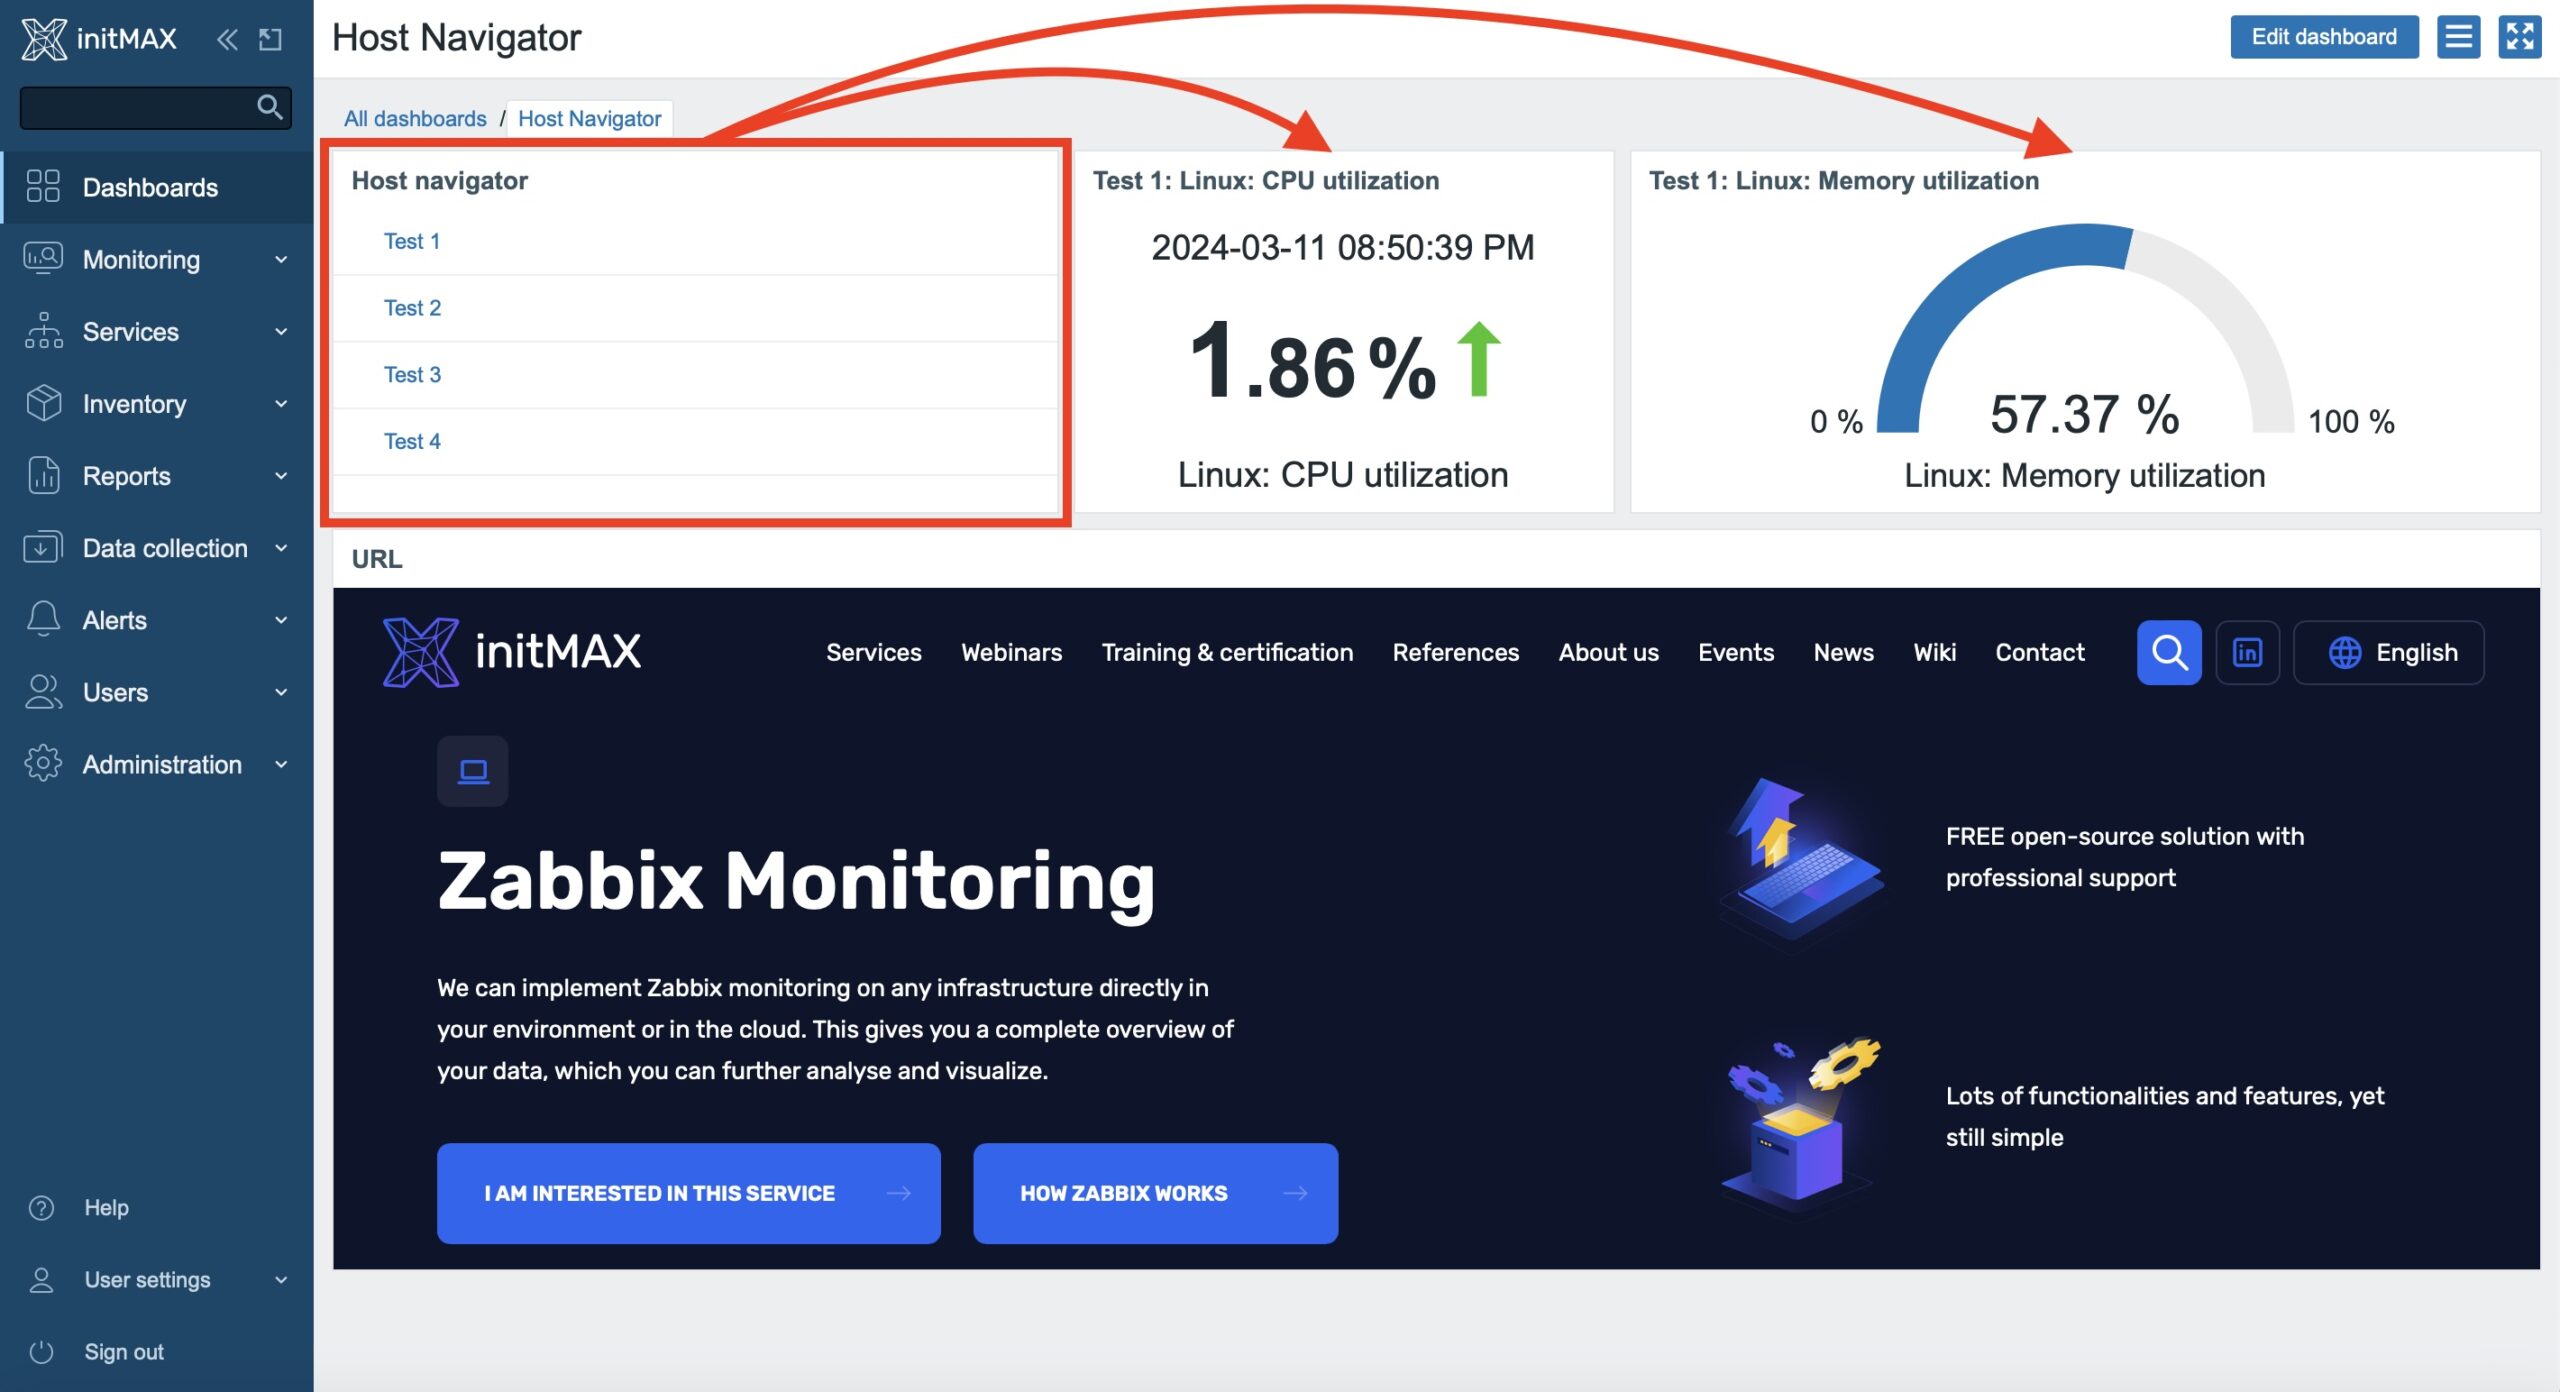
Host Navigator widget – The Host navigator widget allows users to smoothly switch between different hosts through an interactive interface. With the Override Host feature, it can influence the settings of adjacent widgets such as the Item Widget, Honeycomb Widget, and Gauge Widget based on the selected host. This provides users with the ability to quickly and efficiently adjust the display according to the context of the chosen host, enhancing interactivity and user experience.
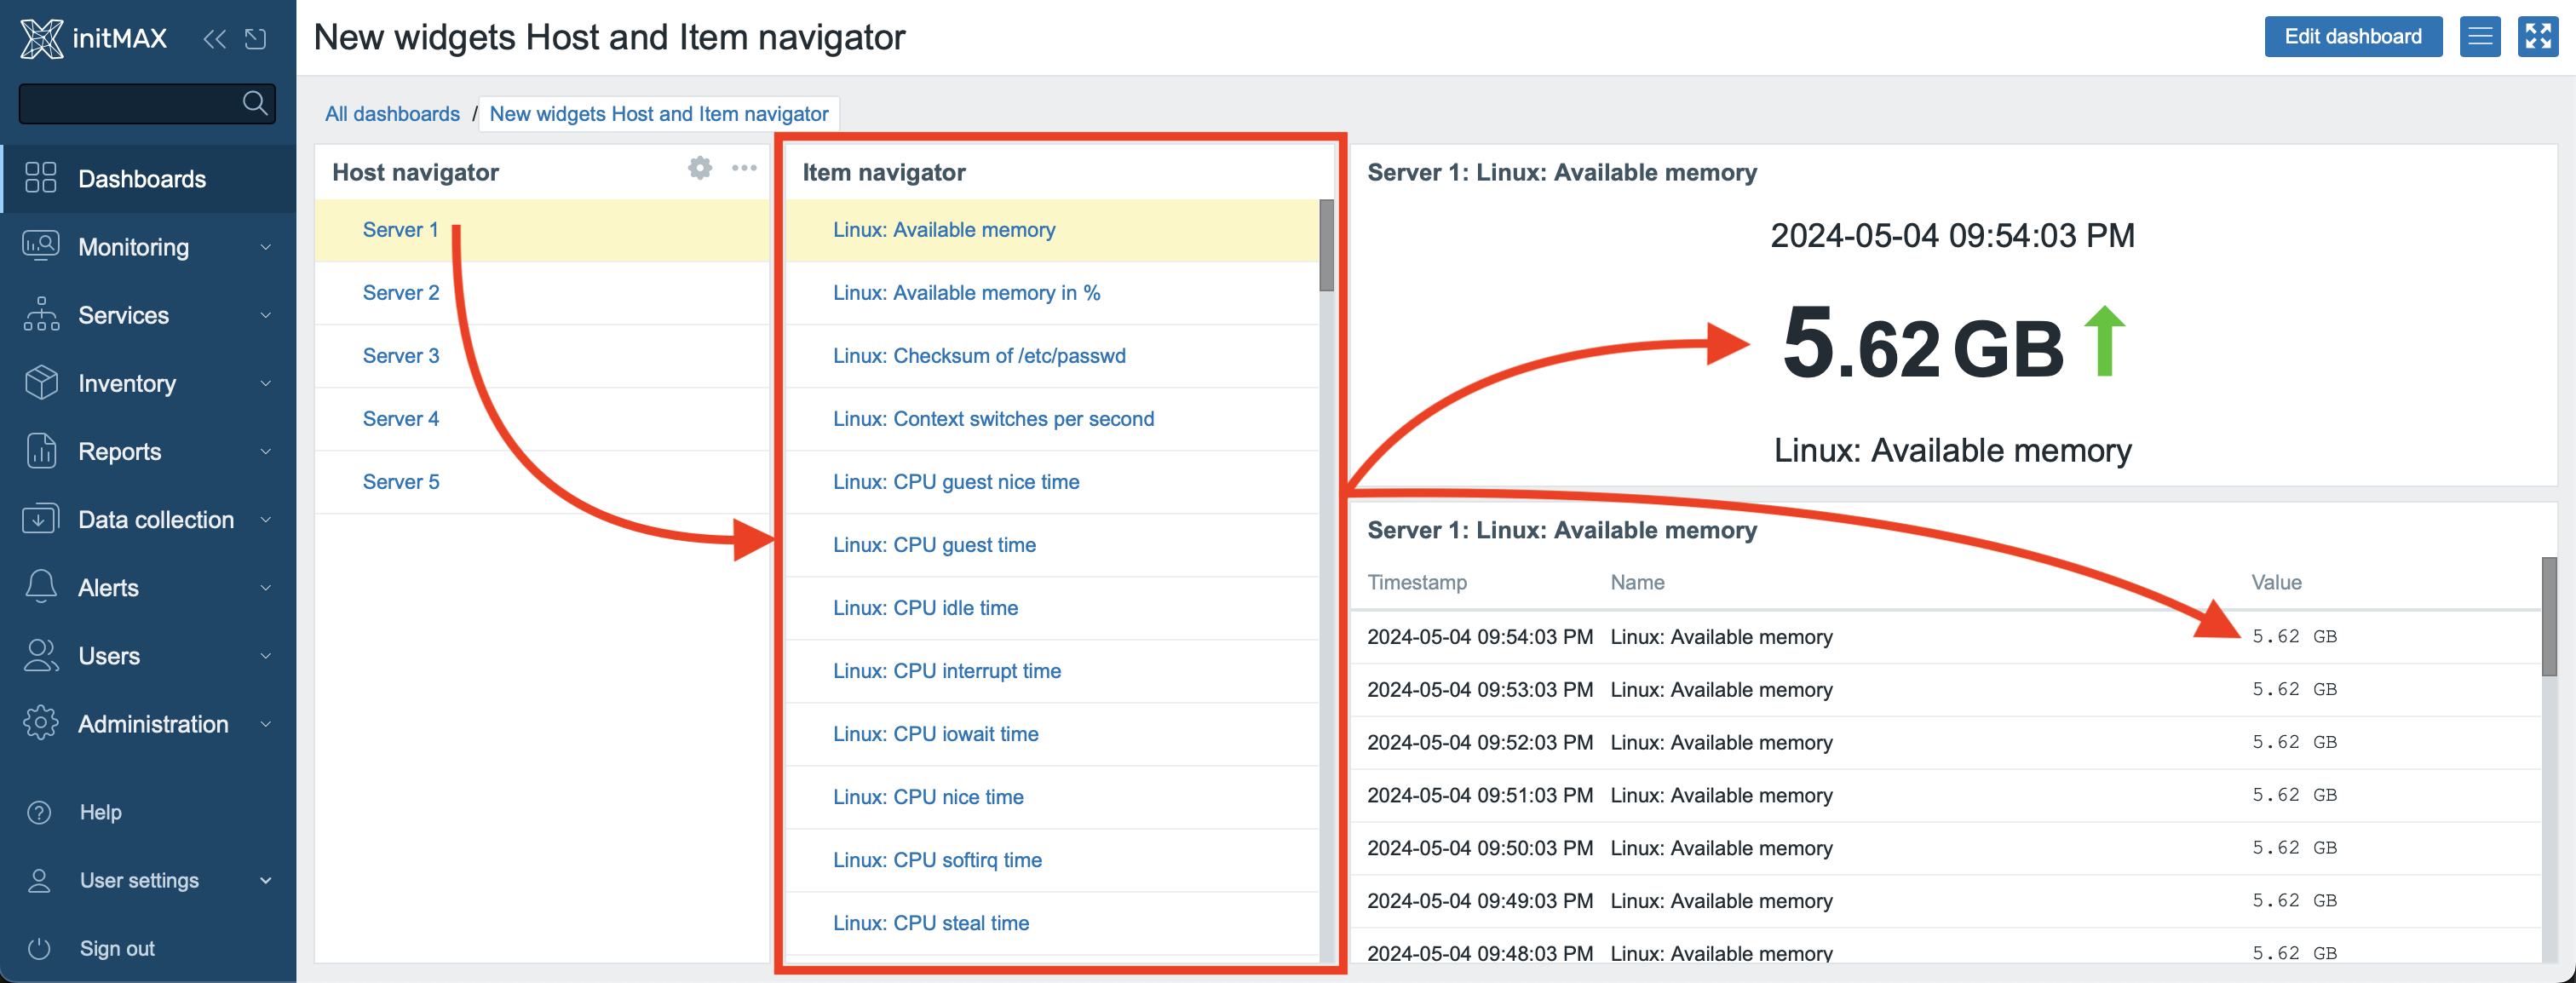
Item Navigator widget – The Item anvigator widget enables users to smoothly navigate between different items through an interactive interface. With the item selection feature on compatible widgets, such as the Item Widget and Plain Text, it has the ability to display values based on the selection made in the Item Navigator Widget. This provides users with the capability to quickly and efficiently tailor the display according to the context of the selected host.
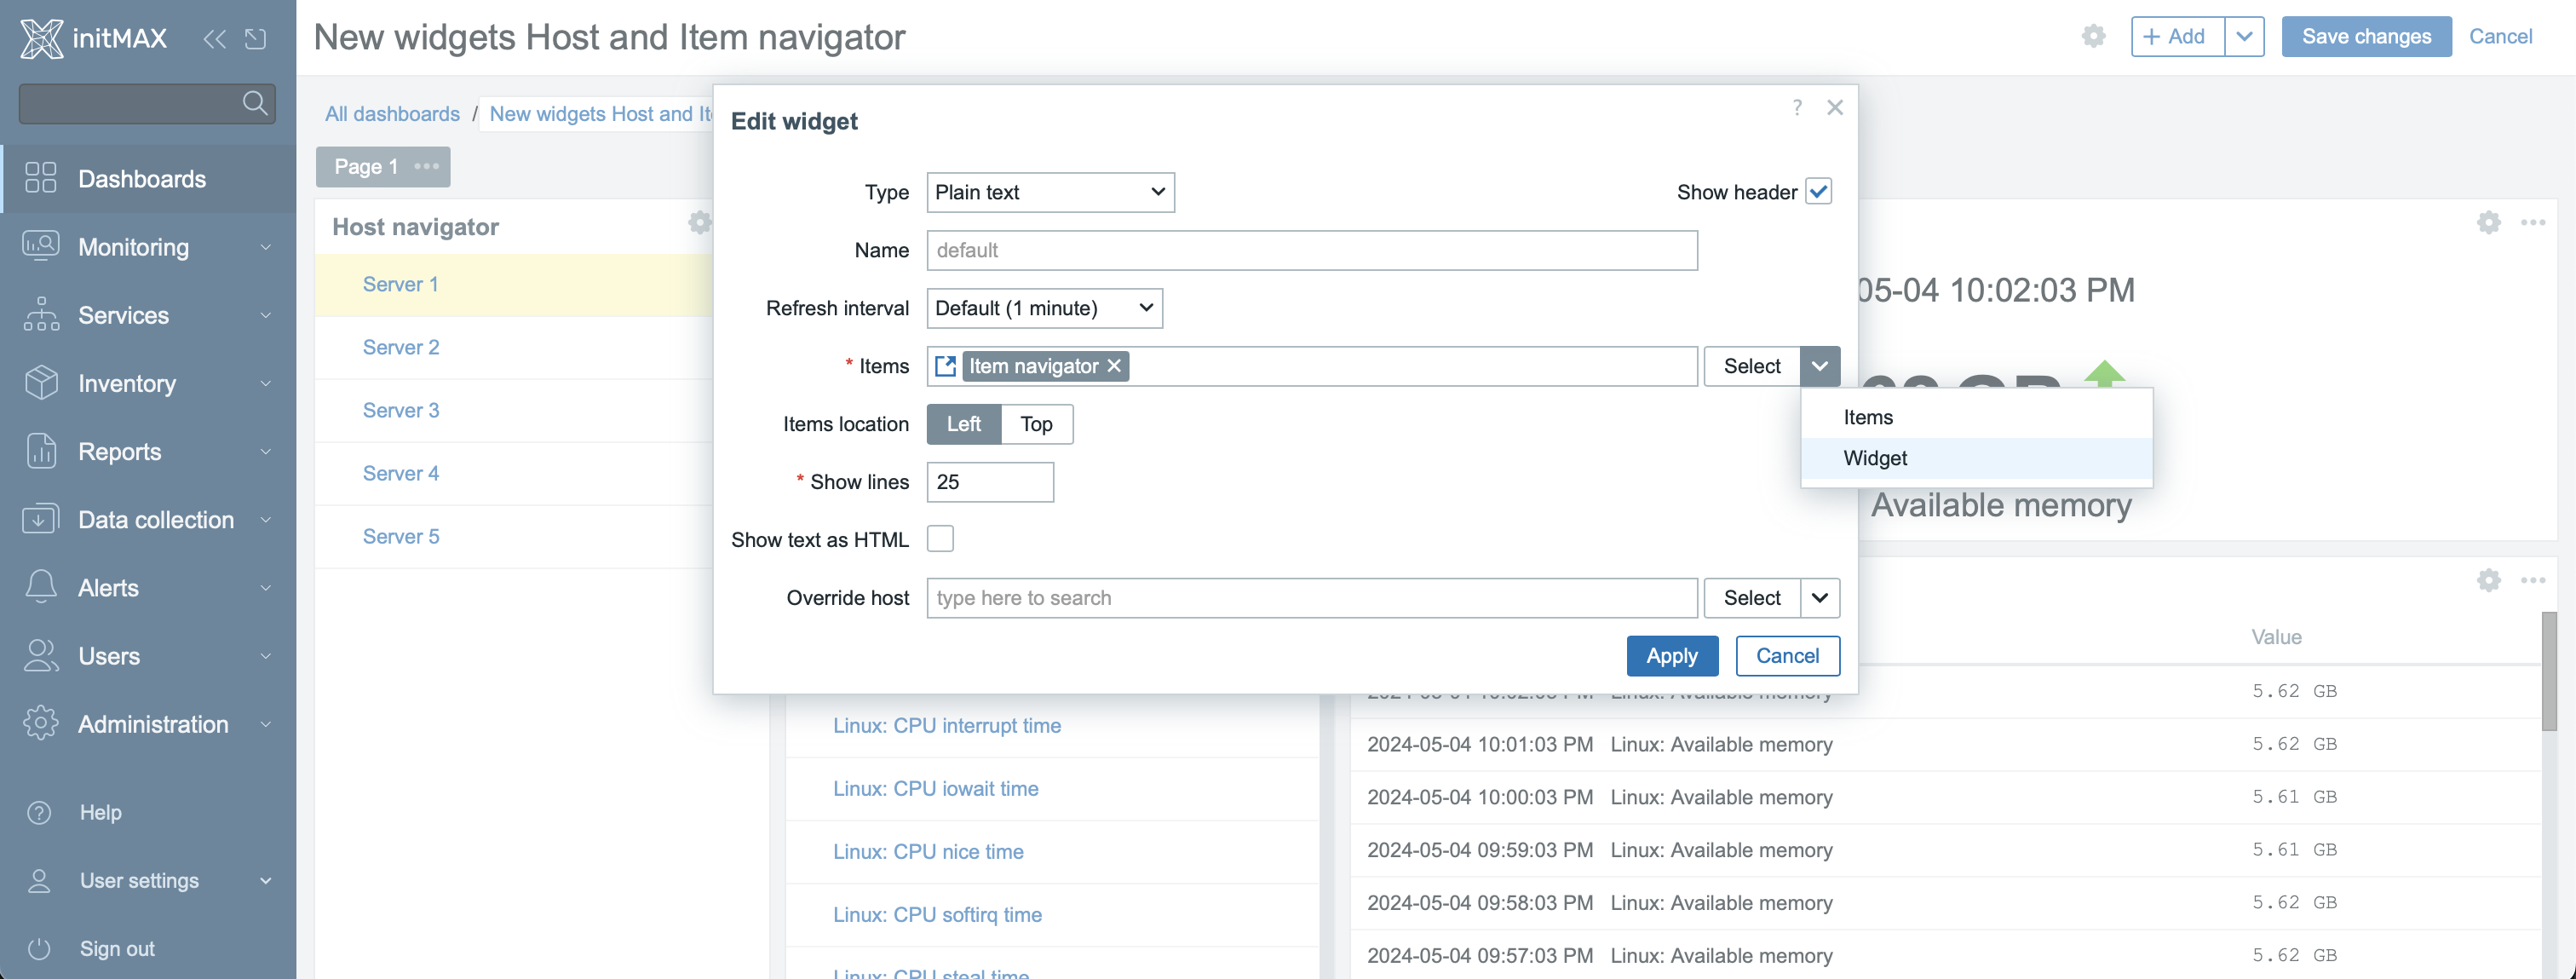
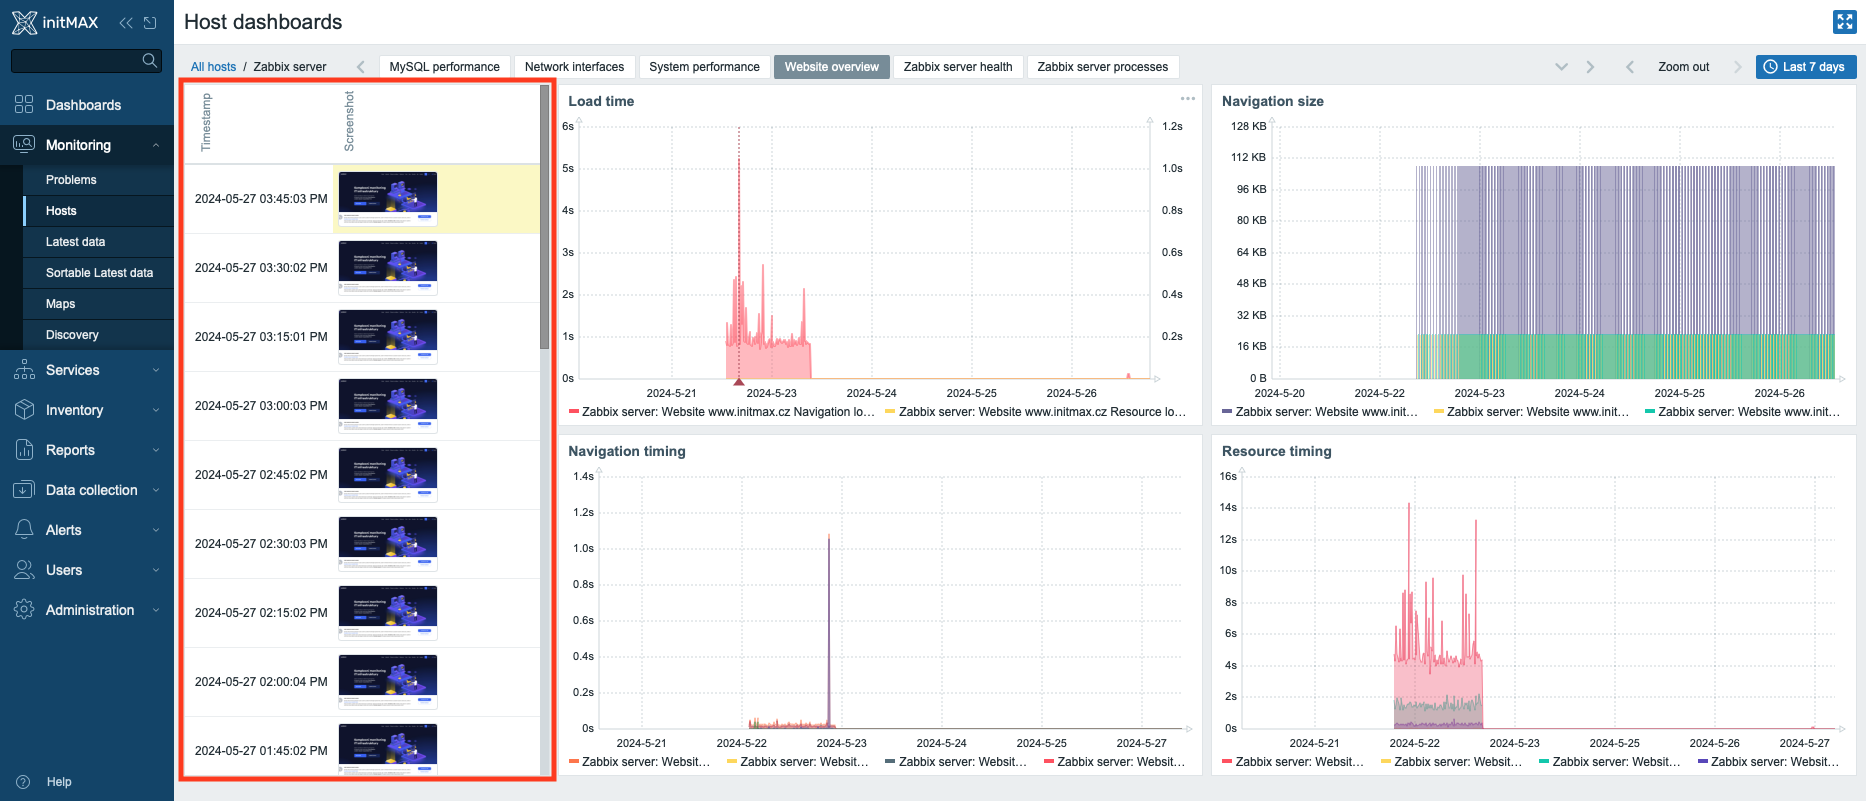
Item history widget – This new type of widget enables advanced display of historical data of individual items. It displays data in tabular mode, either in horizontal or vertical layout. Individual, selected items with their historical data form columns, while the maximum number of displayed lines is 100. The configuration allows you to influence how new values will be added to the widget, whether from top to bottom, or vice versa. Displaying the timestamp and defining a time range of historical data is also optional. The greatest asset of this widget is its ability to even display binary data, i.e. screenshots from the new type of item “Browser” (see our screenshot below). The widget is compatible with the Item Navigator and Host Navigator widgets.
Expanded widget availability in templates
Previously, only the following widgets could be created in templates: Clock, Chart (classic), Chart Prototype, Item Value, Plain Text, URL.
Templates now support creation of all widgets.
Zabbix Proxy in high-availability mode
A new and completely groundbreaking innovation that the new version of Zabbix brings is the possibility to use Zabbix Proxy in high availability mode.
The cluster runs in active-active mode and works not only for needs of failover/failback, but also handles loadbalancing of individual hosts.
For these purposes a new section was created in a menu: Administration -> Proxy groups.
Here, you can create group of Zabbix Proxy servers, which then will be working as a cluster – in high-availability mode.
In proxy group settings, you can define an appropriate cluster quorum (Minimum number of proxies) and a delay time for failover (Failover period).
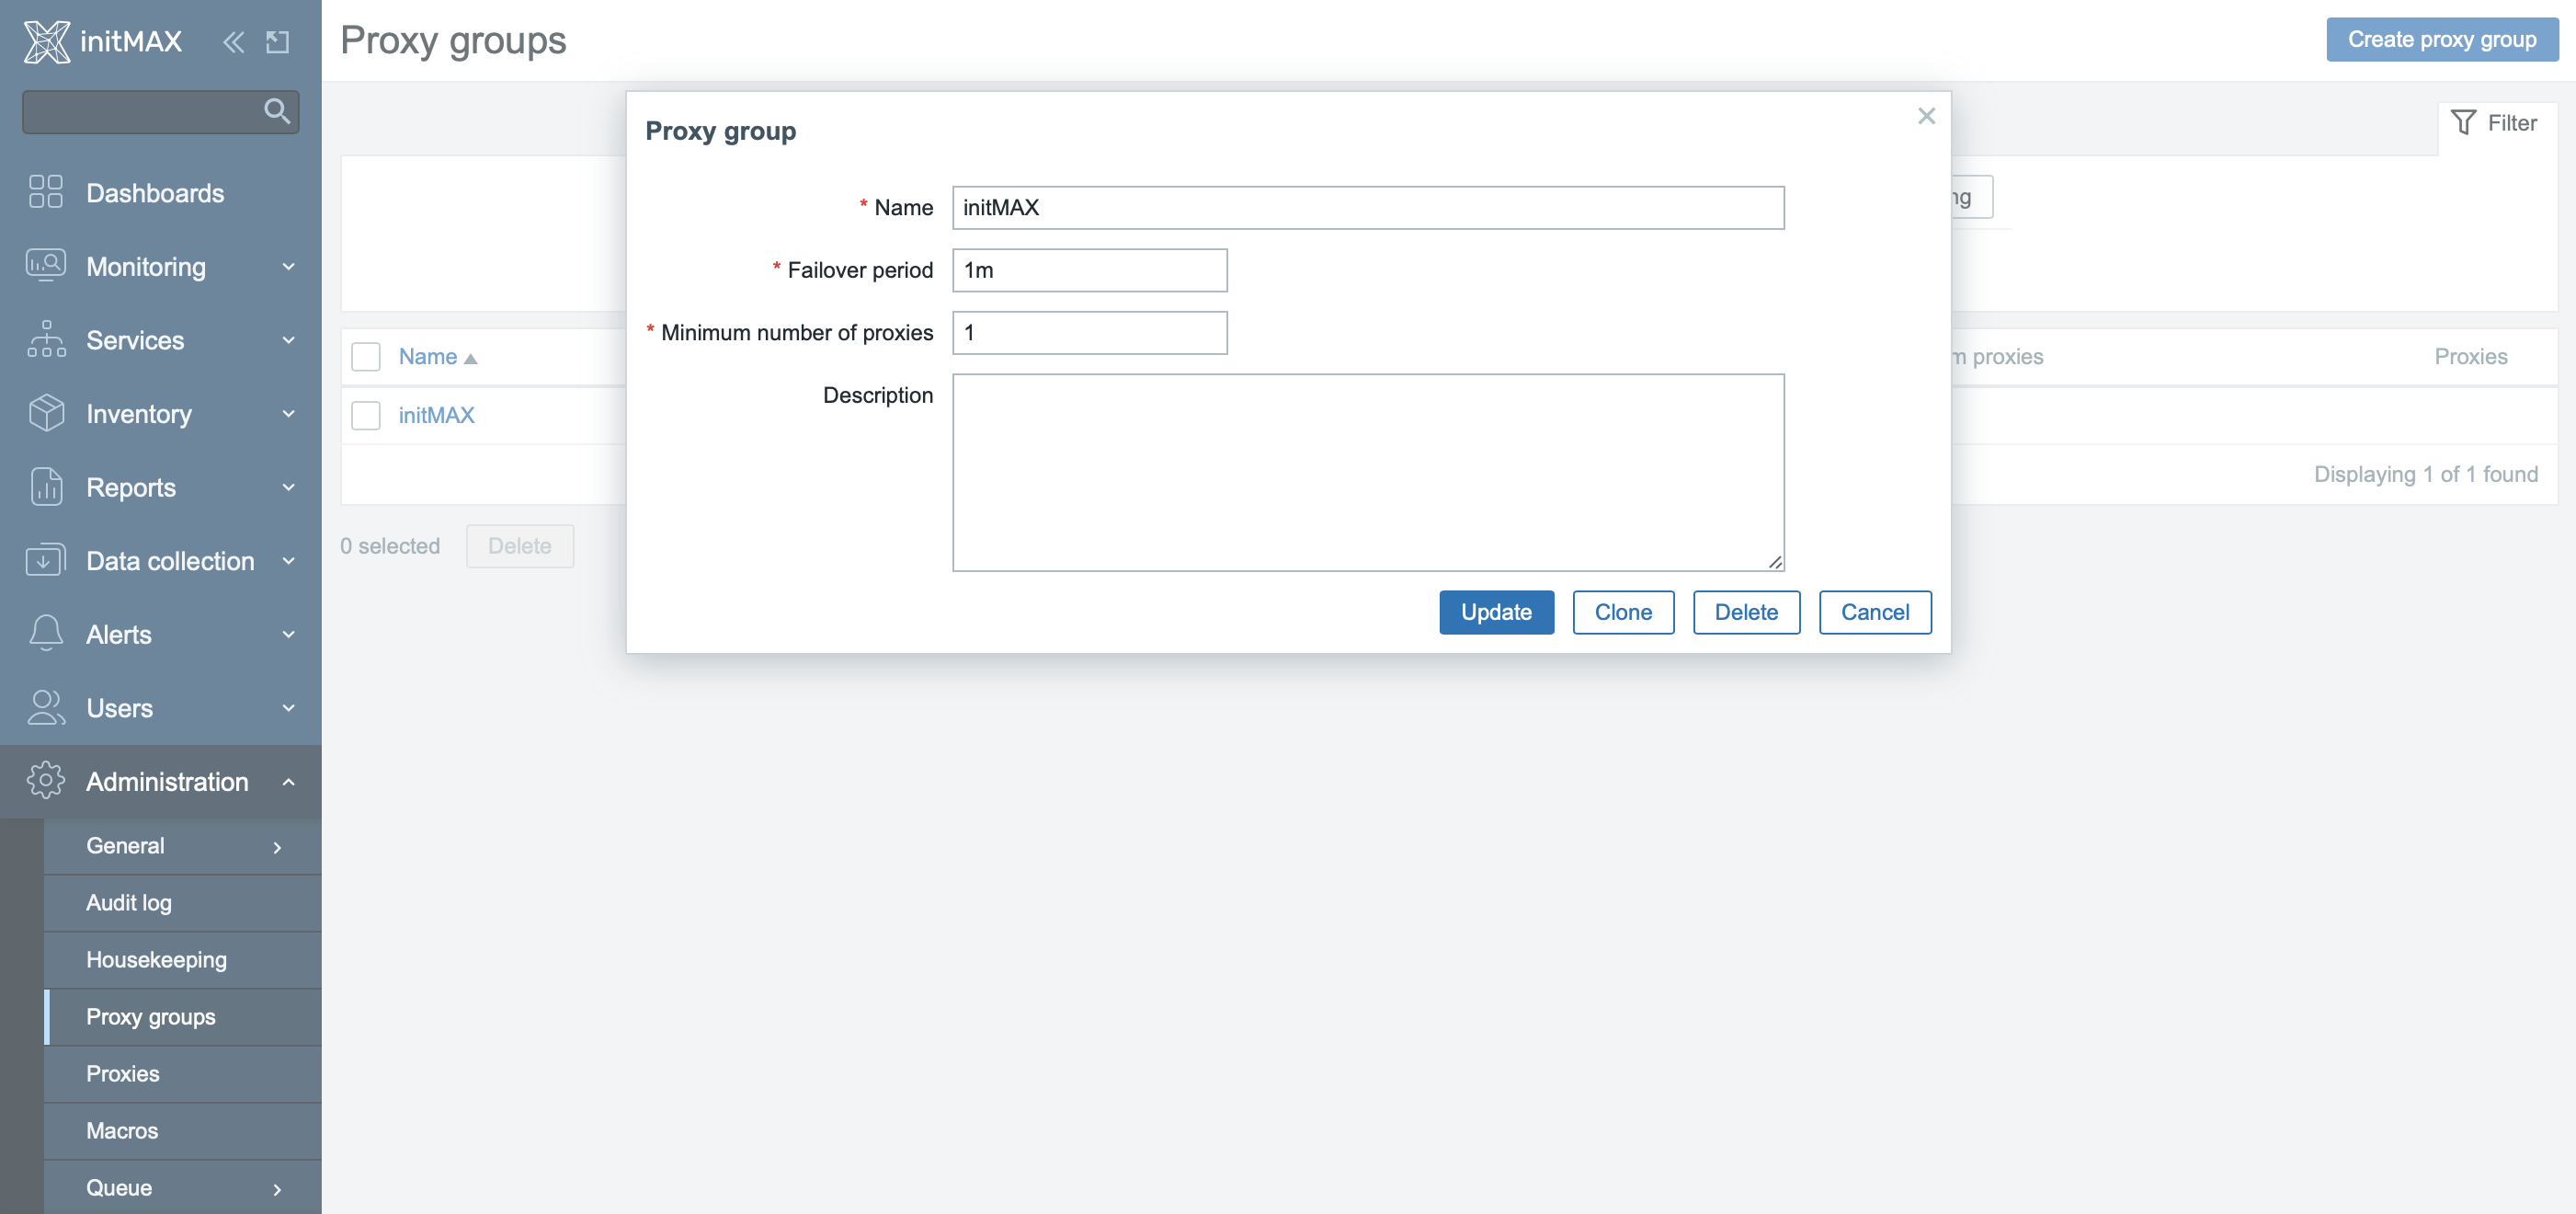
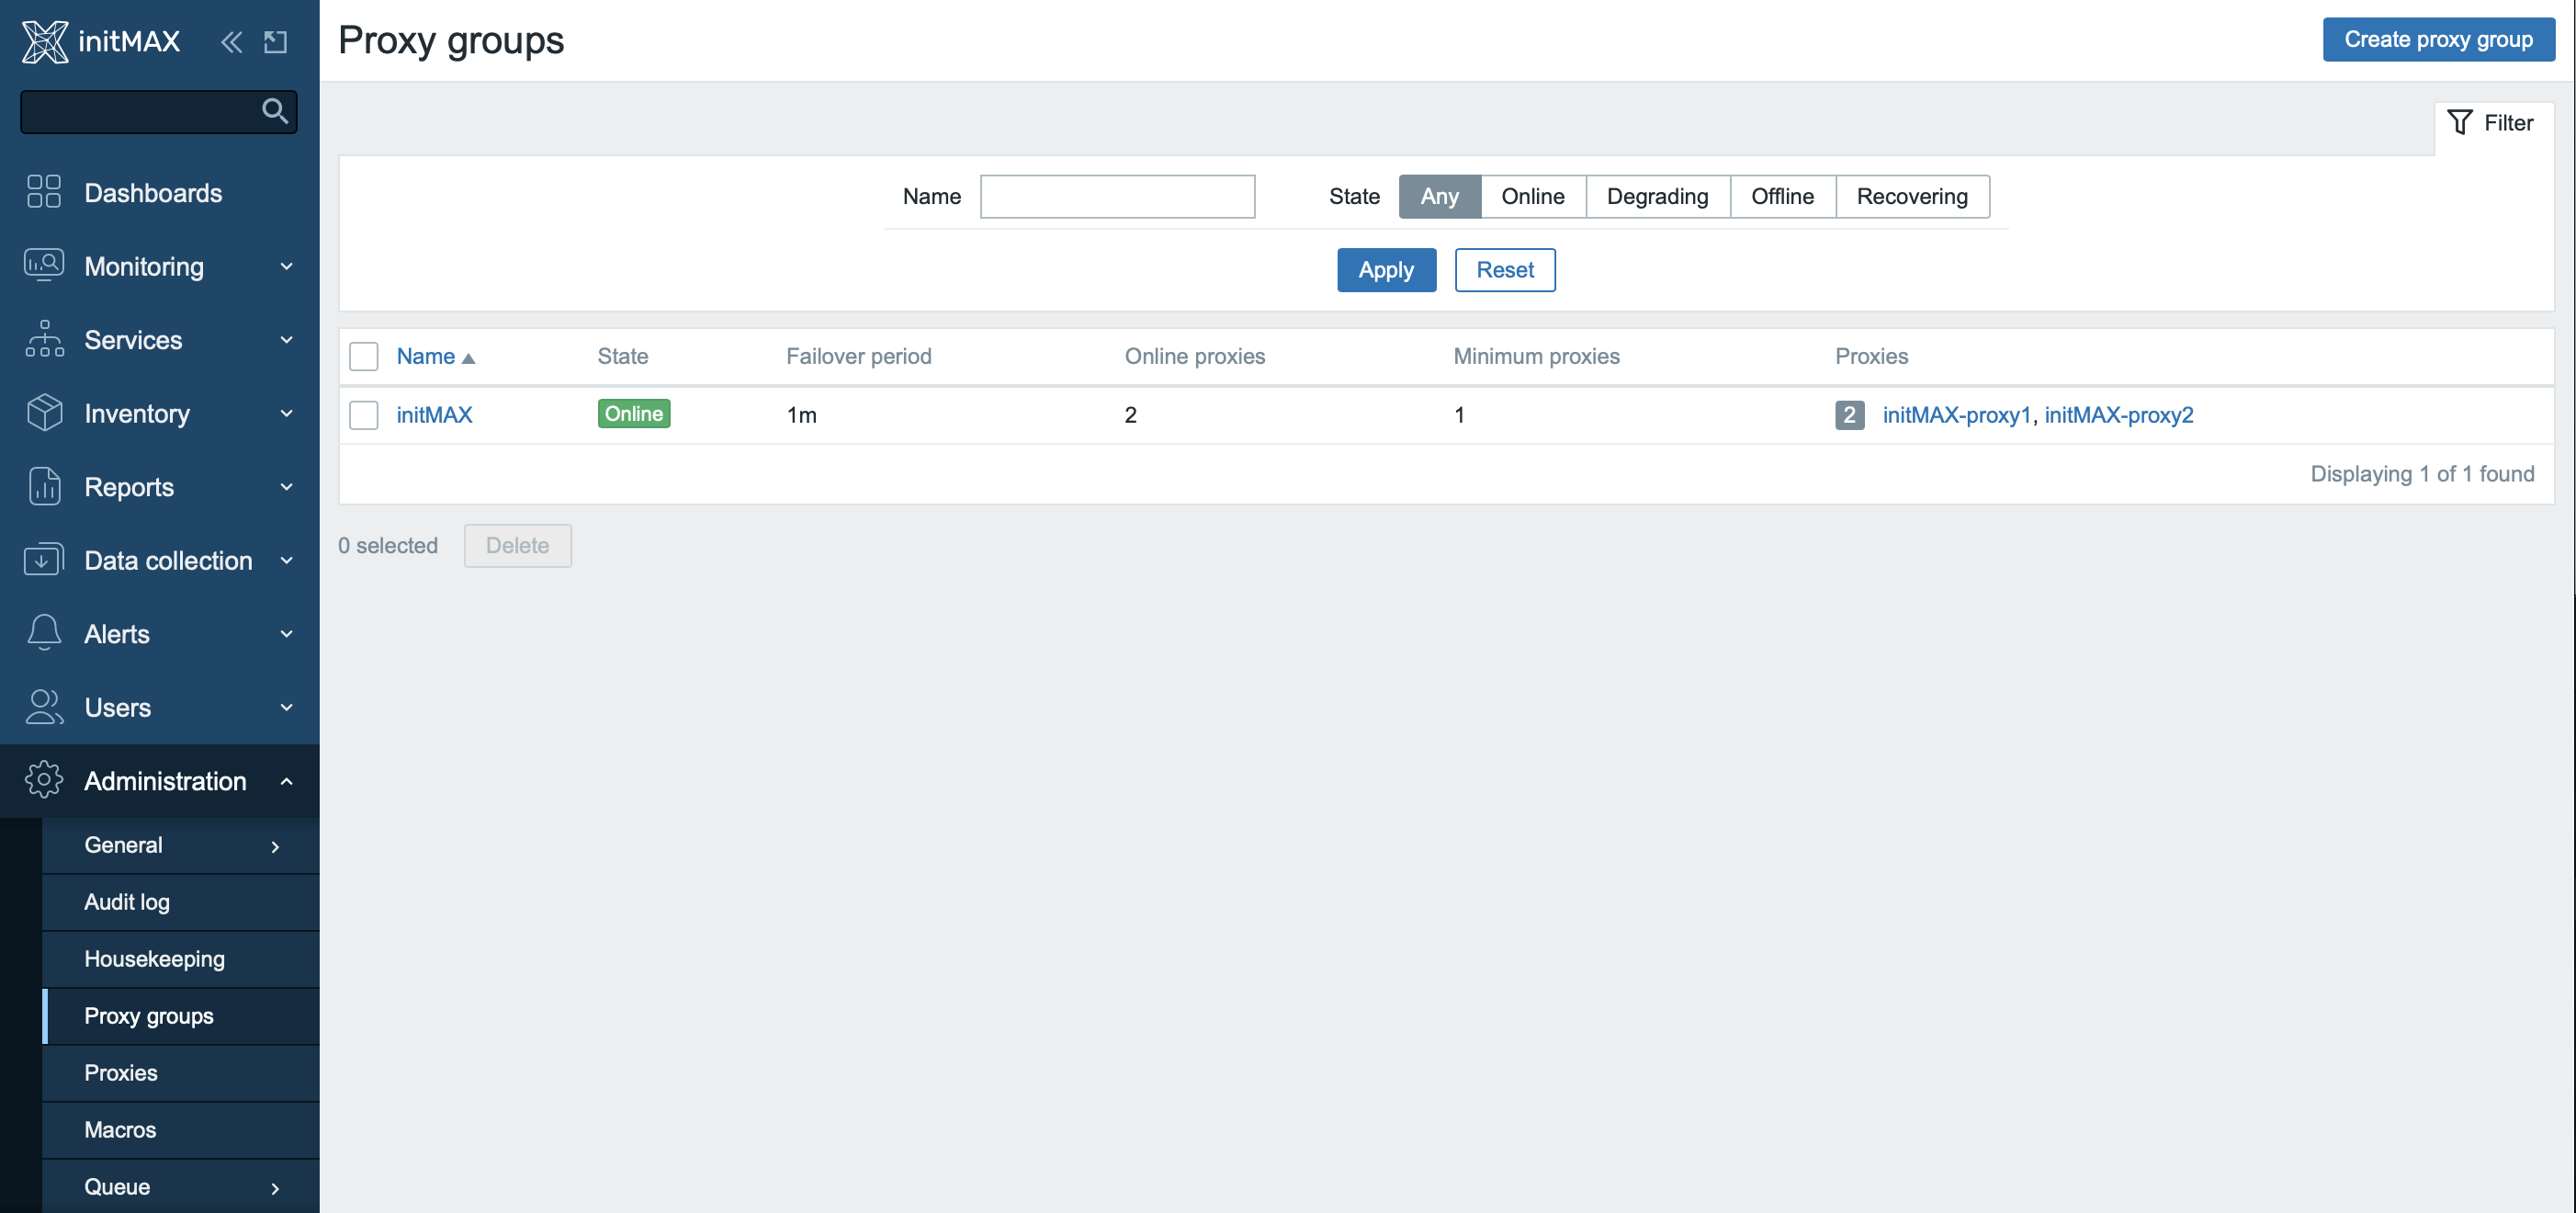
Here, you can see created cluster (Proxy group) with two assigned nodes.
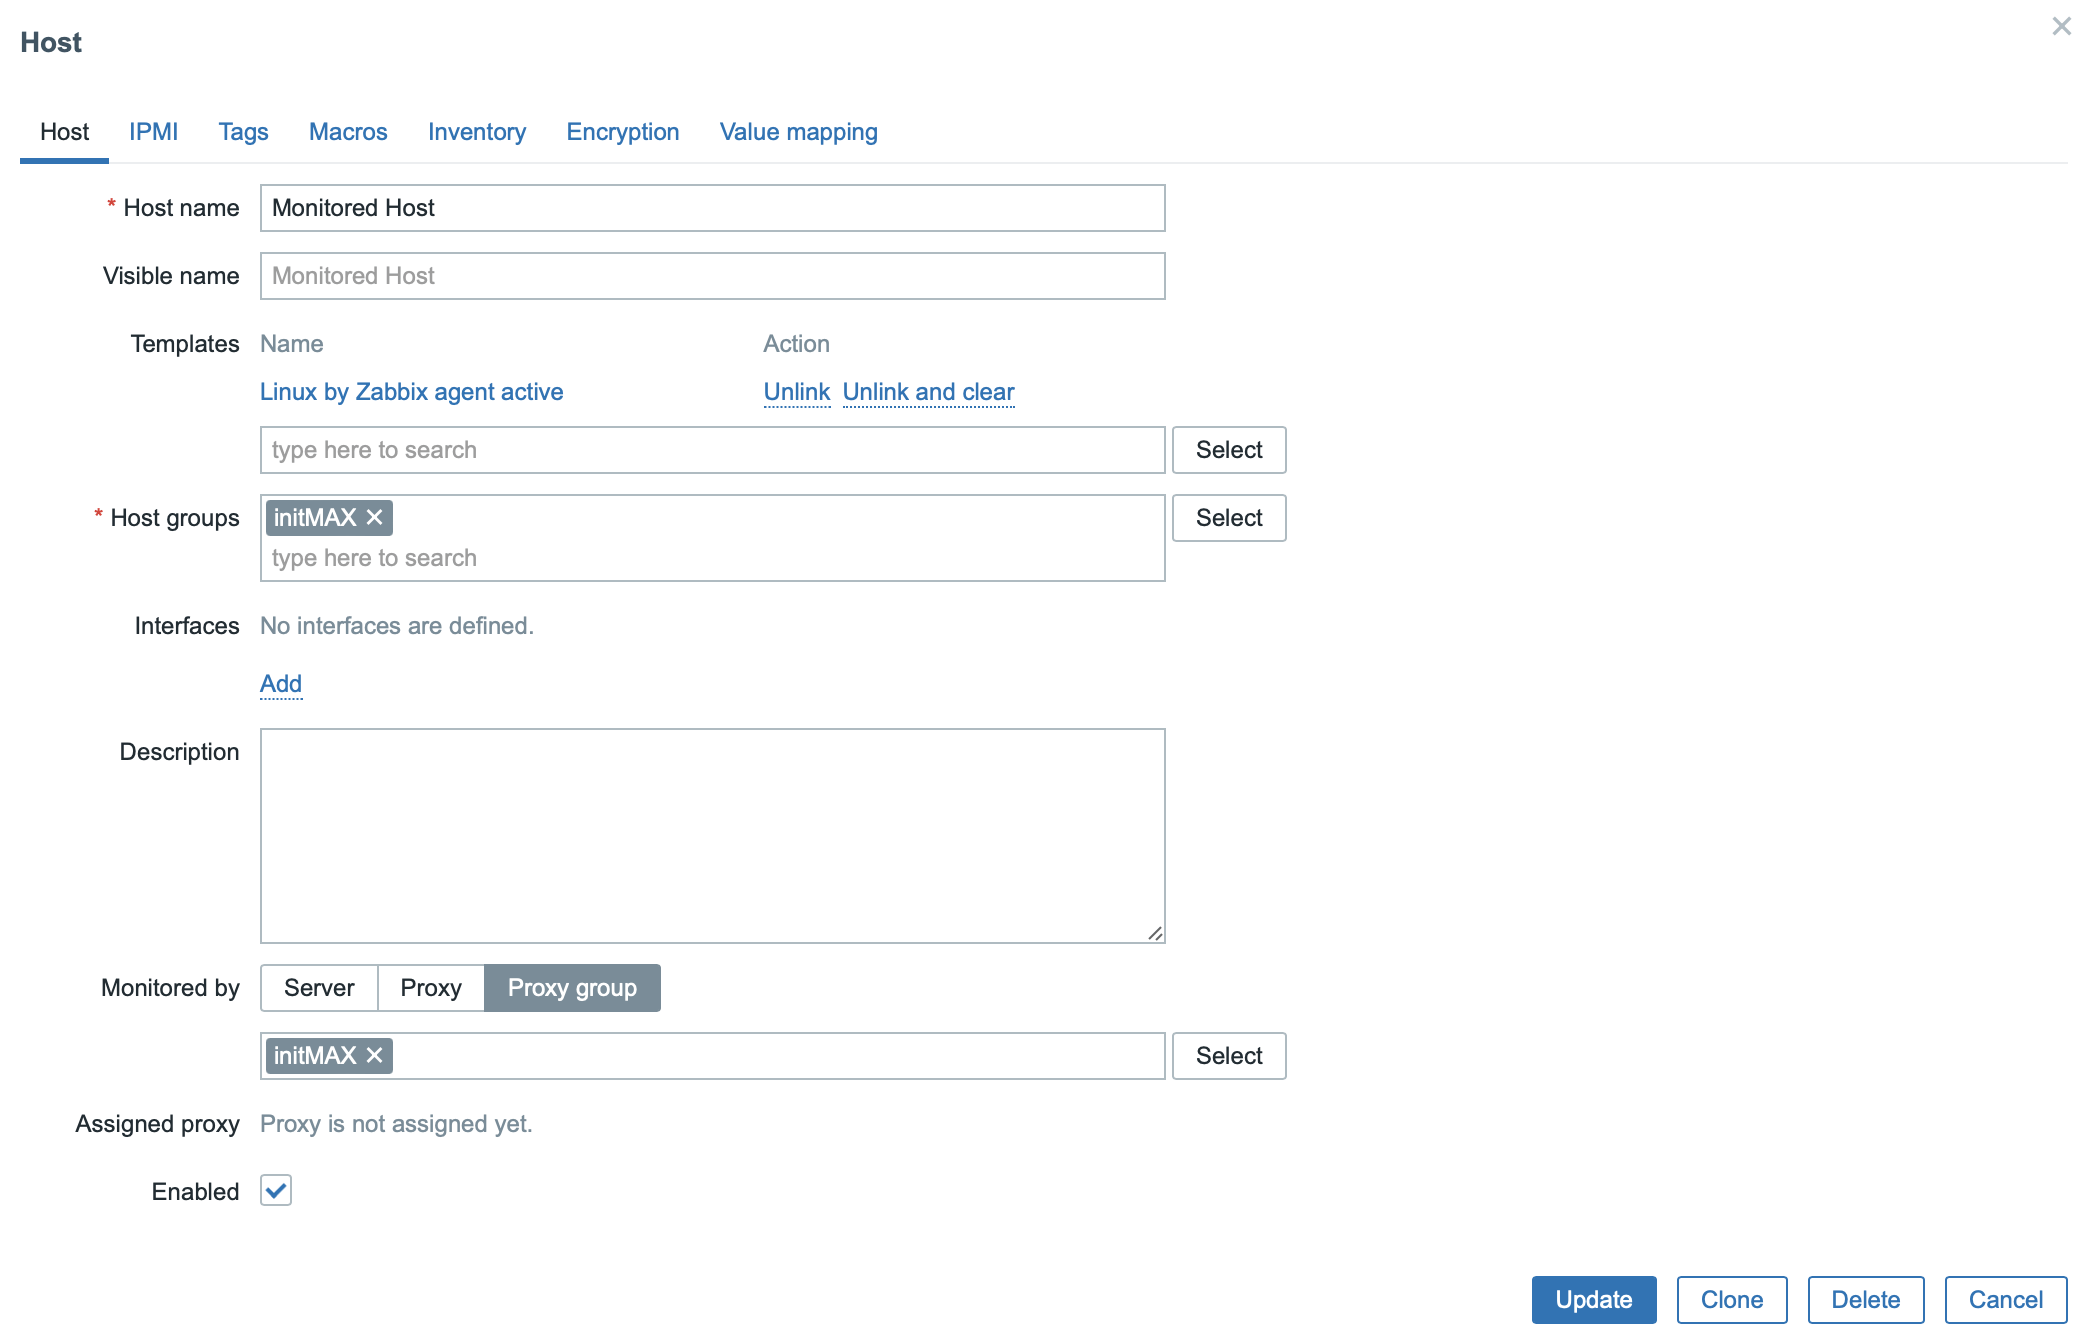
In connection with this feature, the configuration options for individual hosts was also changed.
These options now reflect the possibility of monitoring using a cluster of Zabbix Proxy servers. The Monitored by configuration item now contains Server, Proxy and Proxy group options.
This image shows the newly added Proxy group, but for now no assigned proxy server is displayed in the Assigned proxy section.
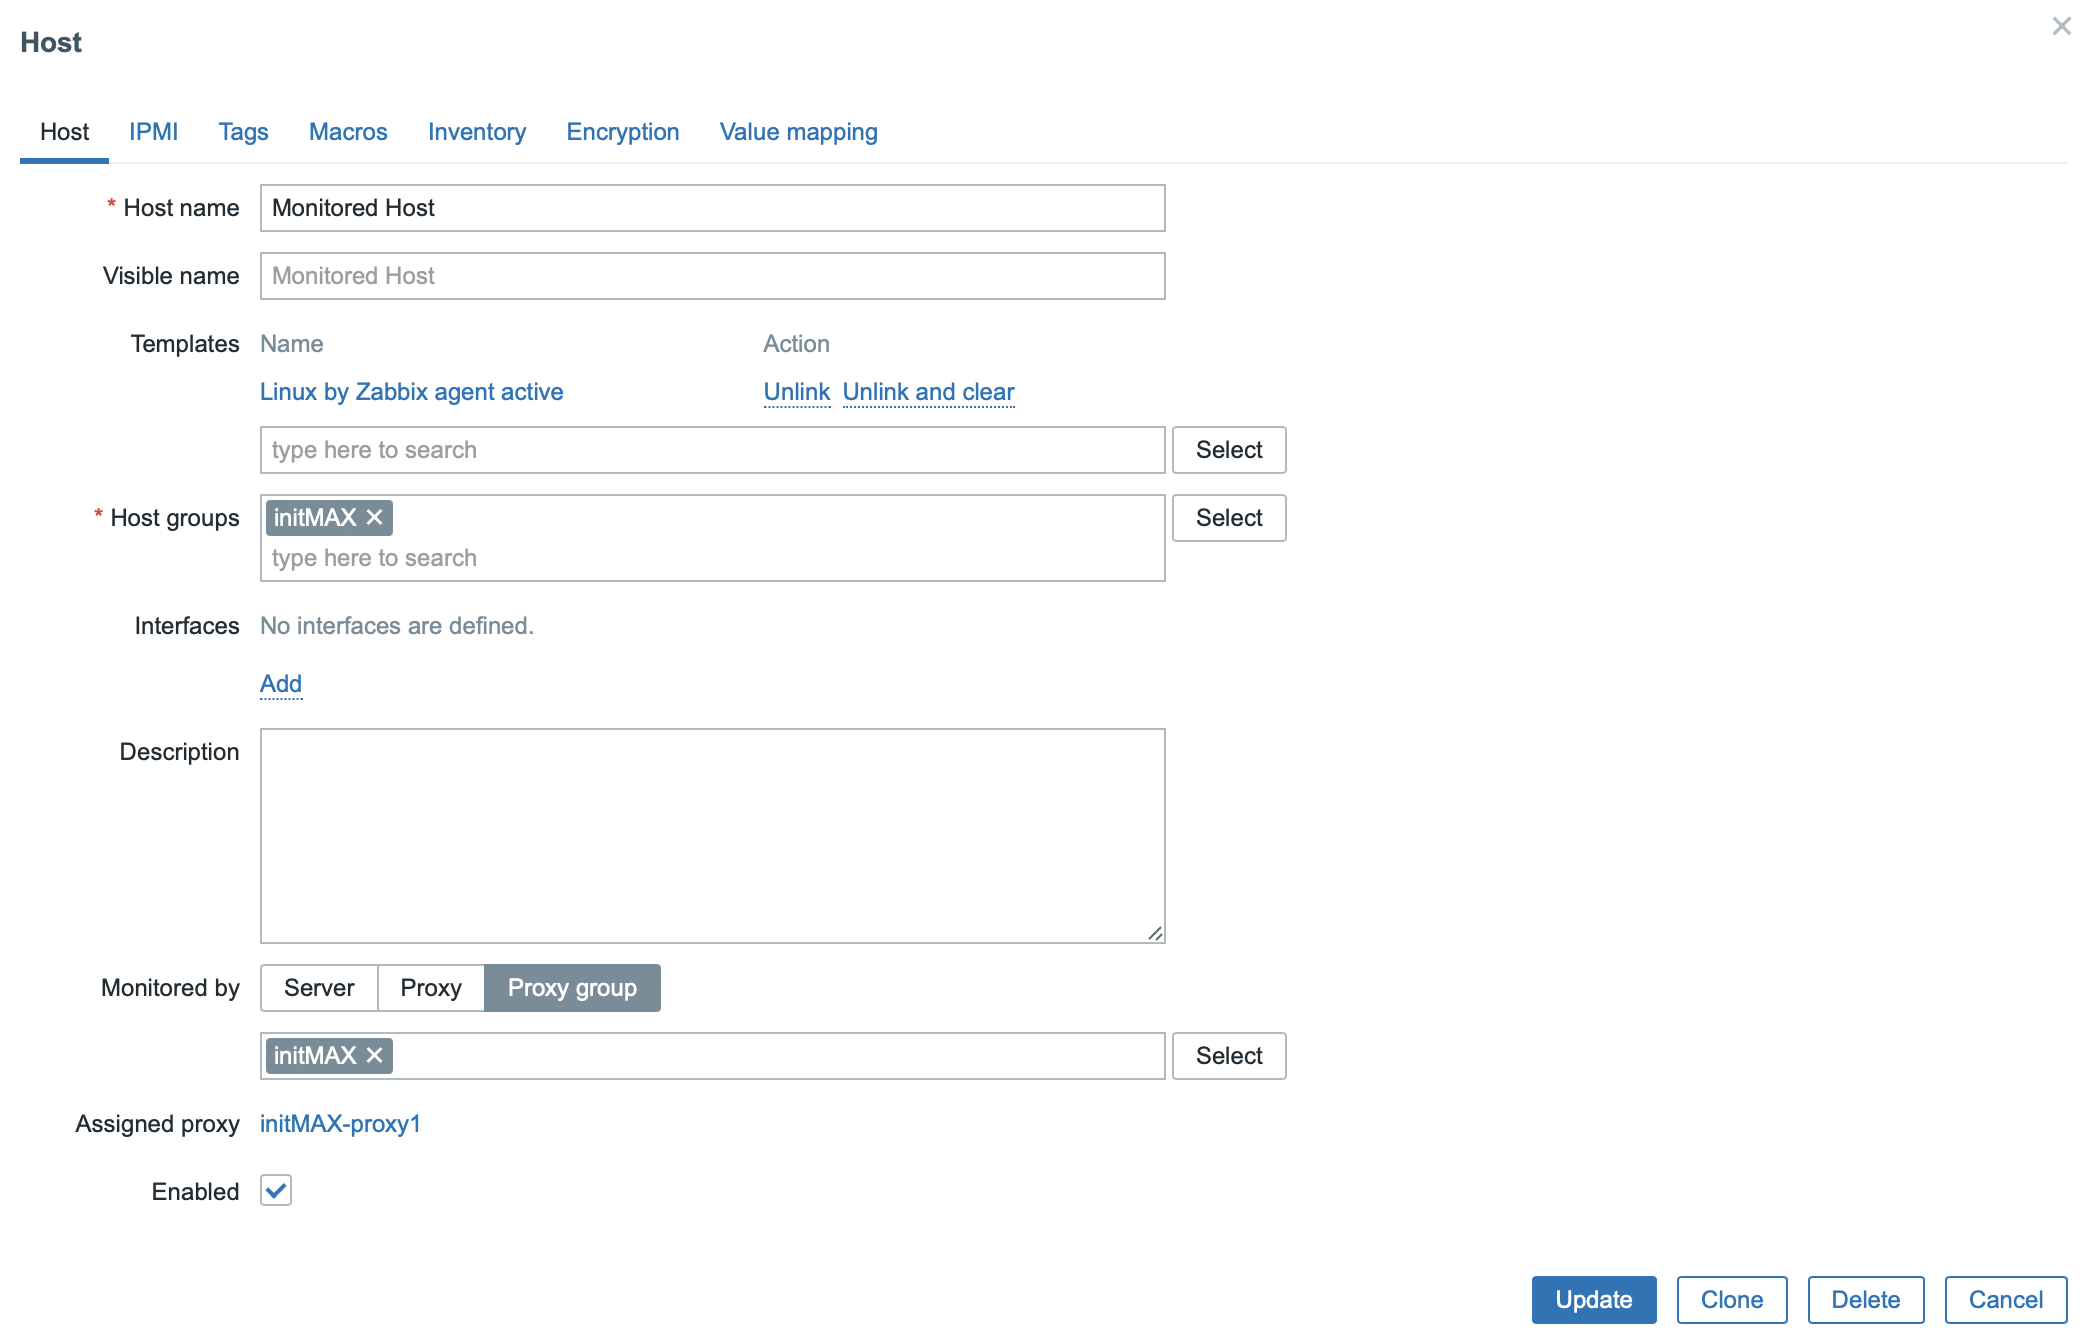
When the information about the new settings reaches the configuration cache of both Zabbix Proxy servers, which are now part of the cluster, Zabbix decides which specific member of the cluster will monitor this host and assigns the given proxy to it.
In the image below you can see the specific assigned proxy server from the cluster.
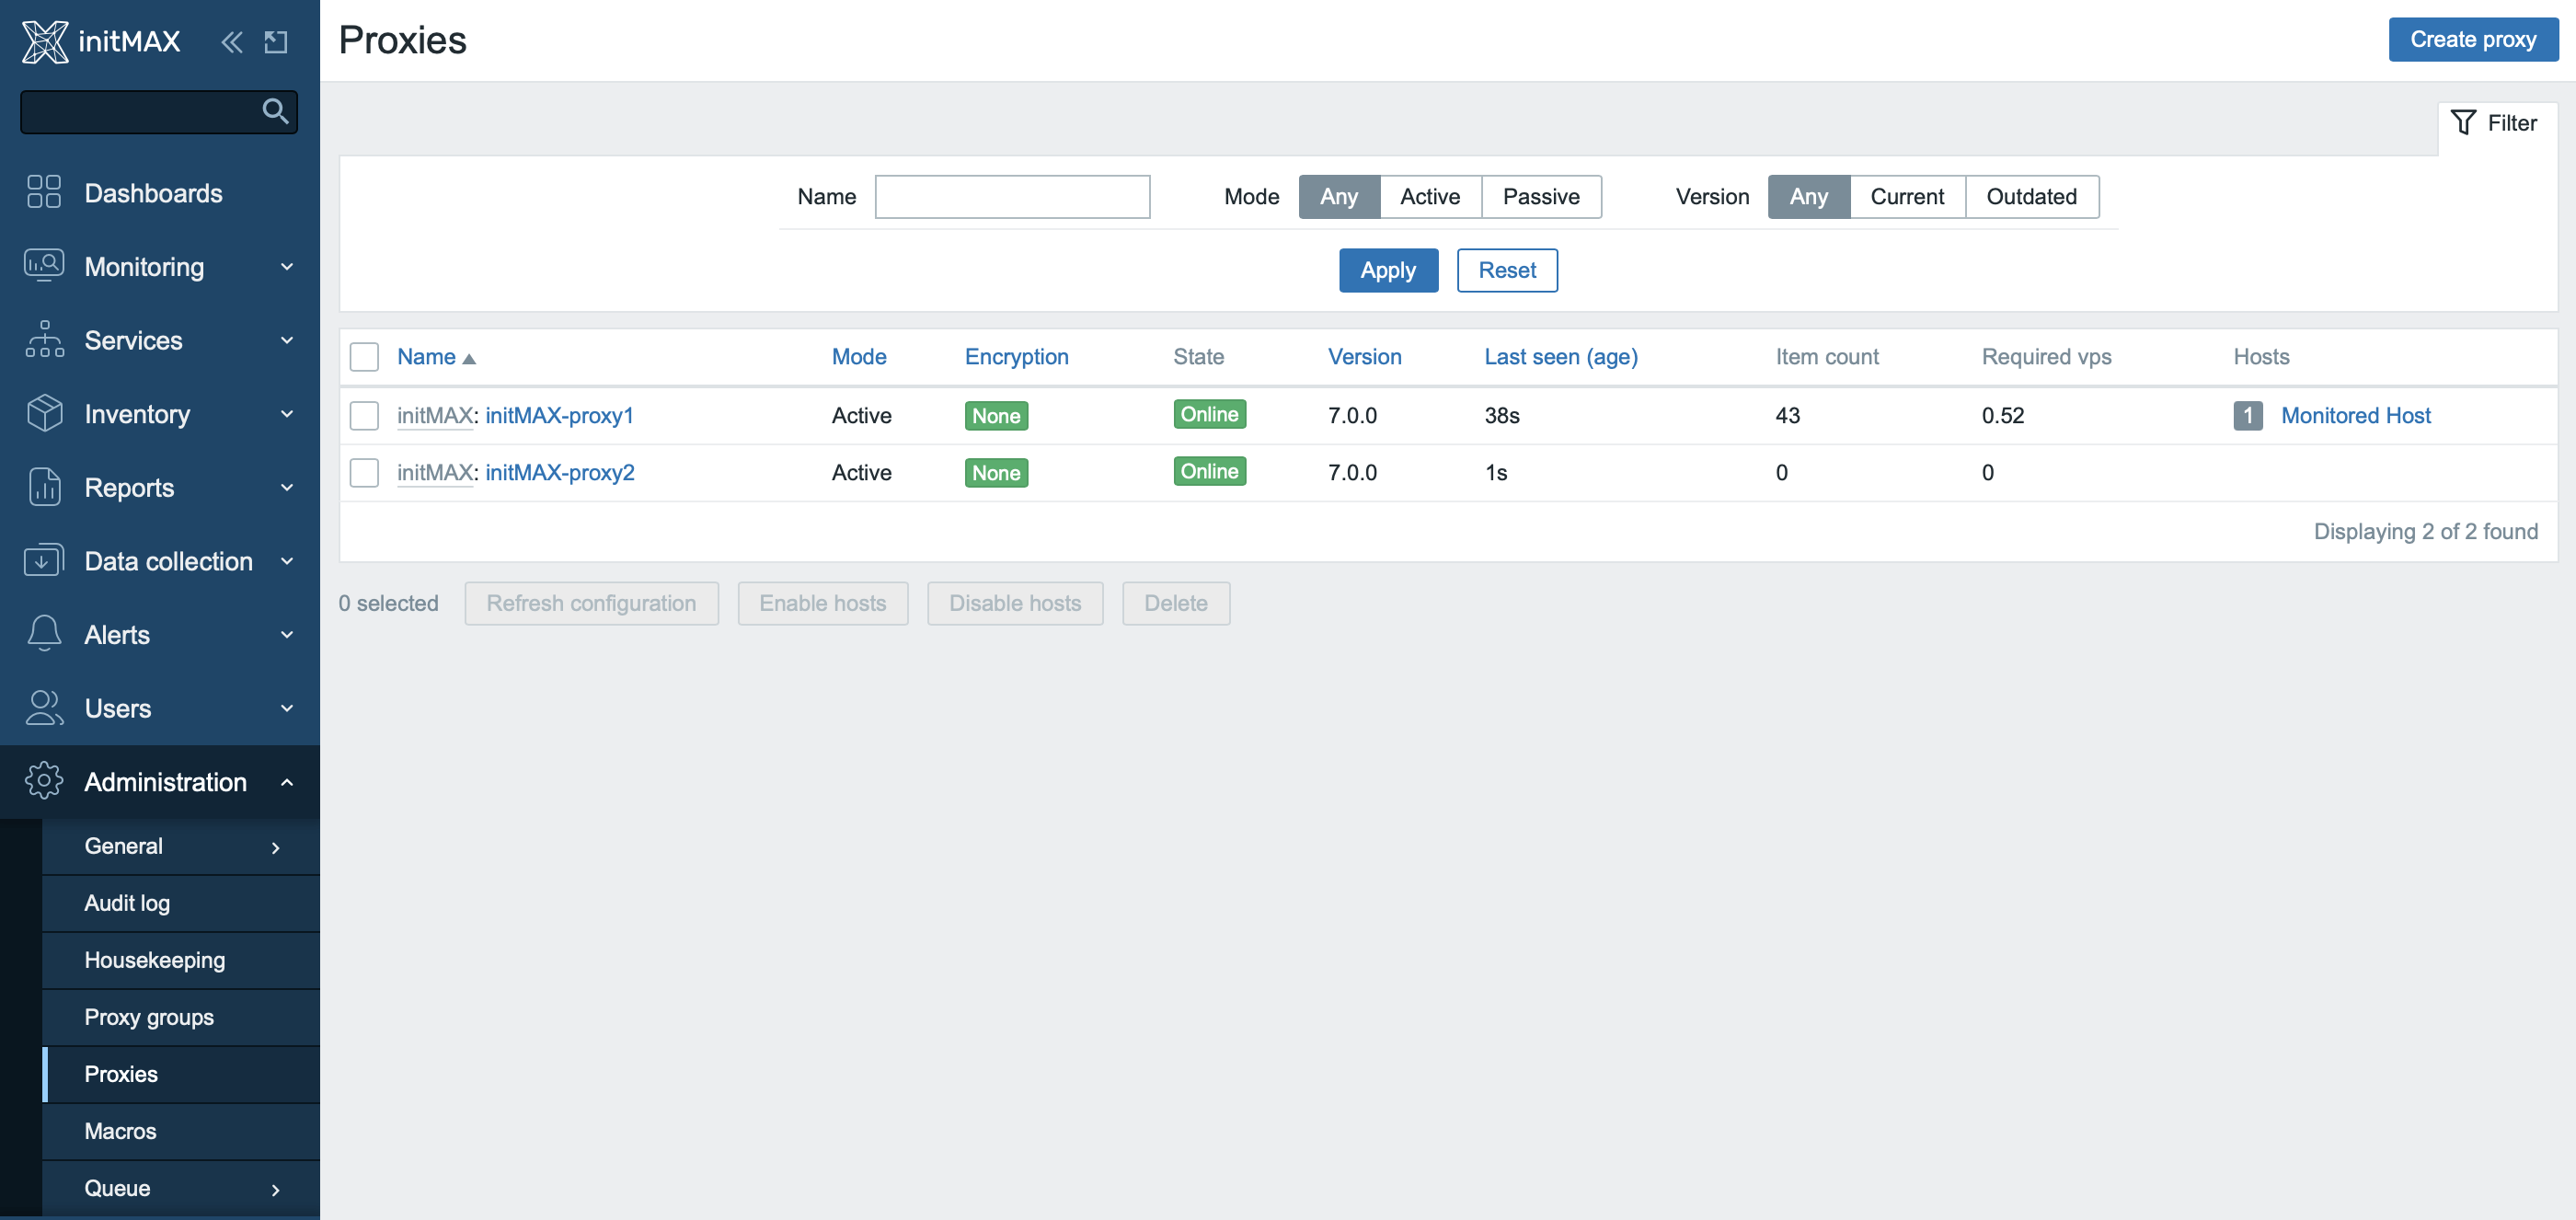
In the Administration -> Proxies section, the Proxy groups to which the given Zabbix Proxy servers belong are now visible.

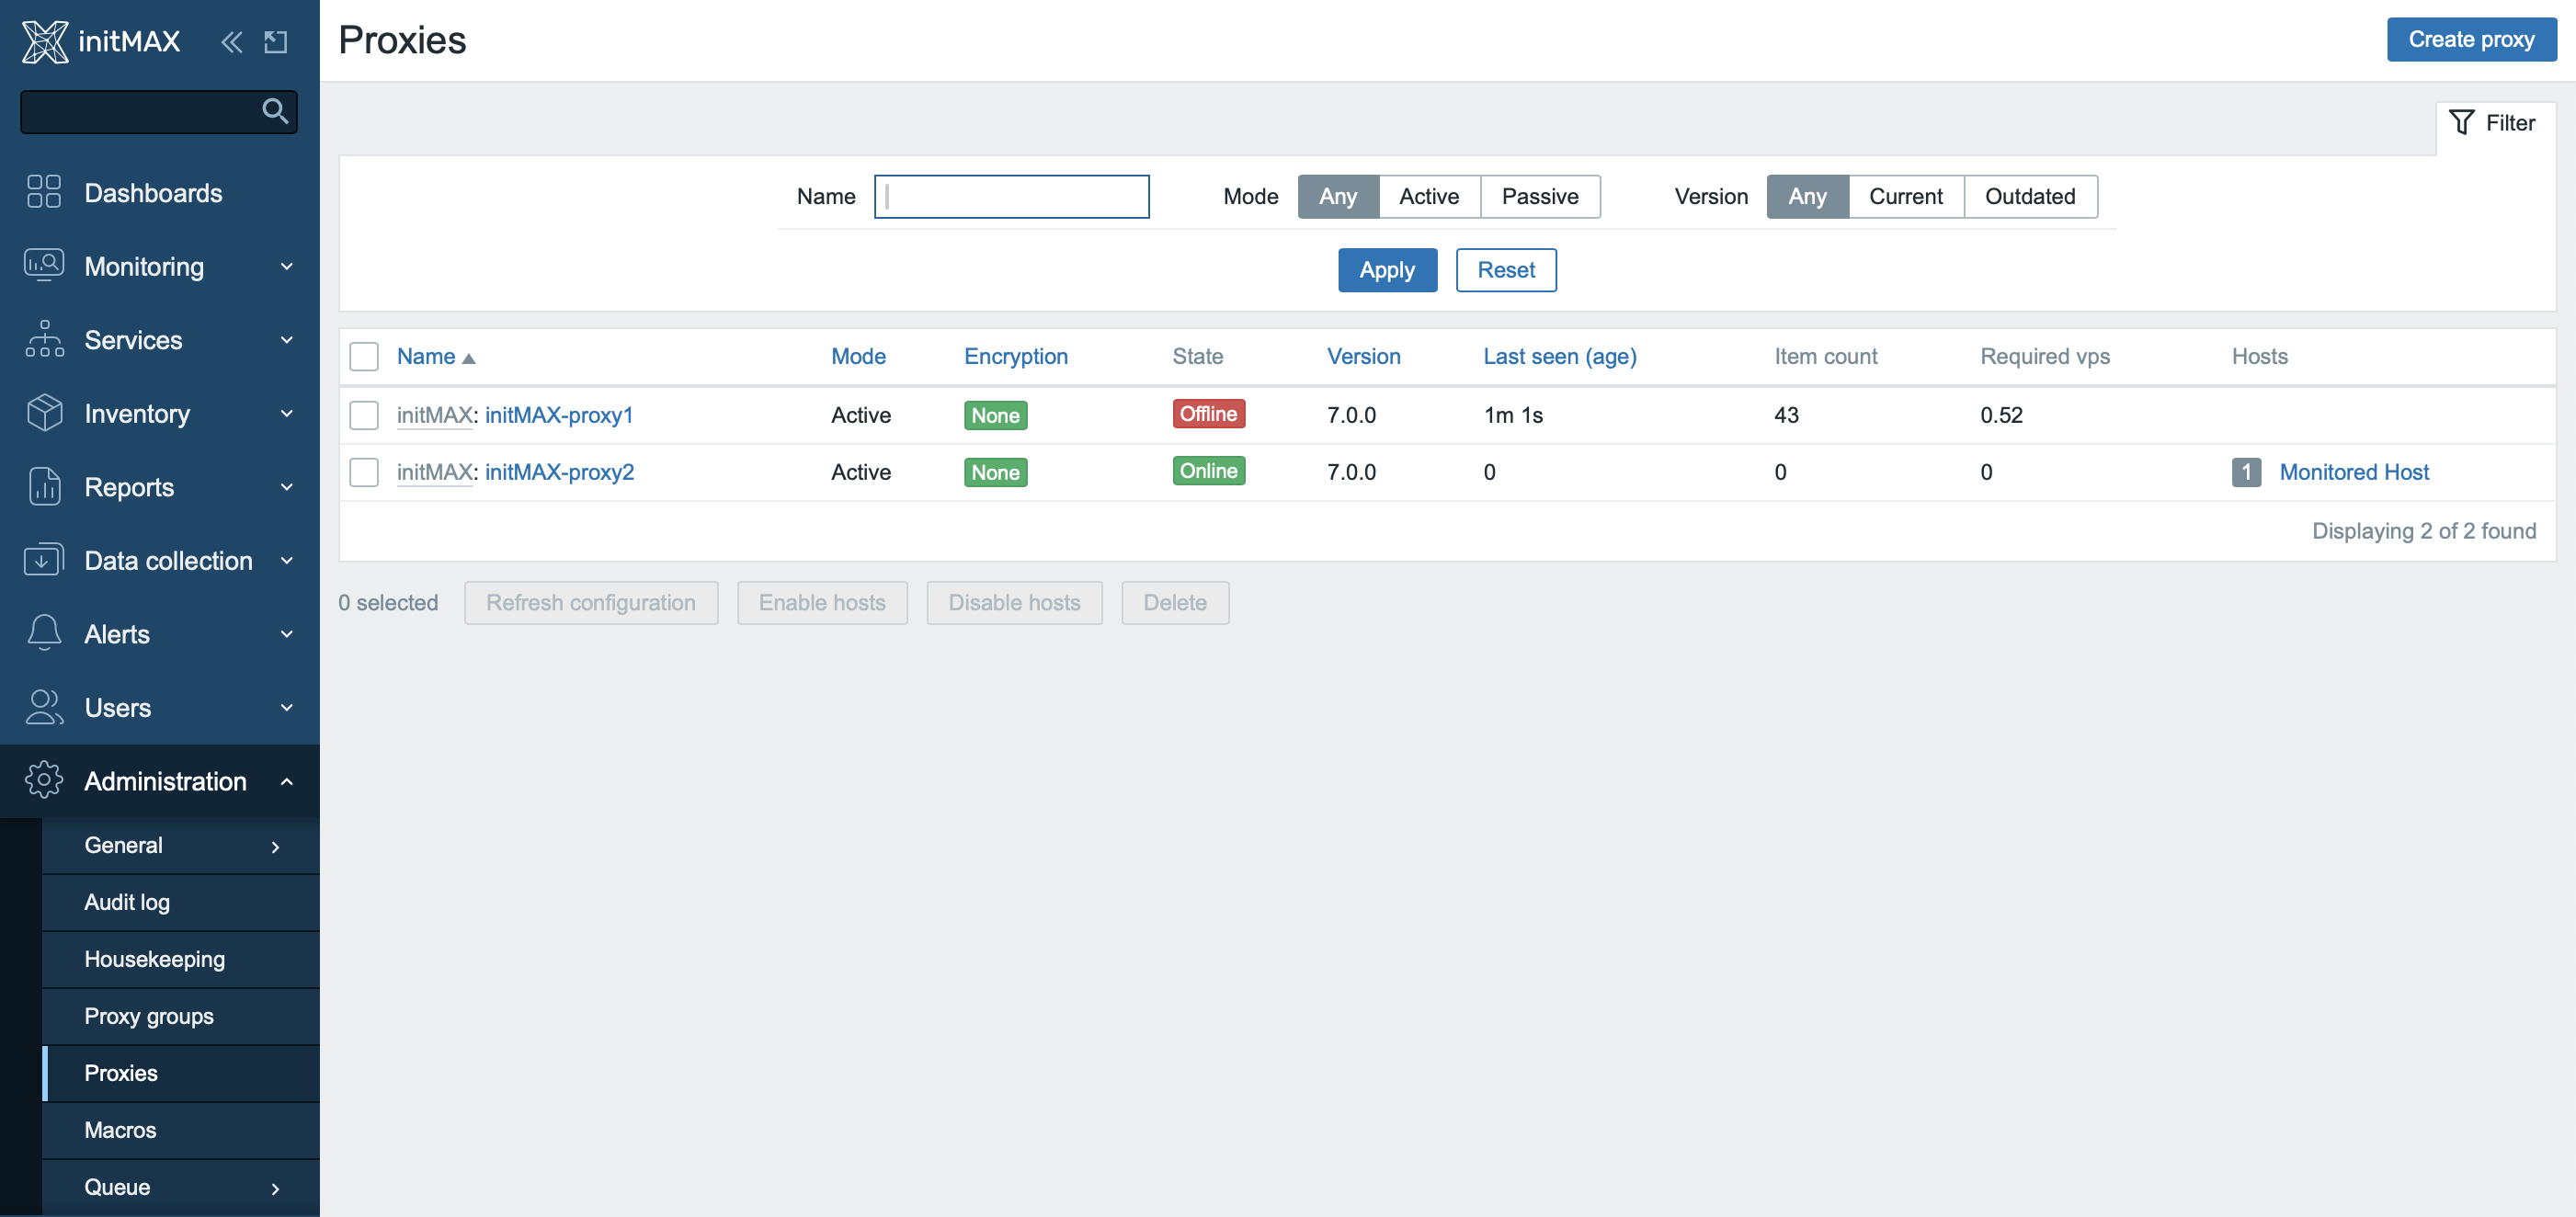
In the event of a failure of one of the proxy nodes, this server will appear to be online until the pre-configured Failover period expires.
Here you can see that after an interval of 1 minute the node is in the offline state and the monitored host is now assigned to a new proxy server – the second node in the cluster.
When the operation of the original proxy node is resumed, it will still show as unavailable until the predefined interval (in our case 1 minute) has passed.

After the interval has passed, we see the original proxy server online again, but the monitored host is still assigned to the same node in the cluster.
The cluster works in active-active mode, so there is no reason to switch the host back at the moment.

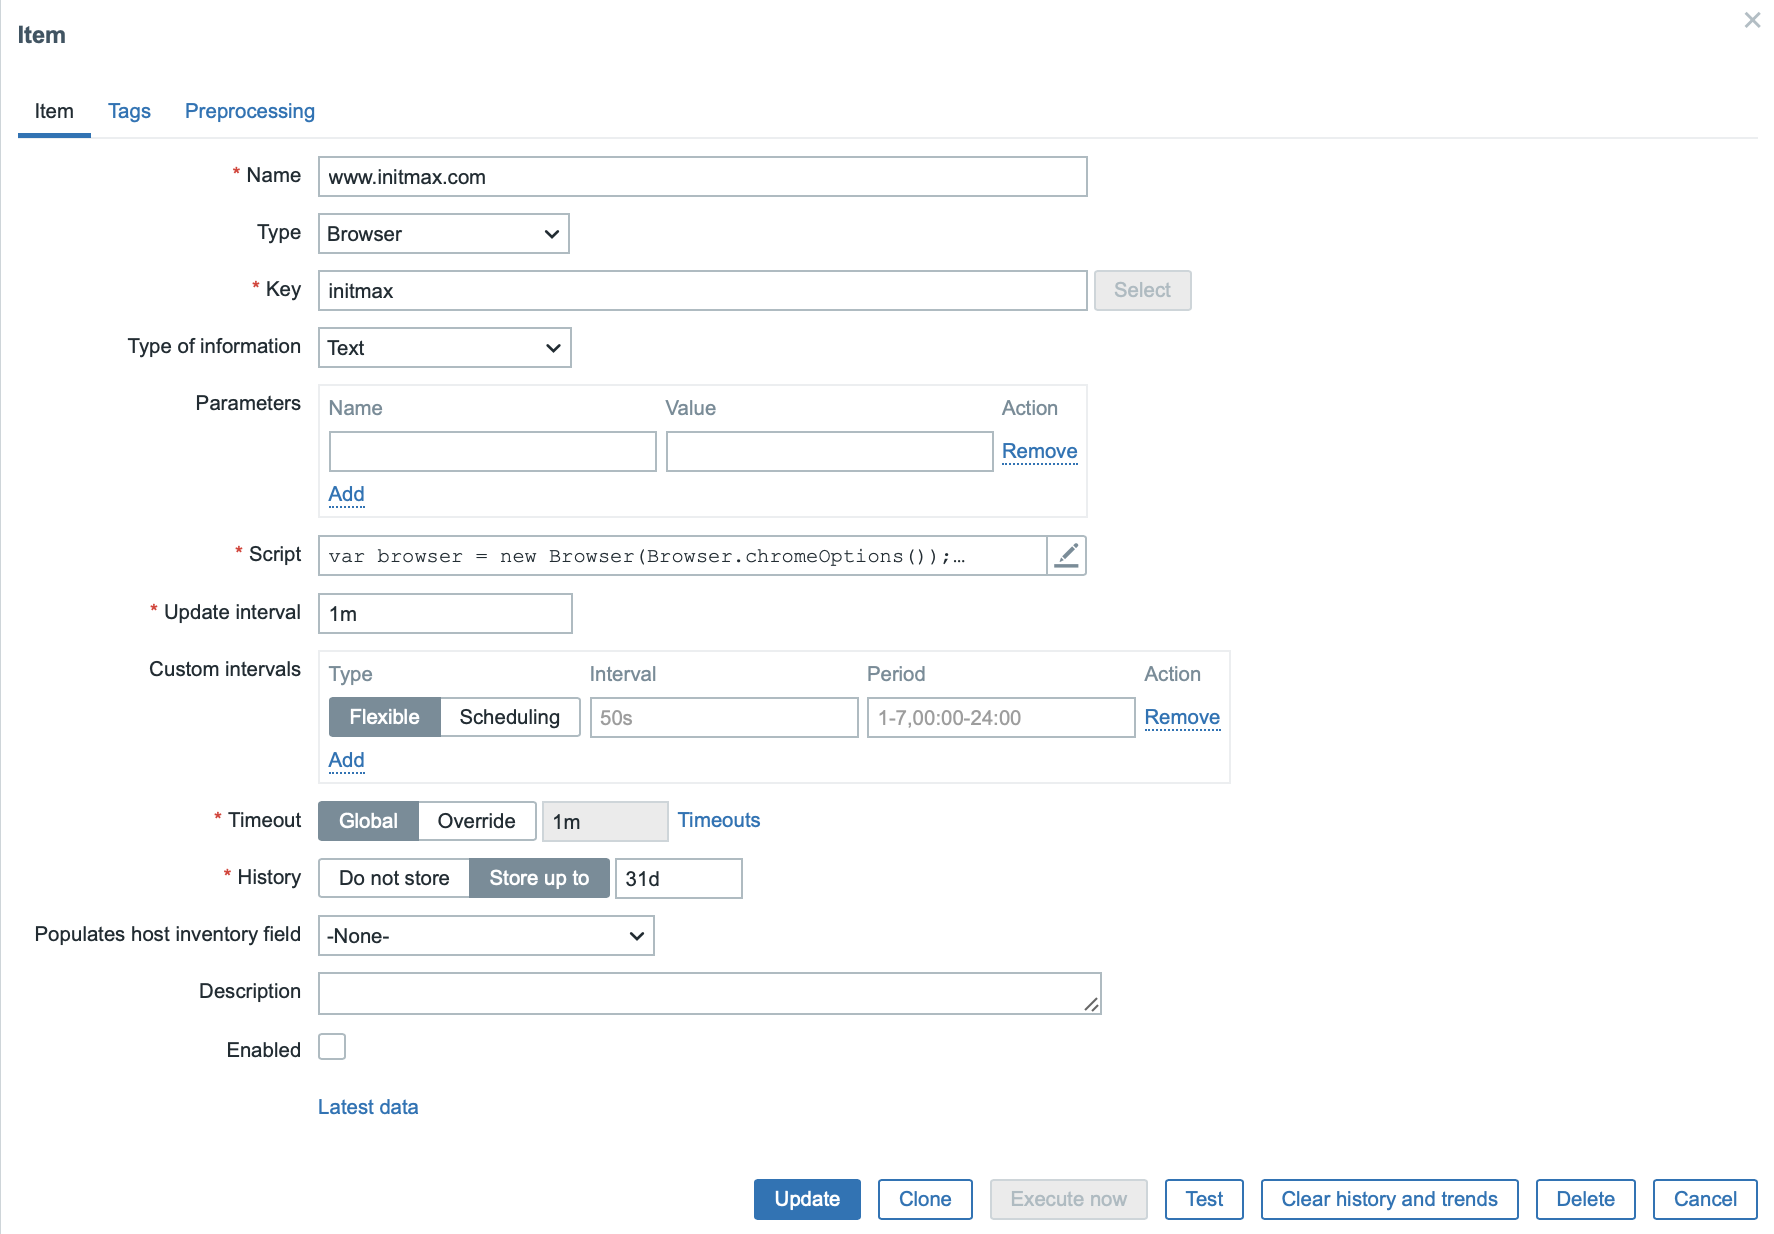
New item Browser
New “Browser” item utilizes Selenium as a mediator for complete loading of JavaScript-enabled web pages. This item enables the creation of complex monitoring scenarios, including automatic capture of screenshots at the end of the process. Users can save screenshots as binary data using dependent items. Installing Selenium as a standalone component is required.
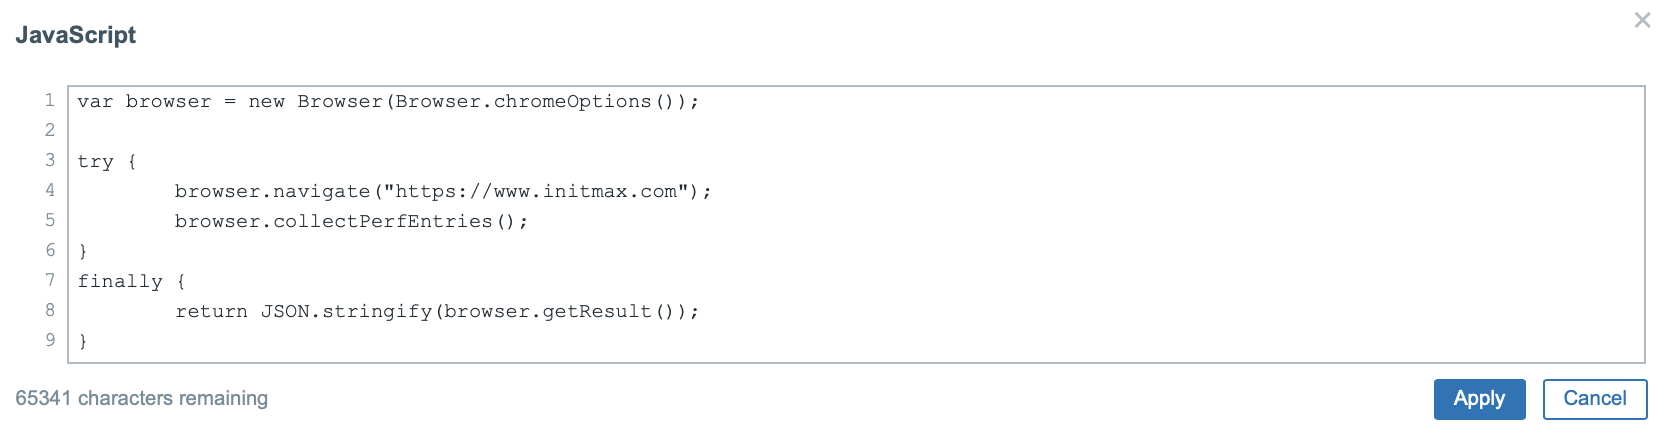
Example of JavaScript inside the settings of the browser item.
Test result and data demonstration.
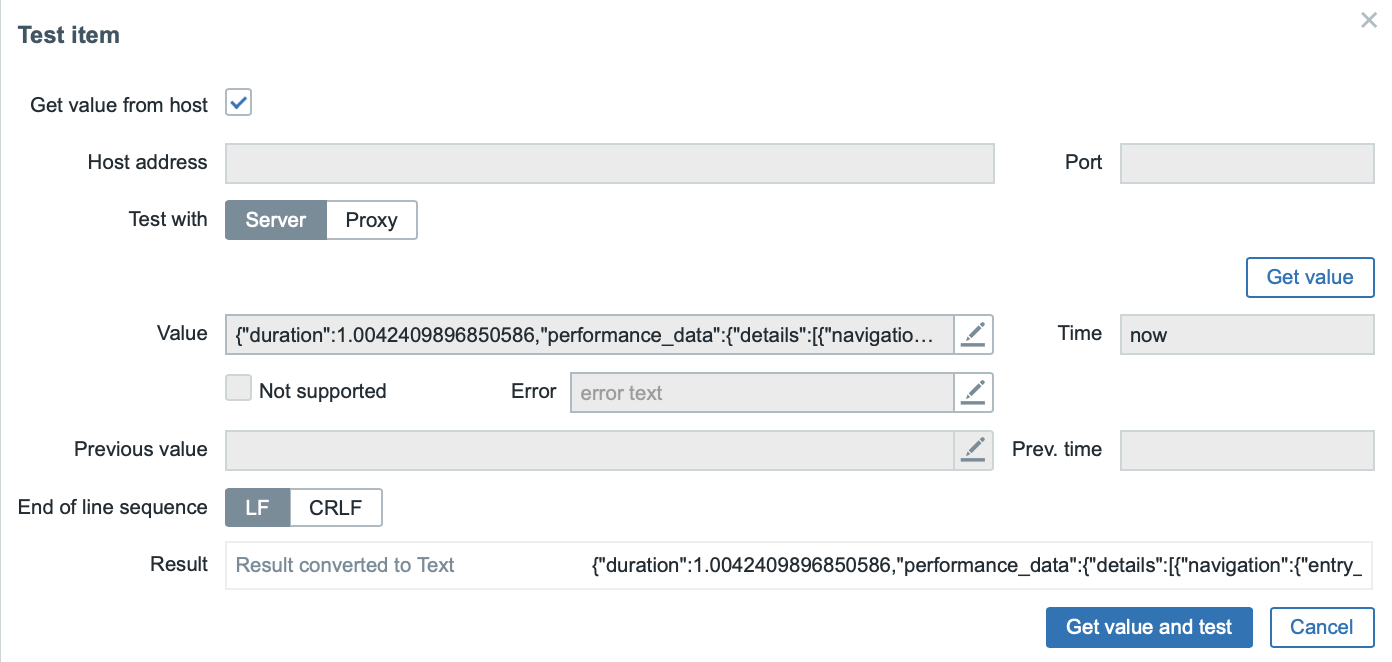
{rn u0022durationu0022: 1.004,rn u0022performance_datau0022: {rn u0022detailsu0022: [rn {rn u0022navigationu0022: {rn u0022entry_typeu0022: u0022navigationu0022,rn u0022dom_content_loaded_event_startu0022: 462.1,rn ...rn u0022connect_startu0022: 18,rn u0022durationu0022: 910,rn u0022typeu0022: u0022navigateu0022rn },rn u0022resourceu0022: {rn u0022response_timeu0022: 5174.8,rn ...rn u0022request_timeu0022: 287.7rn }rn }rn ],rn u0022summaryu0022: {rn u0022navigationu0022: {rn u0022dom_content_loading_timeu0022: 2.2,rn ...rn u0022min_protocolu0022: u0022http/1.1u0022rn },rn u0022resourceu0022: {rn u0022response_timeu0022: 5174.8,rn ...rn u0022request_timeu0022: 287.7rn }rn }rn }rn}And below you can see how can it look on a dashboard with screenshots.
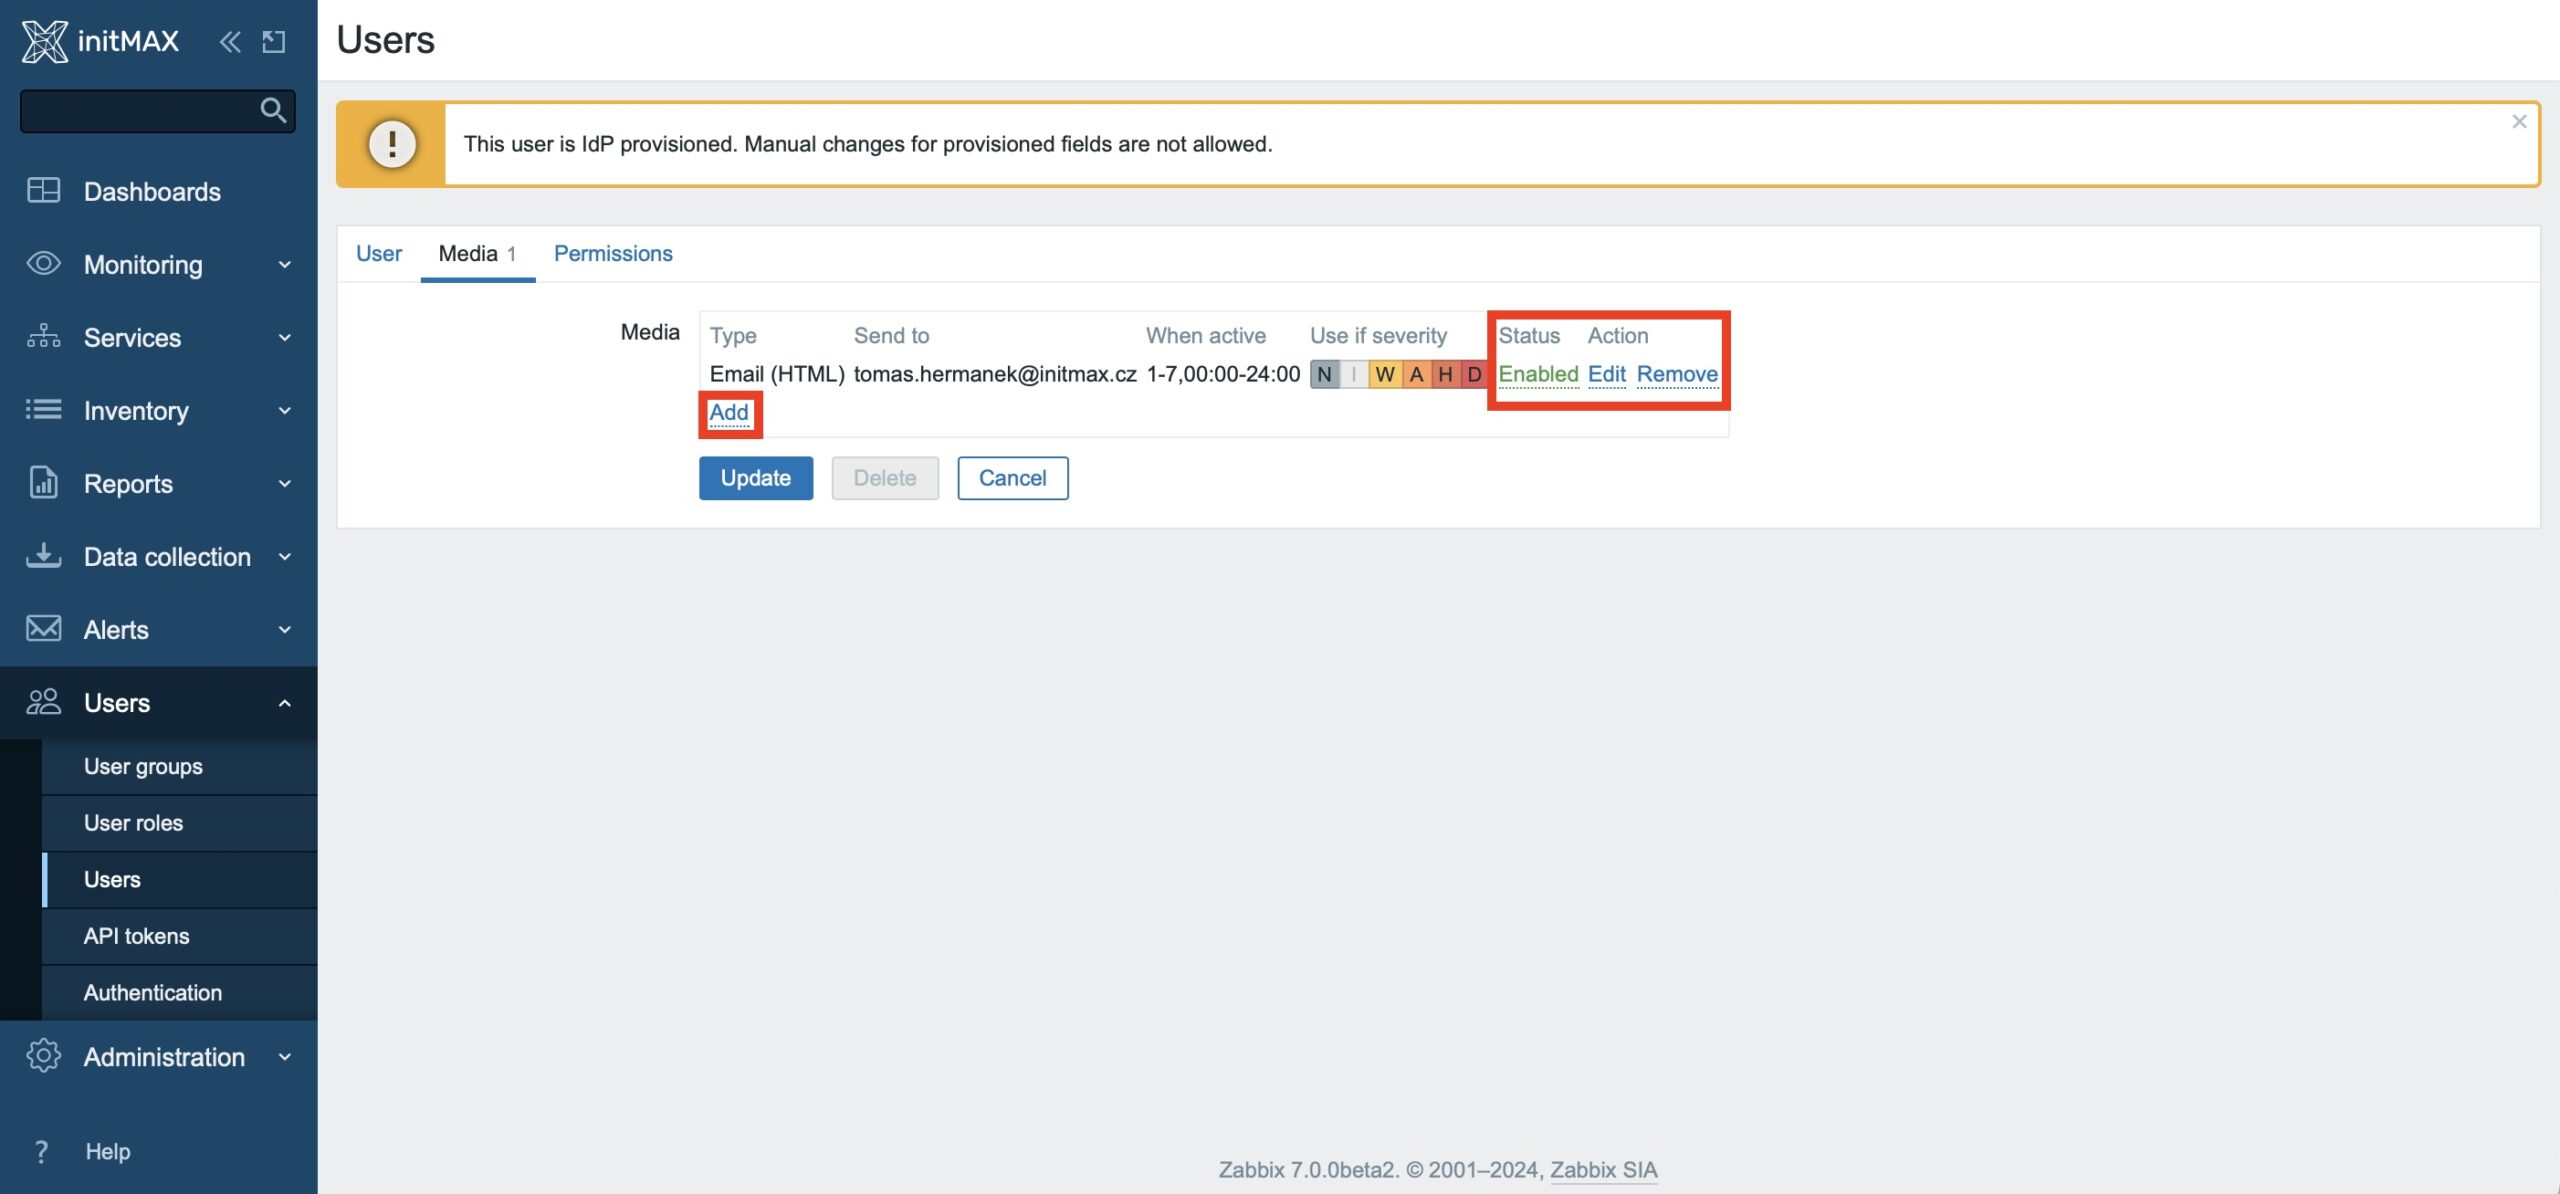
Ability to manually edit User media with JIT
In Zabbix version 6.4, the option to set up authentication using an external authentication provider and using JIT was added, but the options to set parameters for automatic assignment of user media, media update or the ability of any manual adjustment were missing.
This changes with version 7.0 and not only are media now automatically assigned and updated, but at the level of media type mapping we can now set what parameters the media is created with.
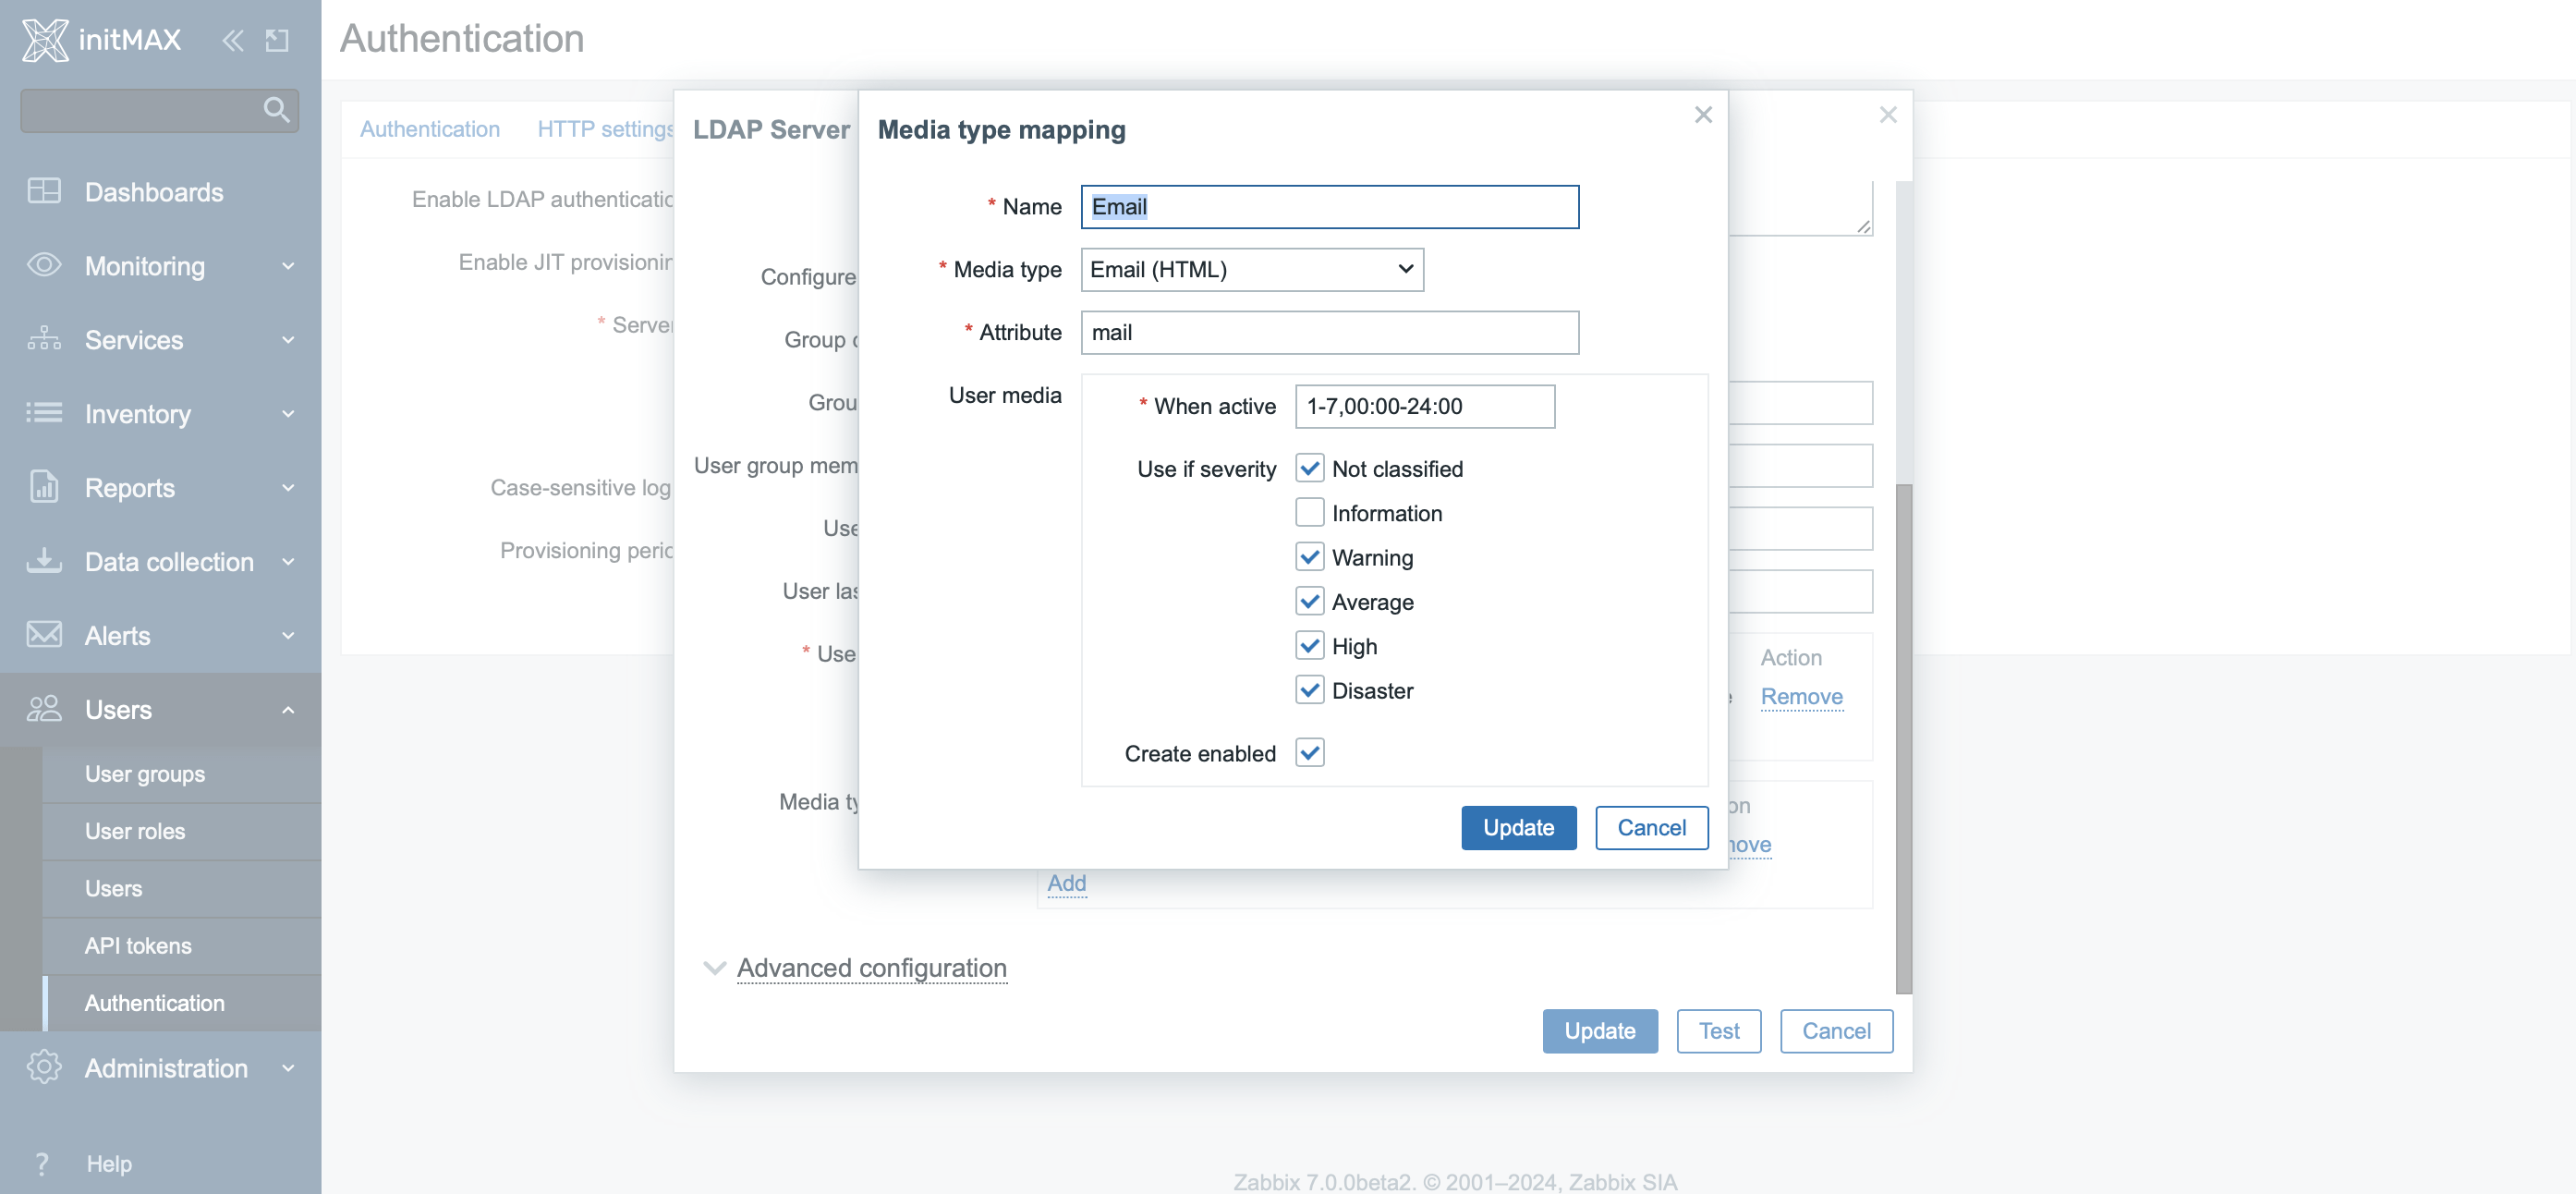
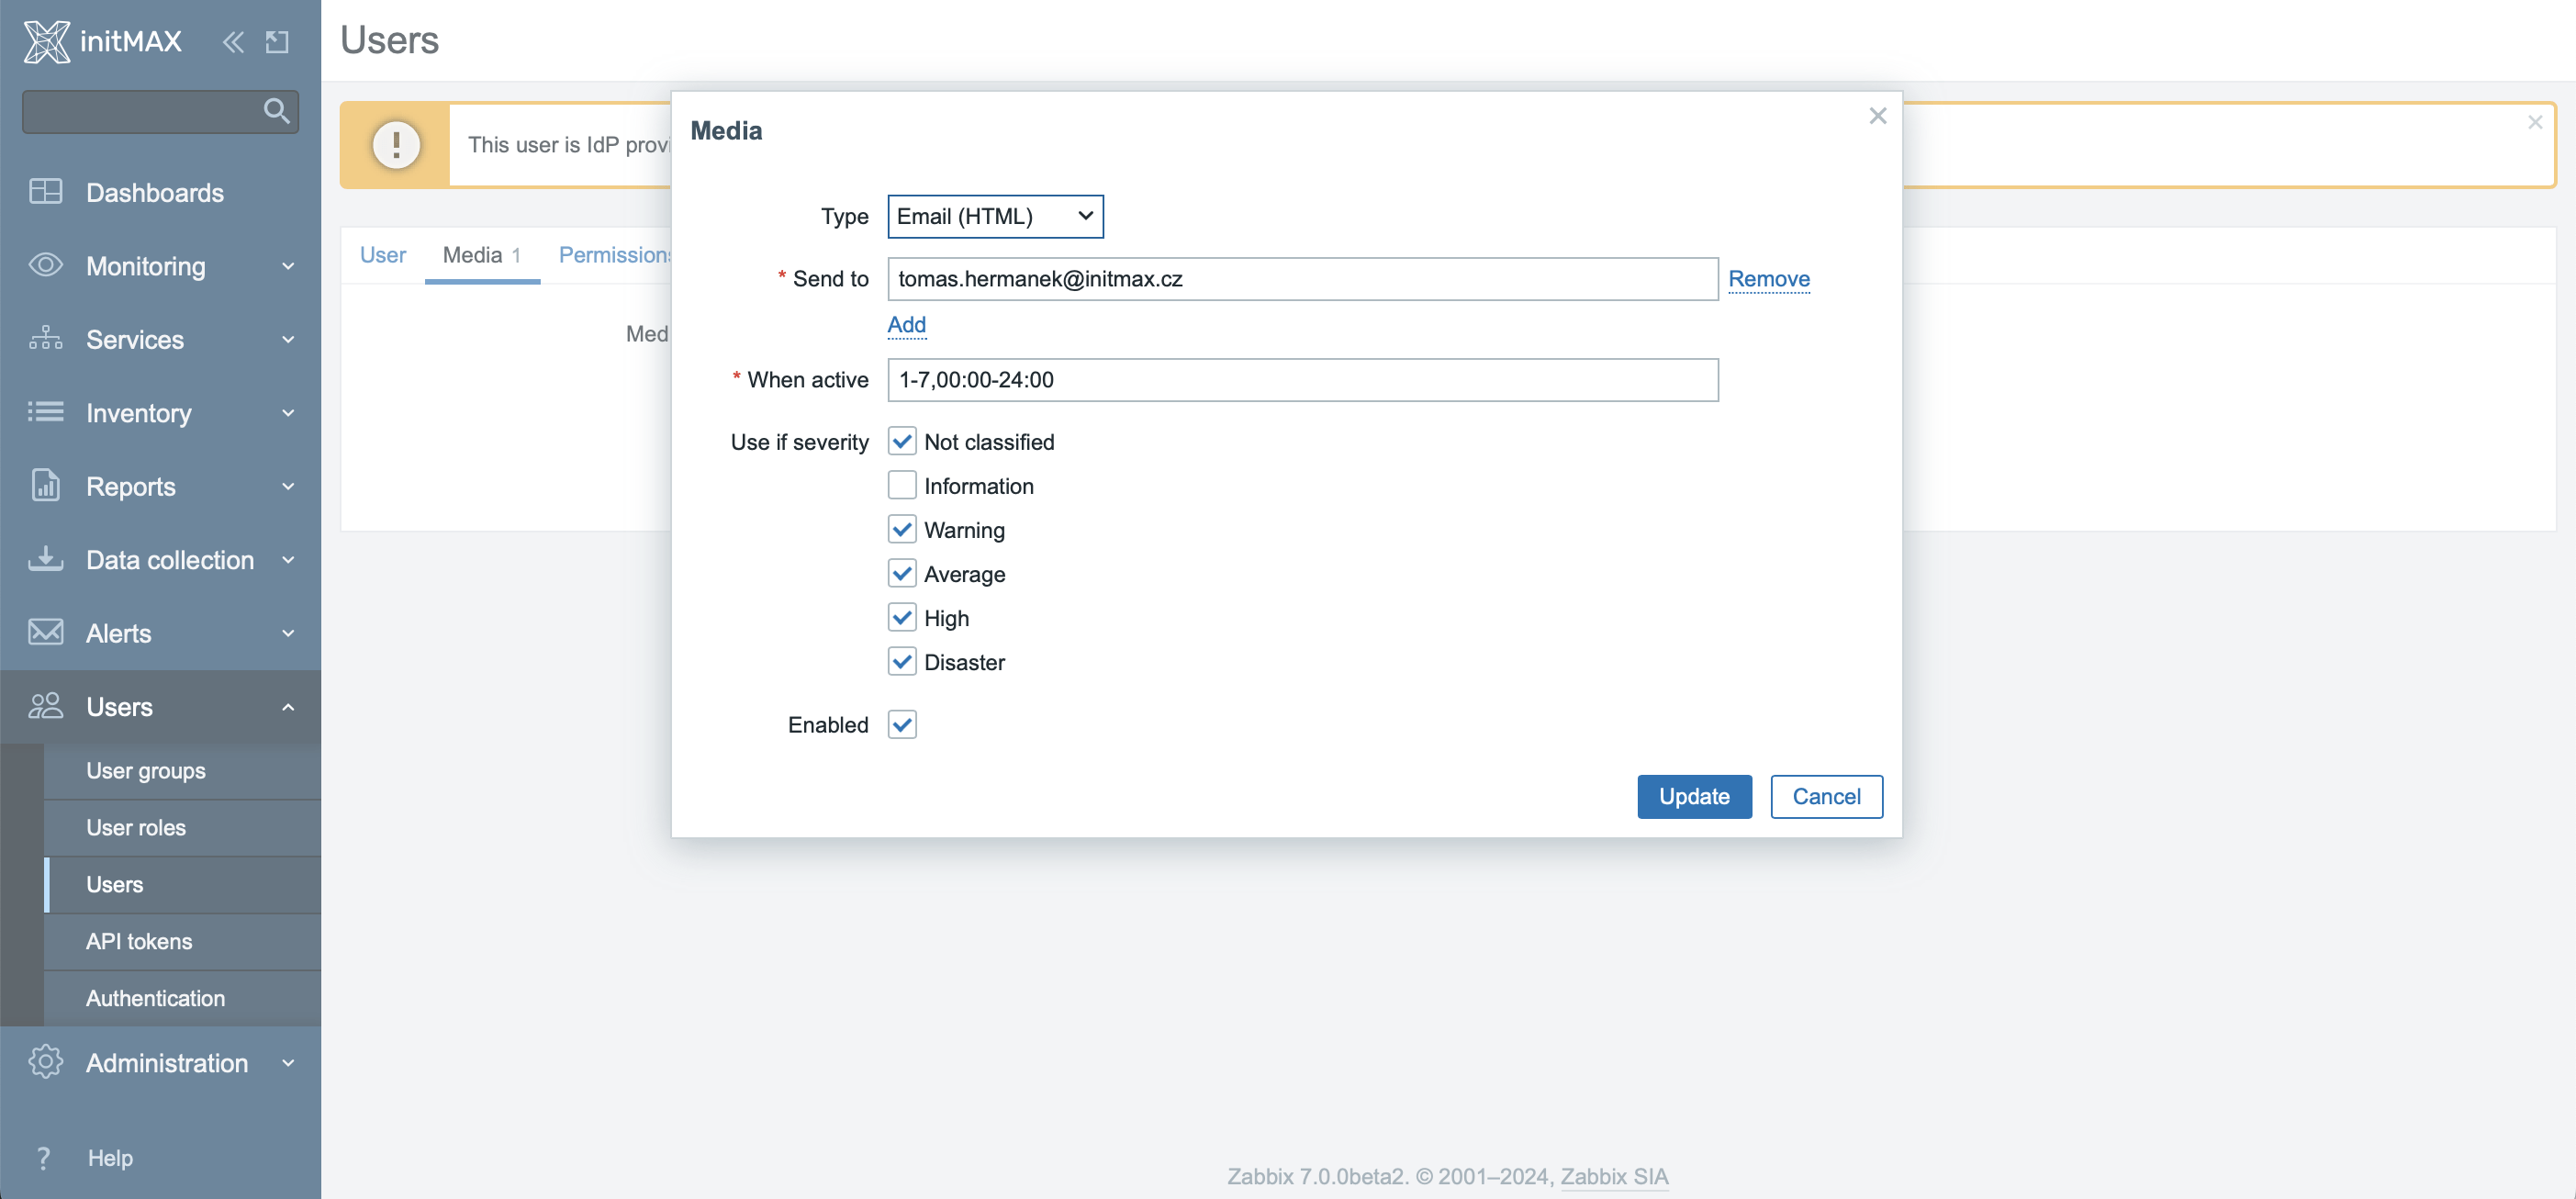
Another new functionality that version 7.0 brings in this area is the ability to modify automatically created media or add new ones manually.
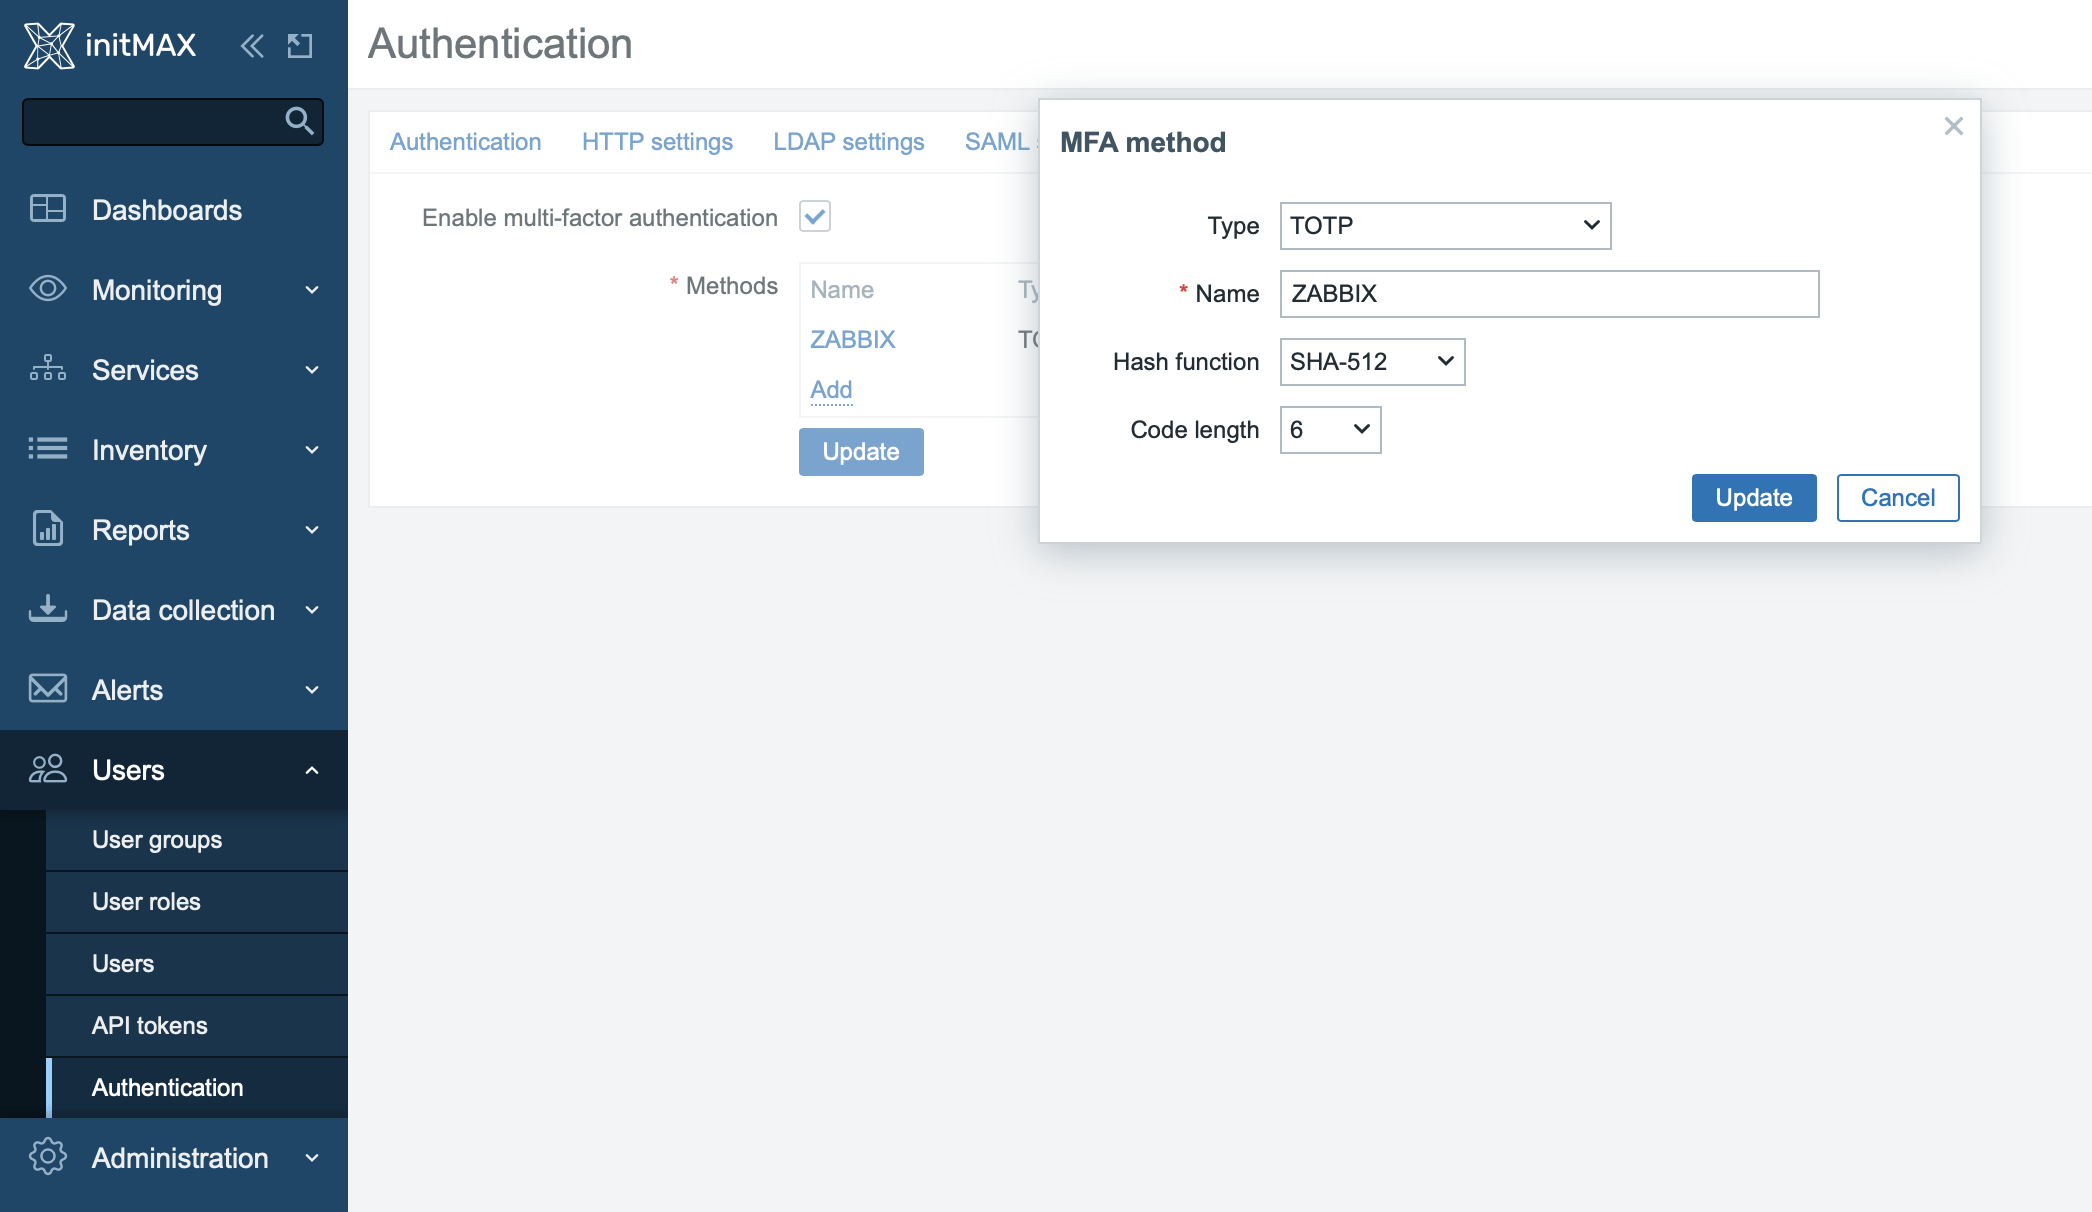
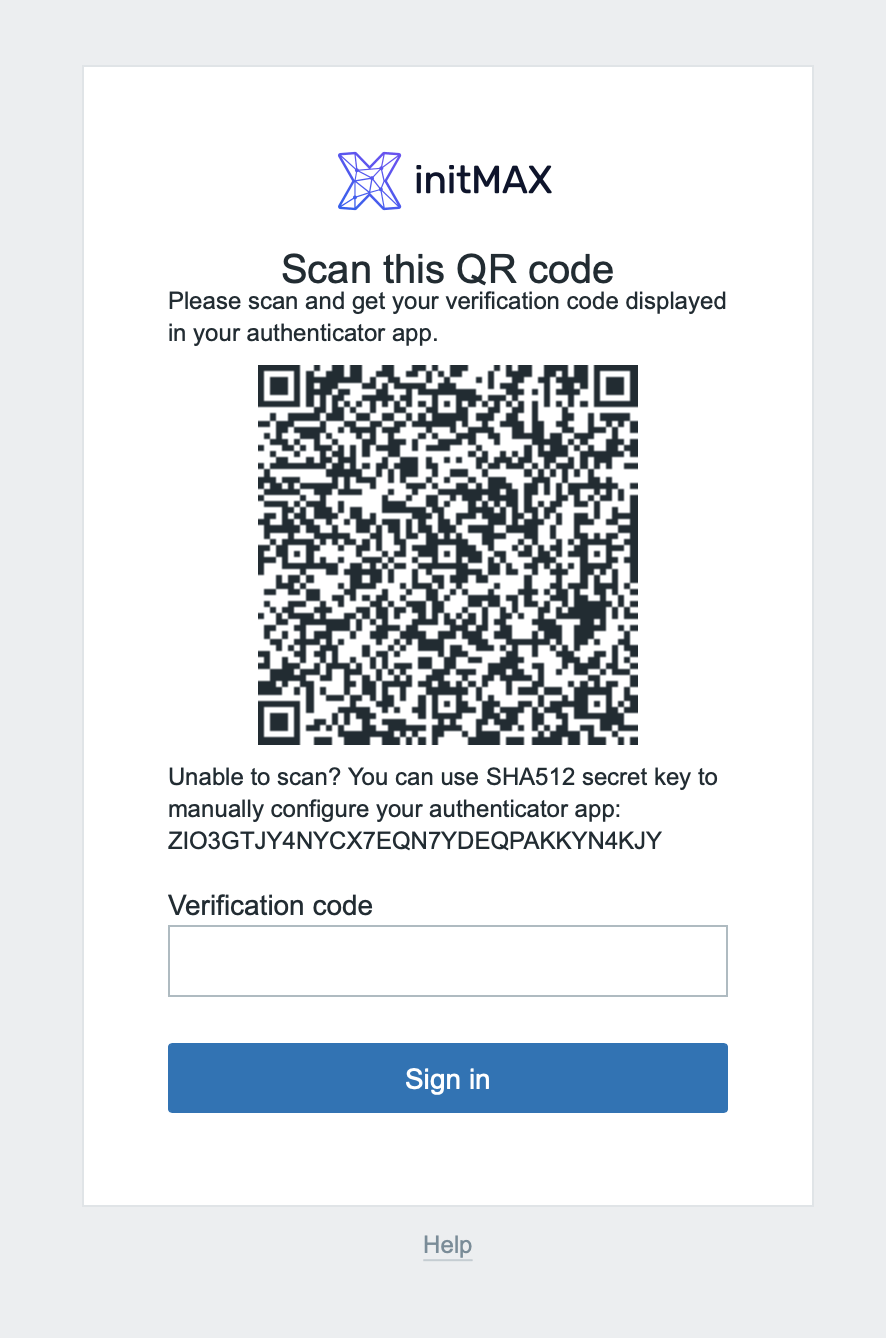
Native two-factor authentication (MFA) capability has been added to Zabbix
Now, you have the option to utilize two-factor authentication (MFA) with either TOTP or DUO Universal Prompt, applicable variably across different user groups.
- TOTP stands for ‘Time-based One-Time Password’ and is a time-based one-time password mechanism. This MFA mechanism generates a temporary code based on the current time, enhancing security as the password is valid only for a limited duration and cannot be reused.
- TOTP is typically generated through mobile apps like Google Authenticator or Authy. Users display the current code from the app and enter it alongside with their regular password during login. Each code is valid only for a short period, usually from 30 seconds to a few minutes, thus increasing authentication security.
- DUO Universal Prompt, from Duo Security, enhances and simplifies the MFA process. MFA typically requires users to prove their identity using more than one verification mechanism to access protected systems and services.
- Universal Prompt is designed to be compatible with a wide range of devices and platforms, offering extensive options for managing and setting authentication policies according to organizational needs. Its use significantly increases overall security for accessing sensitive data and services, while reducing complications associated with traditional MFA methods.
Basic MFA settings can be found under Users > Authentication > MFA settings.
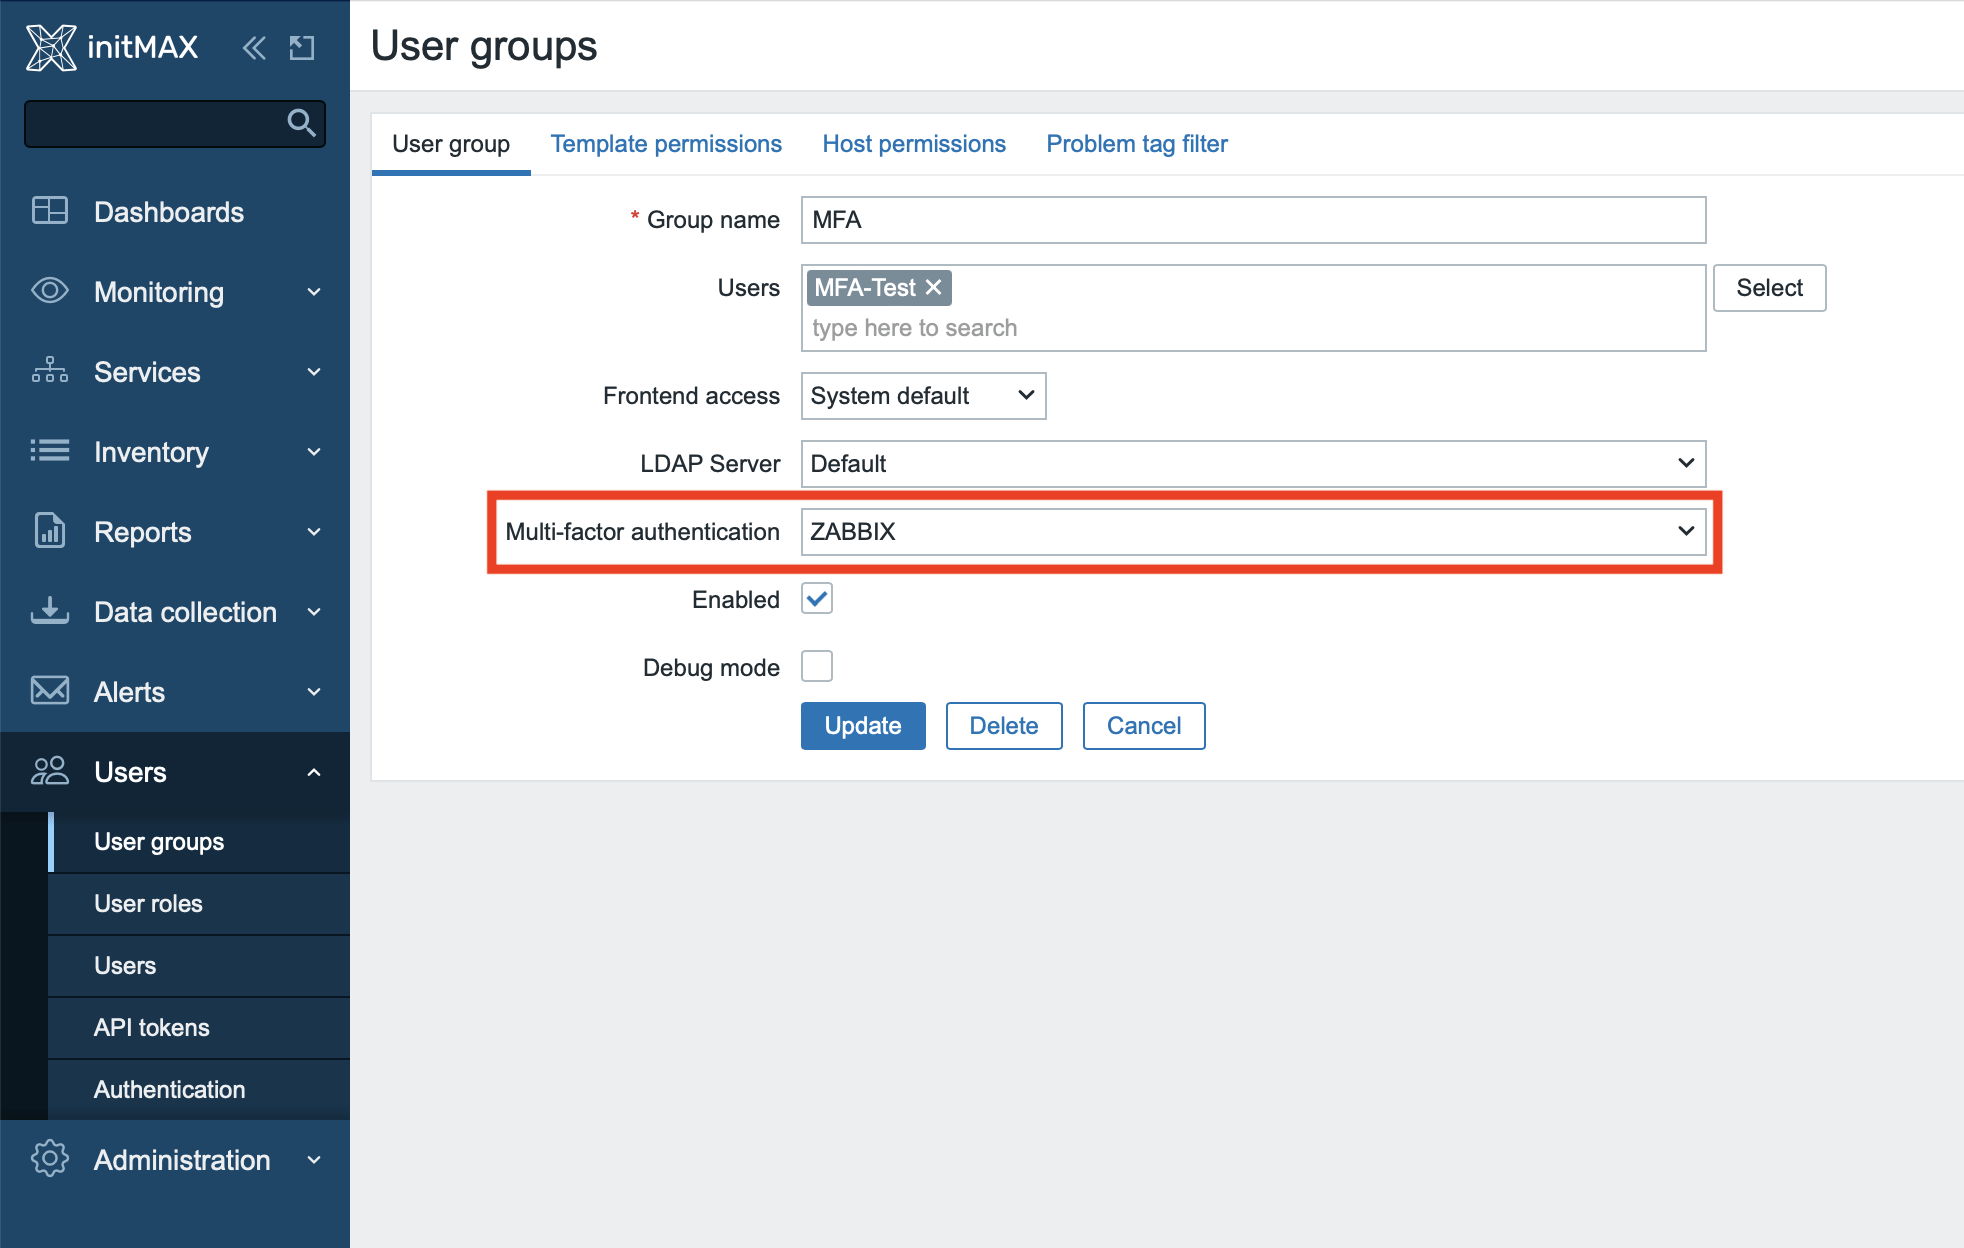
The defined Multi-Factor Authentication (MFA) settings from the previous step can then be applied at the user group level.
Upon the first login for a user group with the MFA settings applied, Zabbix prompts the user for verification using their chosen authenticator, such as Google Authenticator. This completes the MFA setup for the individual user.
In the system information you will find details about versions and available updates
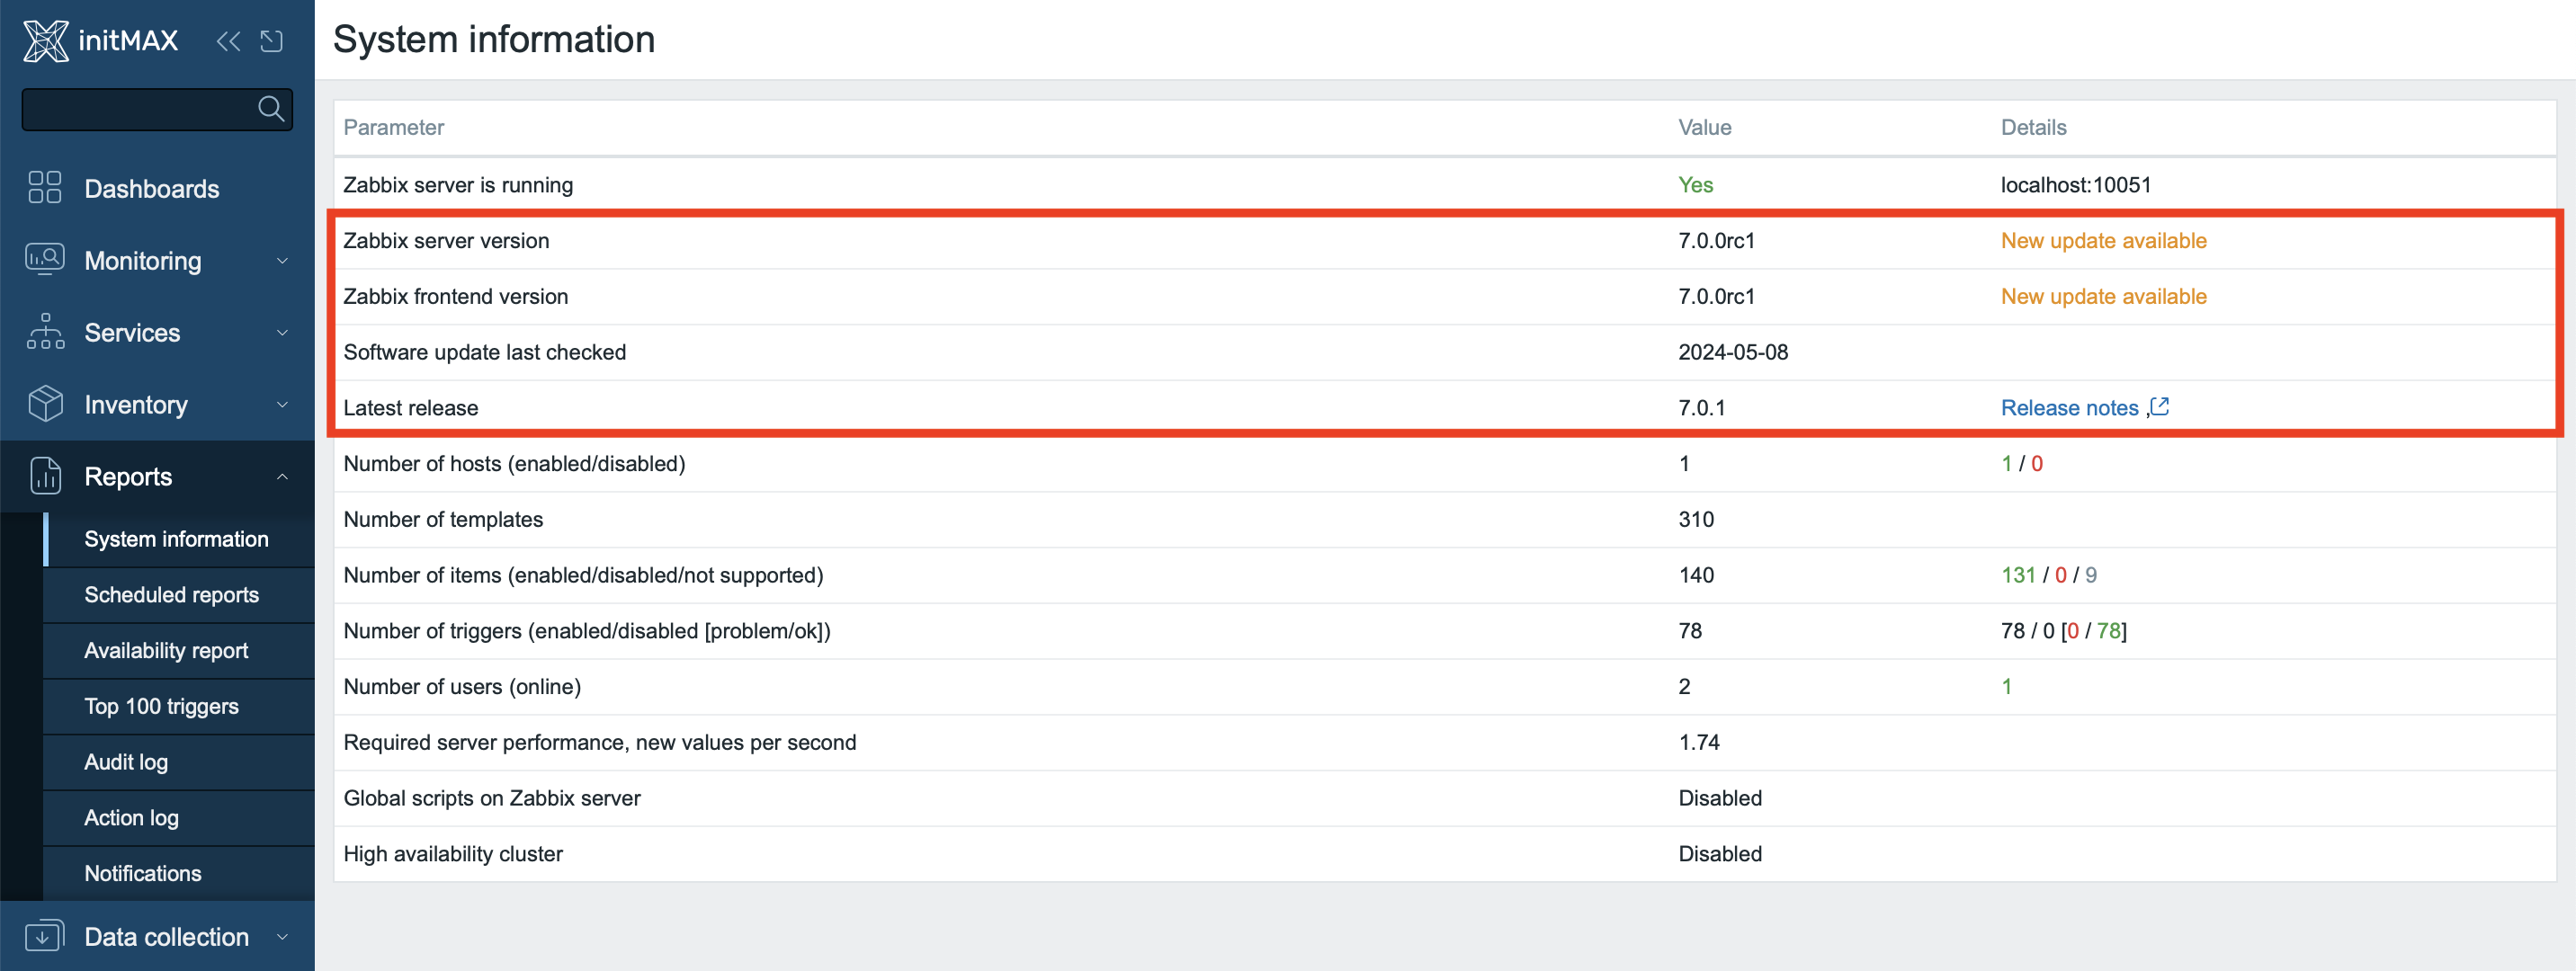
Zabbix 7.0 introduces a new endpoint that allows monitoring of currently used versions both on the server side and on the frontend. Users will be notified about the availability of a new version, specifically the latest available version and a link to the relevant release notes. This feature simplifies version management and maintenance of the current system. Version checking can be disabled on the server side if necessary. By default, the status update occurs every 8 hours.
Collapsible advanced configuration
Checkboxes, which until now were used to display advanced configuration, have now been replaced by collapsible blocks. This results in a greatly improved user experience, as collapsing these blocks and saving the configuration no longer resets the configured advanced options to their default values, as was the case when using checkboxes.
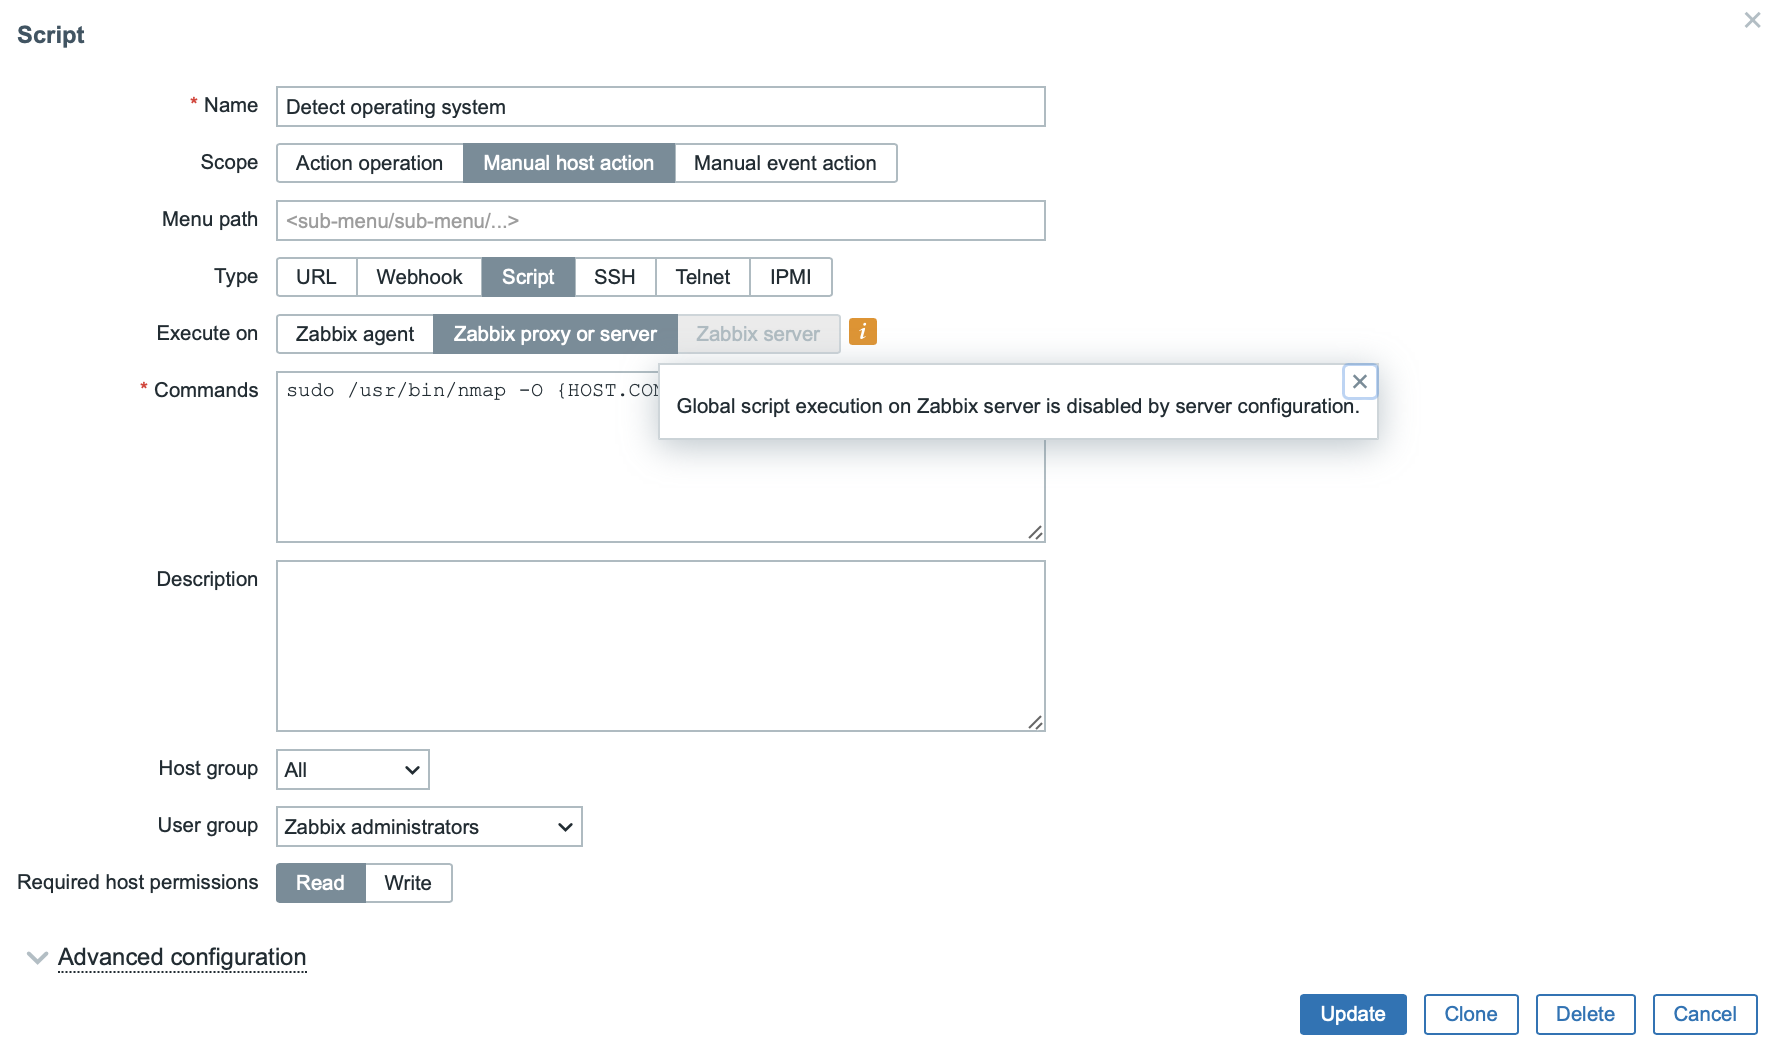
Global script execution can be disabled
Global script execution on the Zabbix server can be disabled by setting EnableGlobalScripts=0 in the server configuration. For new installations, global script execution on the Zabbix server is disabled by default. This potential disabling of scripts can be directly observed in the frontend as information.
Asynchronous pollers
The “agent poller“, “http agent pollers” and “snmp poller” processes have been replaced by their new, asynchronous variants and are now capable to perform multiple checks at the same time.
The old versions of these processes were only synchronous, so they could only perform one single action at a time and most of the time was spent by waiting for a response. These new, updated versions of poller processes are now starting an additional parallel process during the phase of waiting for a response. The speed and efficiency of monitoring has therefore undergone a drastic improvement.
These processes can be configured by editing configuration directives “StartHTTPAgentPollers“, “StartAgentPollers” and “StartSNMPPollers” respectively.
The number of concurrent checks can be regulated using new directive “MaxConcurrencyCheckPerPoller” and is configurable up to 1000.
Alongside these changes, the builtin cURL function for persistent connections was newly implemented for HTTP checks.
In connection with the implementation of asynchronous SNMP, a function for asynchronous DNS resolving was added at the same time.
Multithreading
Several changes have been made as part of transitioning to a multithreaded architecture:
- Added a new configuration parameter:
--with-stacksize, which allows to overwrite the default thread stack size used by the system. - User macro resolving has been moved from the preprocessing manager to preprocessing workers.
Ability to run remote commands on active agents
Starting with Zabbix Agent version 7.0, it is now possible to run remote command on an agent running in active mode. As soon as the execution of a remote command is triggered by an action or a manual script run, the command will be included in the active checks configuration and executed once the active agent receives it. Note that legacy active agents will ignore any remote commands included in the active checks configuration.
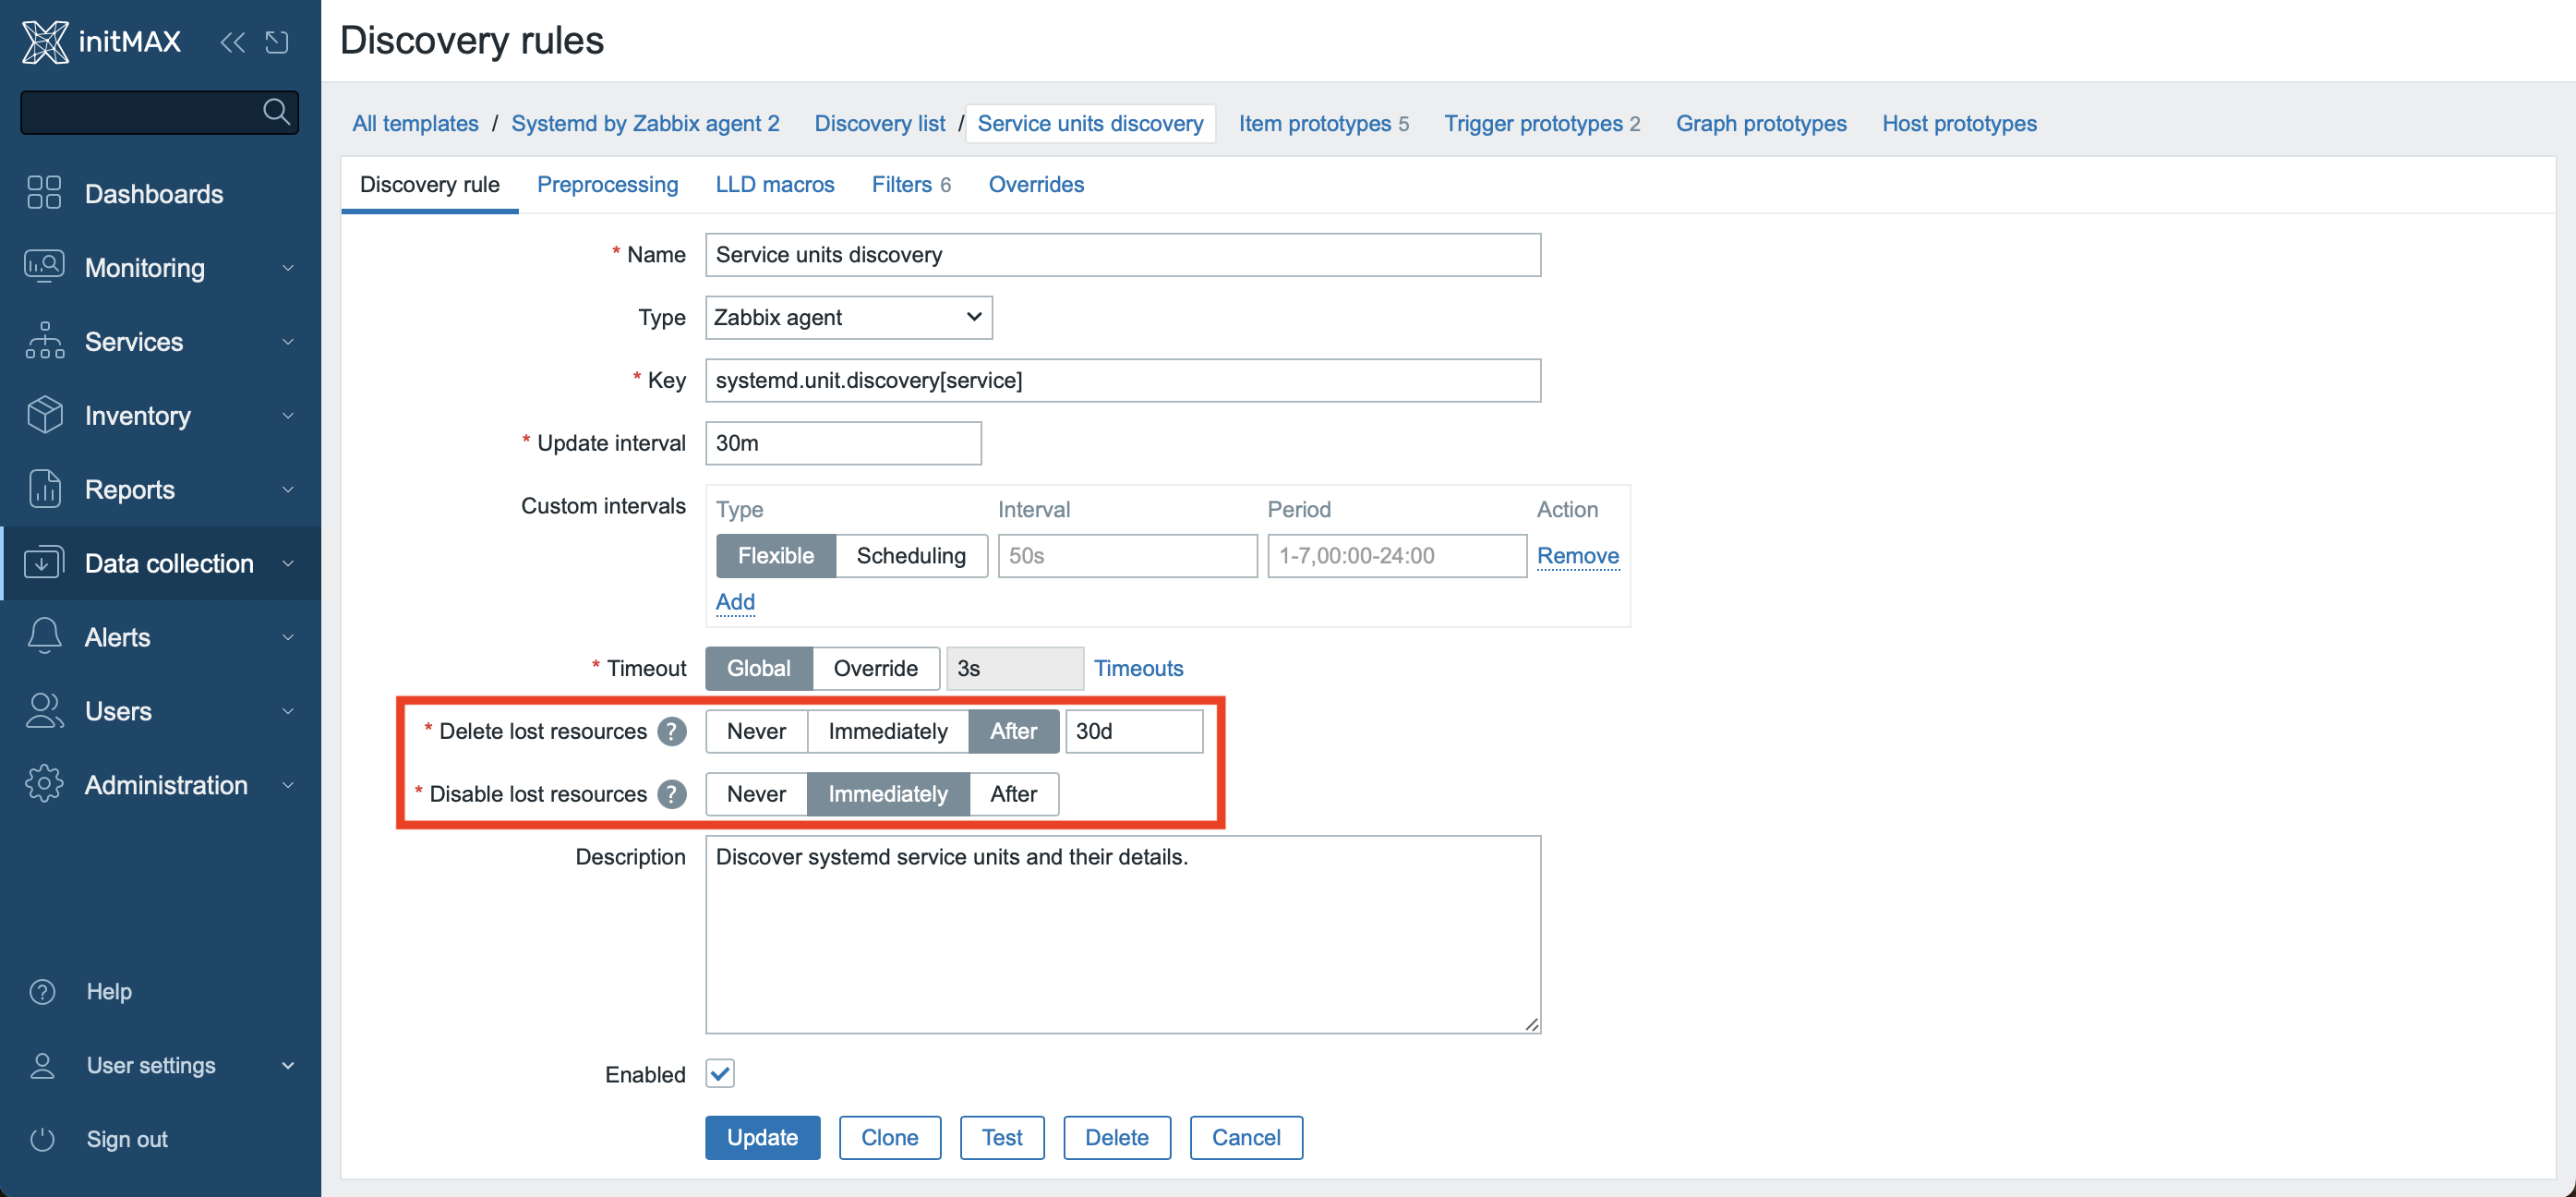
Disabling or deleting undiscovered probes using discovery rules (LLD)
The new version of Zabbix introduces a new option to avoid deleting or disabling probes that are no longer discovered using dynamic discovery rules (LLD). This feature allows users to choose among three options for handling probes: never delete them, delete them immediately, or delete them after a certain period. Additionally, users can choose whether to disable the discovered probes: again, they can choose between never, immediately, or after a certain period. An interesting feature is the ability to first disable a probe and later delete it after a certain period. This flexibility enables users to precisely configure how they want the system to handle discovered probes, helping to optimize resource management and maintain the system in an efficient state.
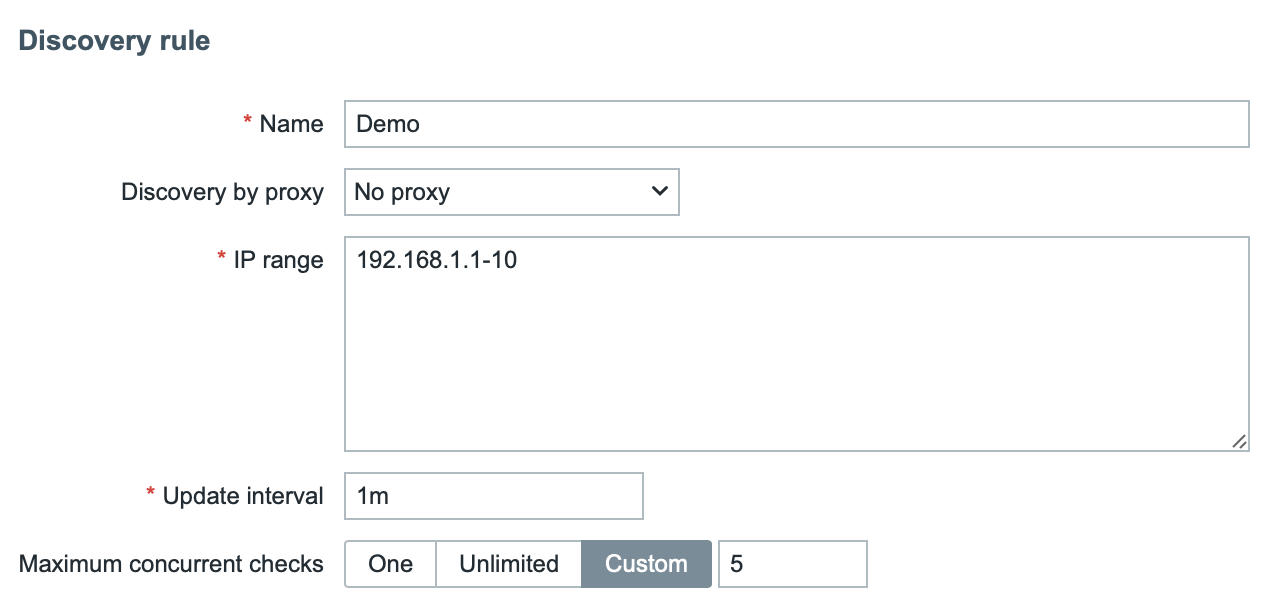
Concurrency in network discovery
Previously, each network discovery rule was handled by a single process. Thus, all control services within the rule could only be performed sequentially.
In the new version, the network discovery process has been reworked to allow parallel processing of inspection services. A new “discovery manager” process has been added along with a configurable number of “discovery workers”.
The default number of StartDiscoverers has been increased from 1 to 5 and the range from 0-250 to 0-1000.
Zabbix Proxy now uses memory buffer
A memory buffer has been developed for the Zabbix proxy used to store new data. This data is forwarded to the Zabbix server without the need to access the database, which again contributes to the increase in overall performance.
For optimized performance of this functionality, it is recommended to turn on the usage of memory buffer on the proxy. This is done by modifying the configuration directive “ProxyBufferMode” from the value “disk” (the hard-set default value for pre-existing installations) to the recommended value “hybrid” or the value “memory“.
Furthermore, it is necessary to set the size of this buffer, for which the “ProxyMemoryBufferSize” parameter is used.
If the proxy is stopped, the memory buffer is full, or the data is too old, then the memory buffer in “hybrid” mode protects against data loss by dumping unsent data to the database, and then the proxy reverts to using the memory buffer after all values have been written. In “memory” mode, only the buffer memory will be used and thus performance is potentially higher, but there is no protection against data loss.
Separate database tables for Zabbix Proxies
Zabbix Proxy records have been moved from the “hosts” table in the database and is now stored in the new “proxy” table.
Also, operational data about Zabbix Proxies (such as version, compatibility or last access) has been moved from the “host_rtdata” table and is now stored in the new “proxy_rtdata” table in the database.
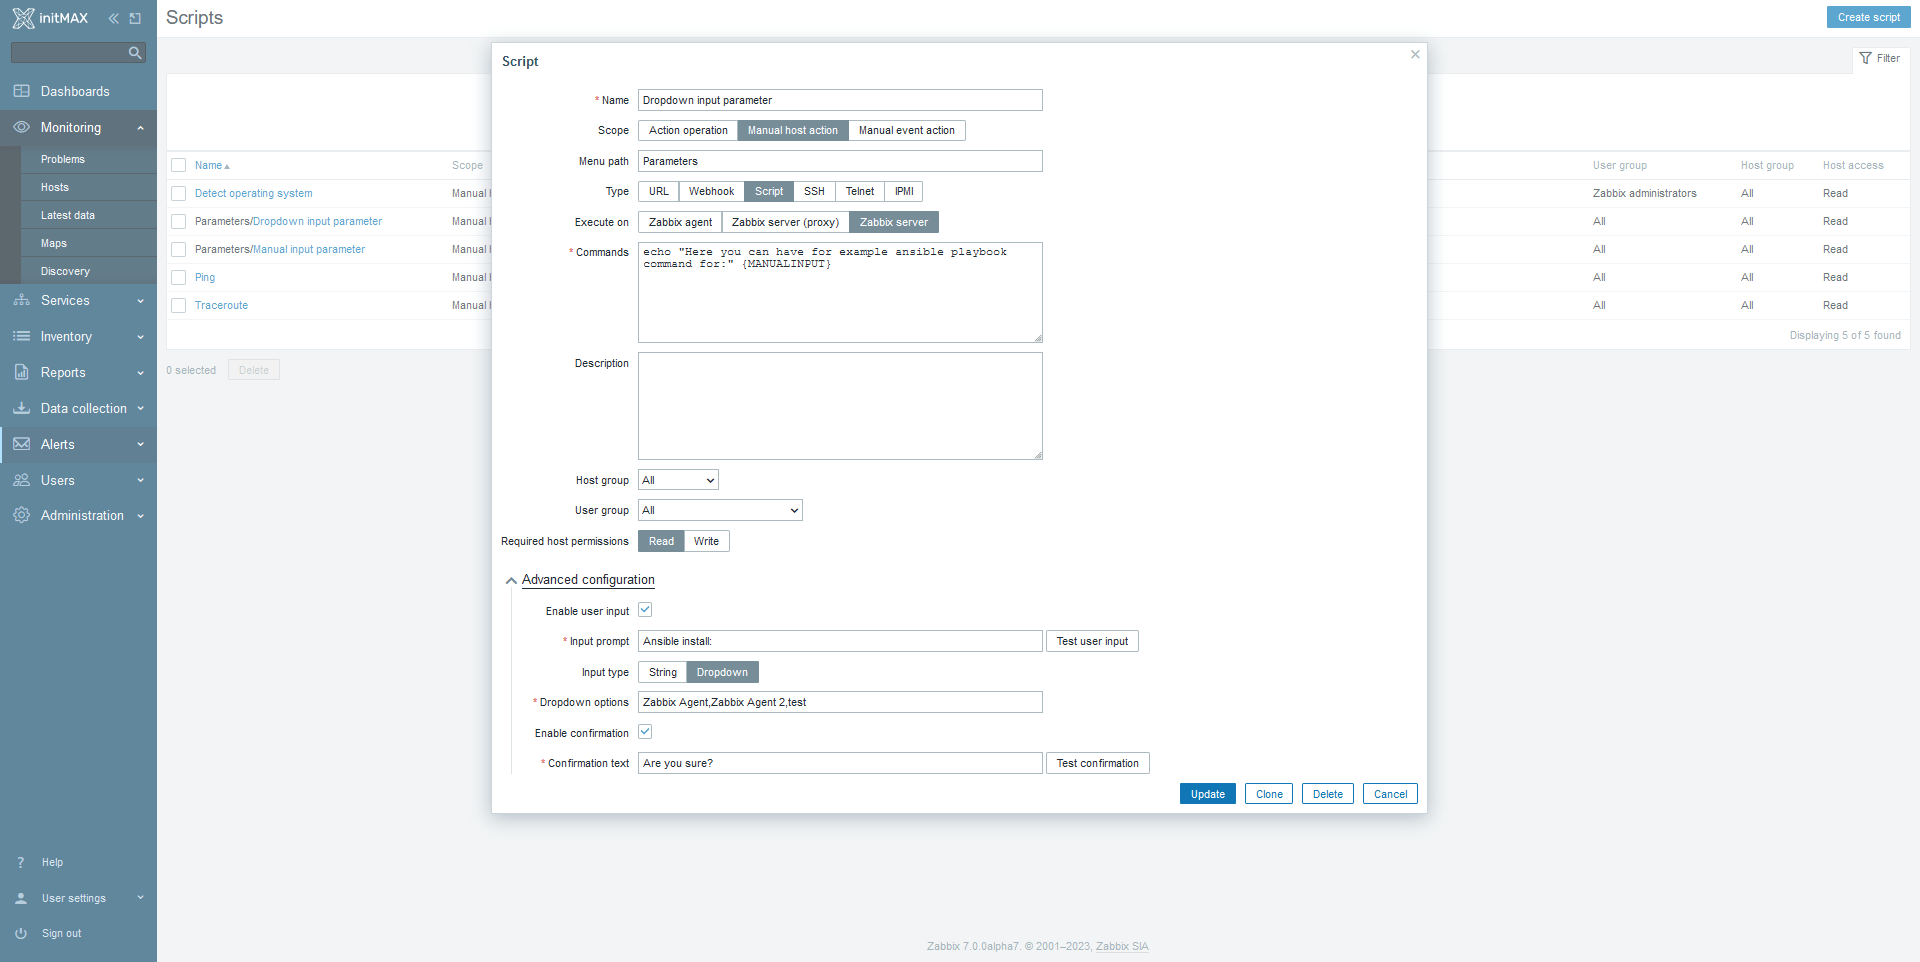
Scripts with parameters
Until now, internal script definitions did not have the option of sending a parameter to the input of the script, so each call to the script with a specific parameter had to be defined separately.
This changes in Zabbix version 7.0 and scripts now accept an input parameter so it is now enough to define a specific script in the Zabbix frontend and the available parameters can then be defined using a simple wizard with preset options (using a drop-down menu).
Here you can see all available settings for this kind of approach:
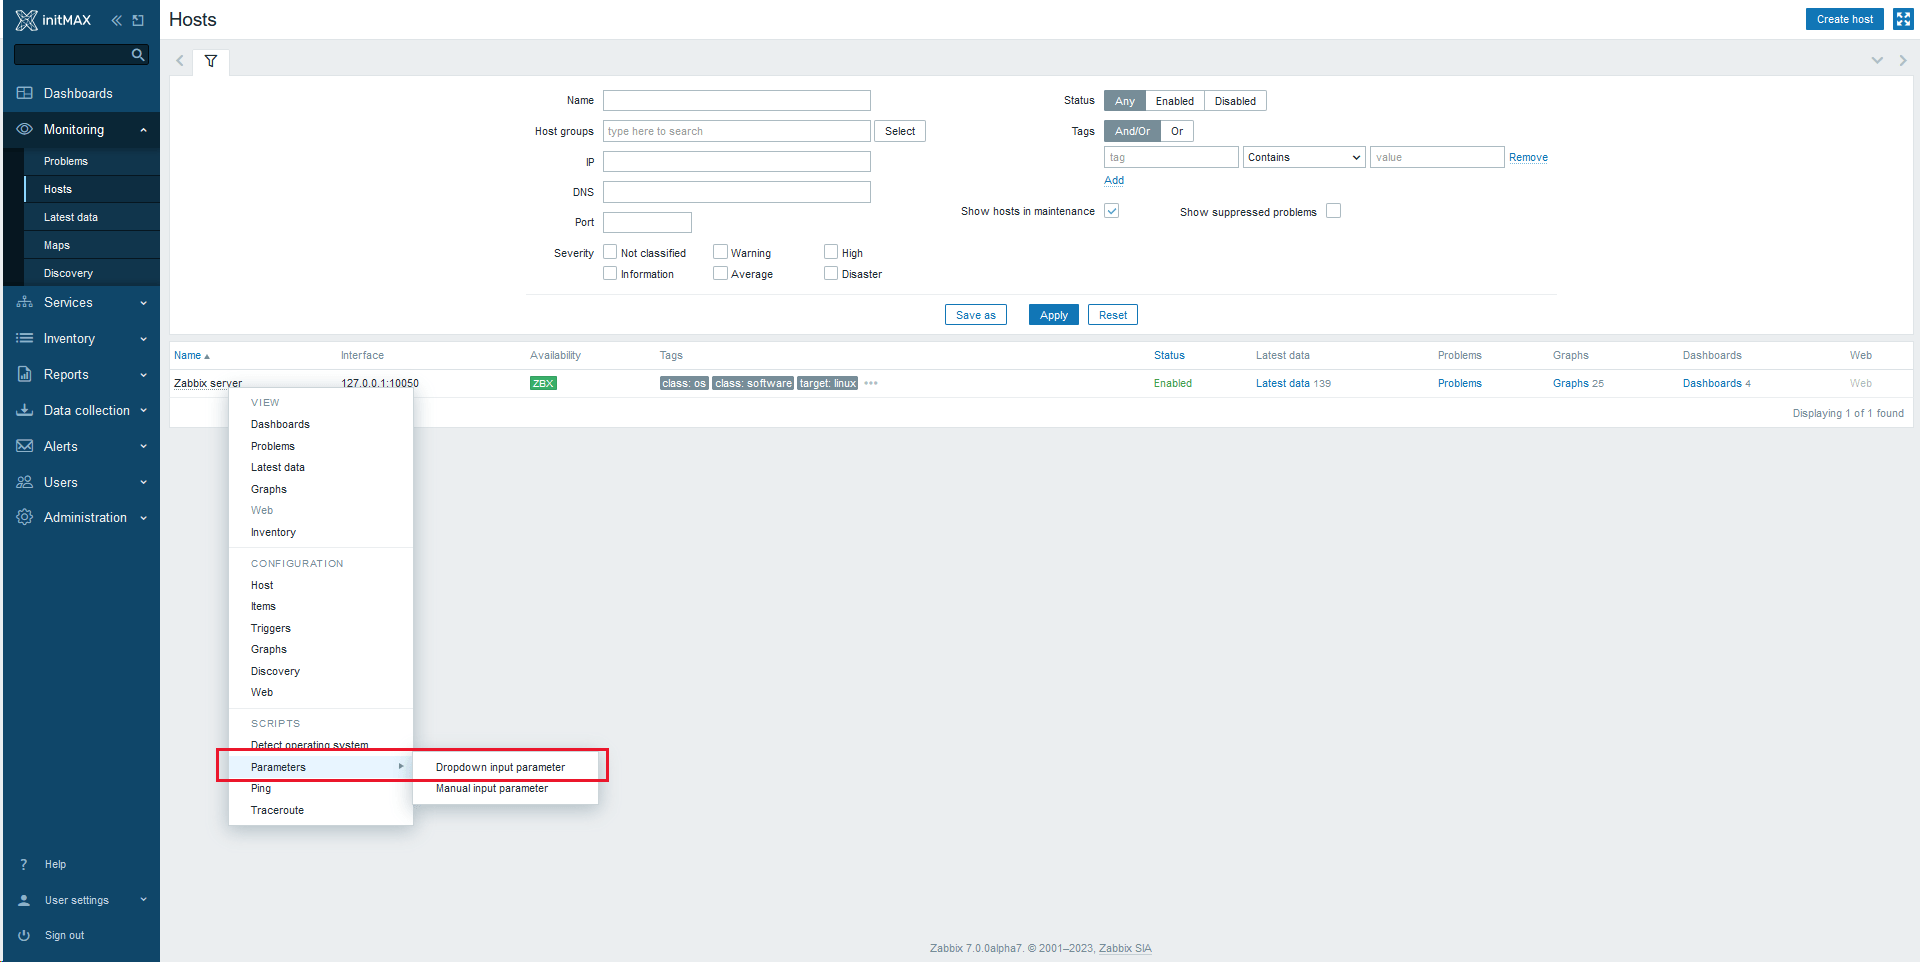
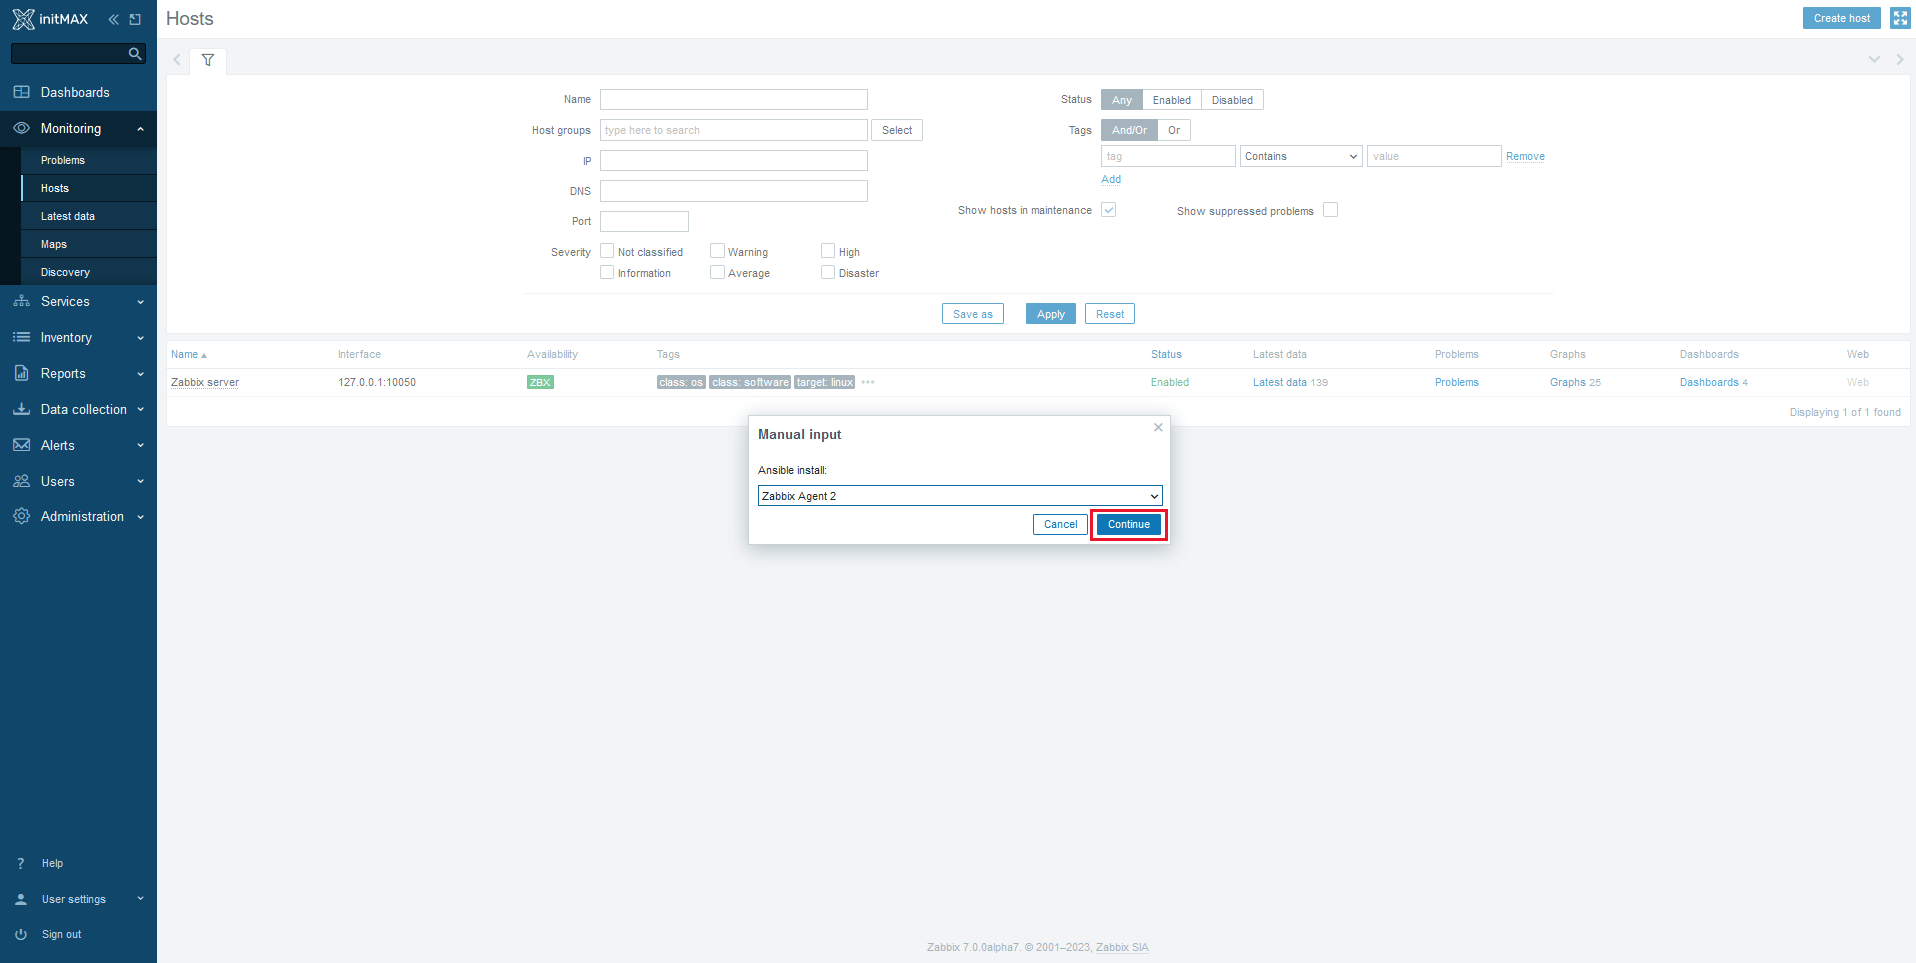
Consequently, you can see in the following screenshots, how the entire process of running the script with parameters defined using the “drop-down menu” takes place directly at the host level.
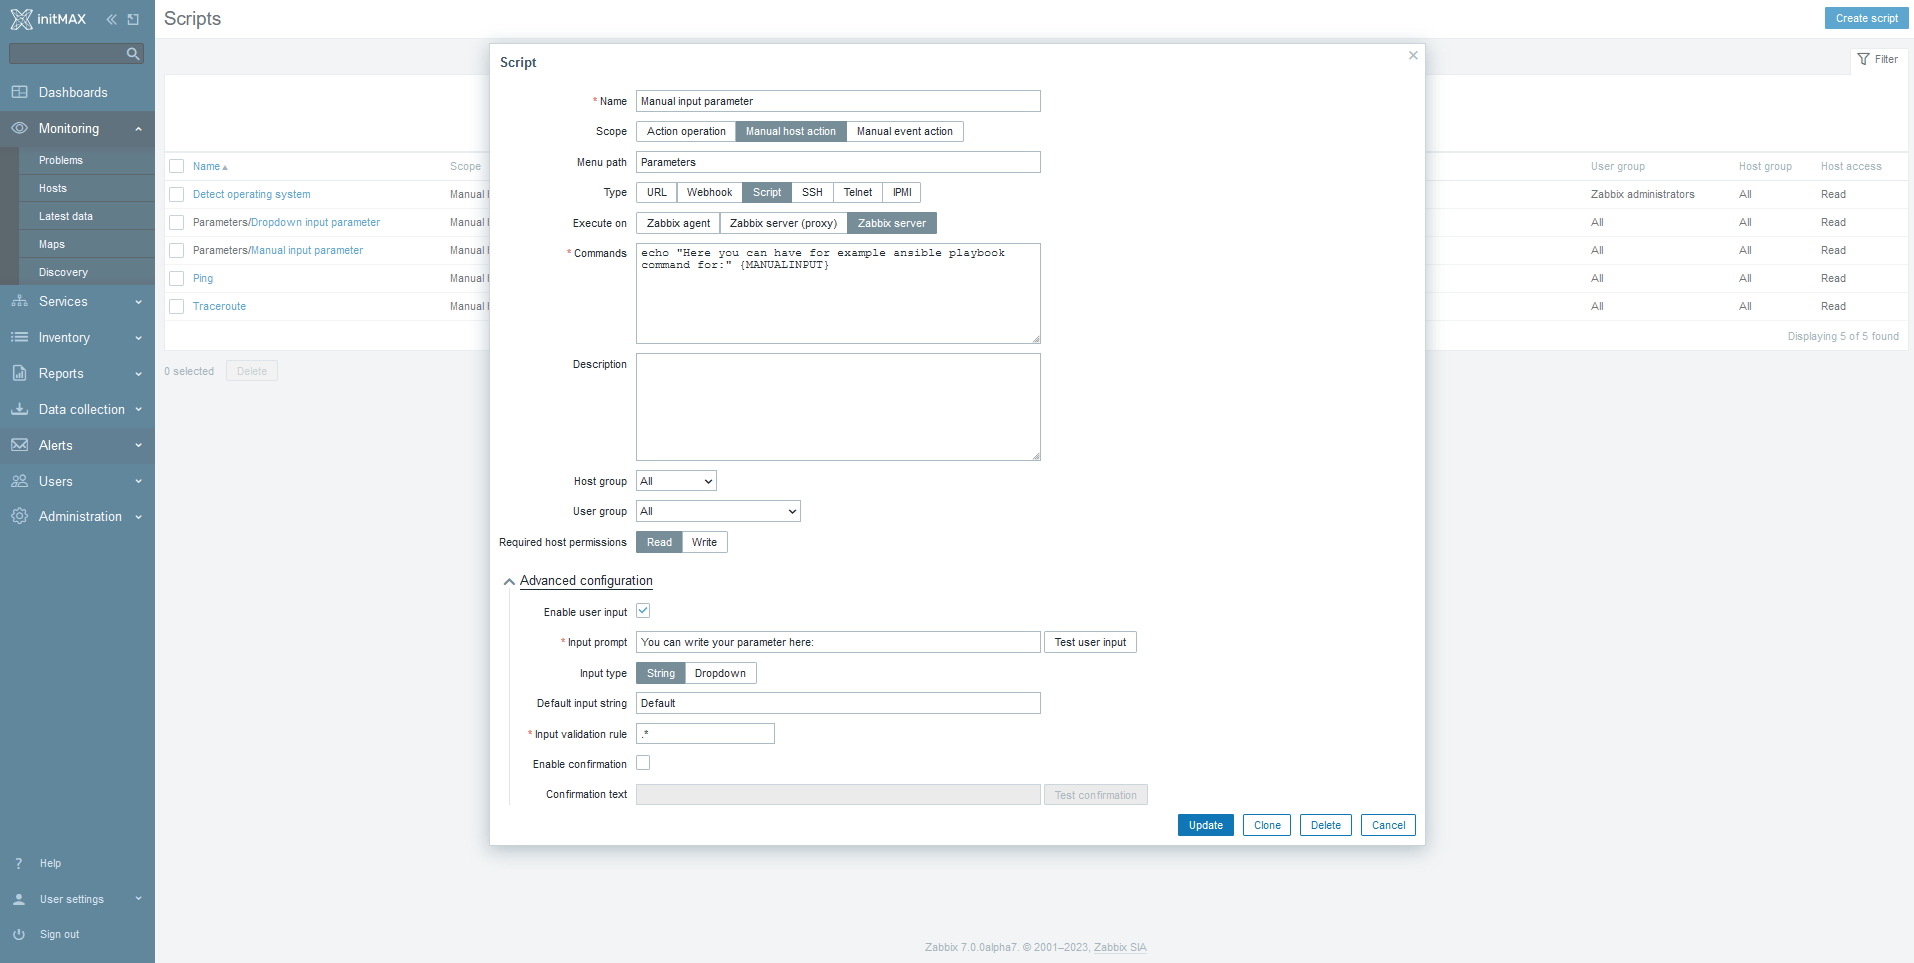
Another option now is also the possibility to set parameters for a specific script manually, and even with the possible (and rather necessary) validation of these forwarded values already at the primary script input, at the level of the Zabbix front-end.
You can see an example of the configuration options here:
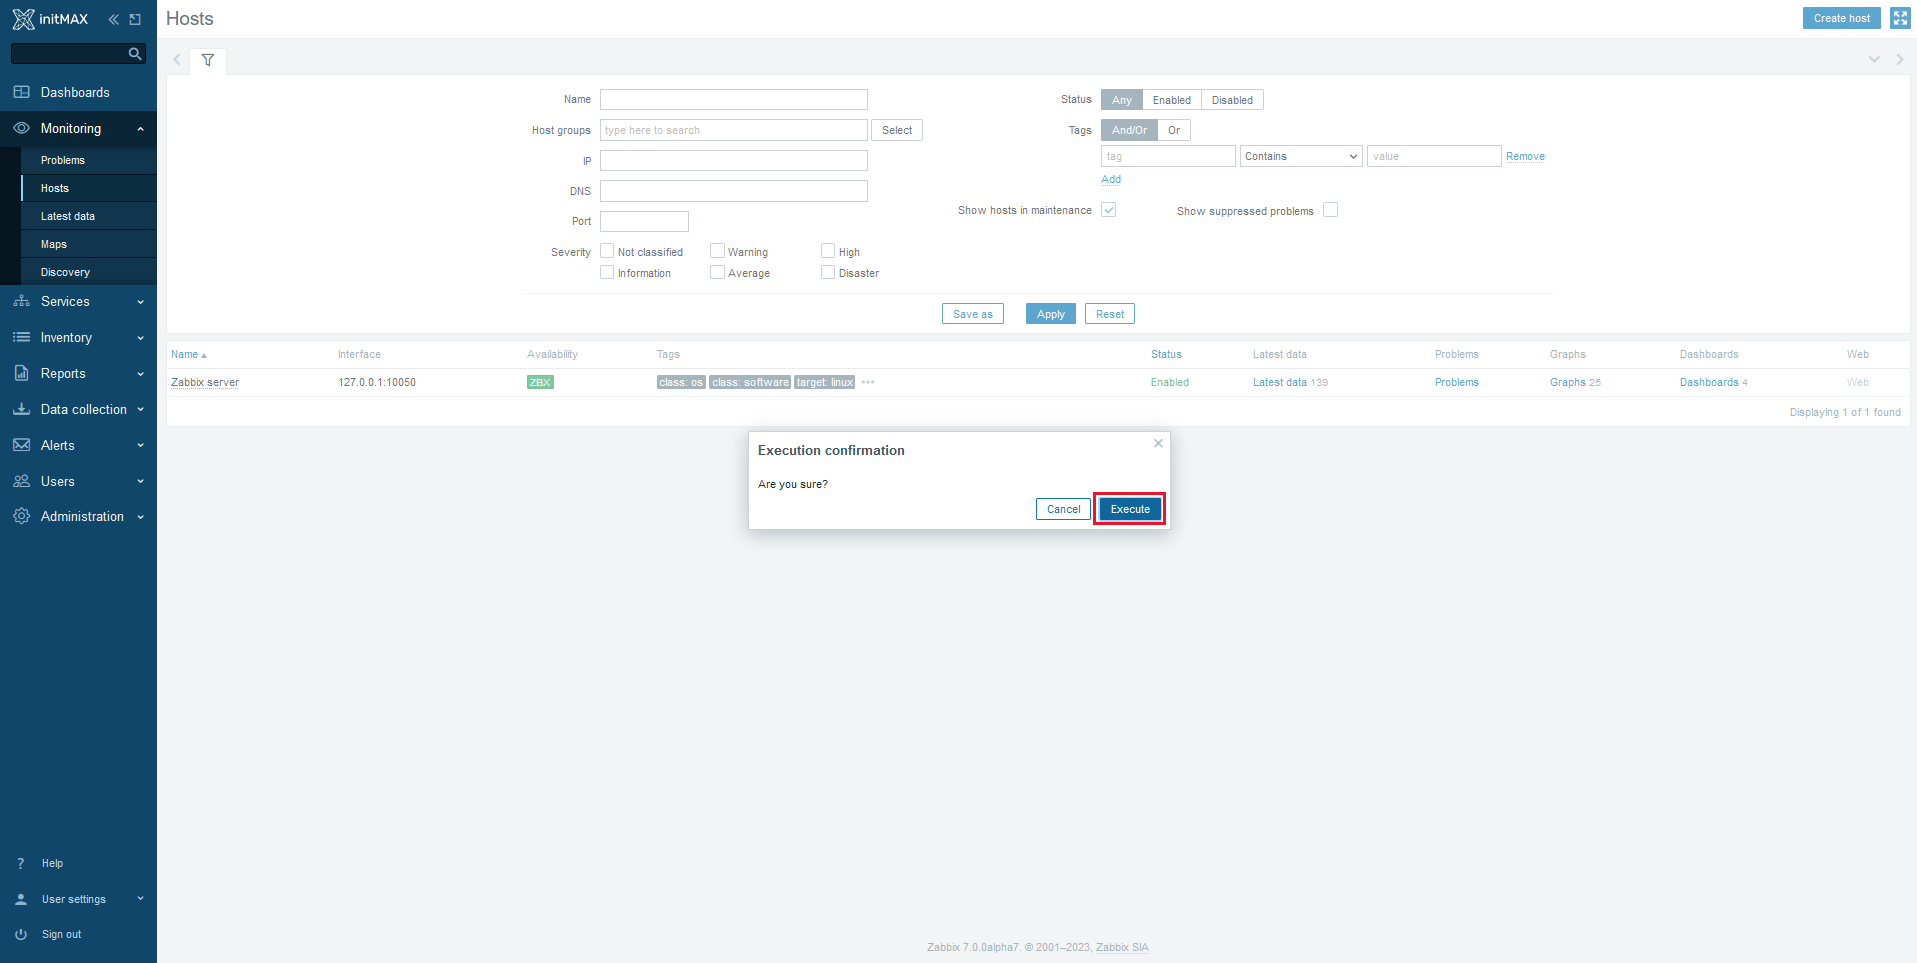
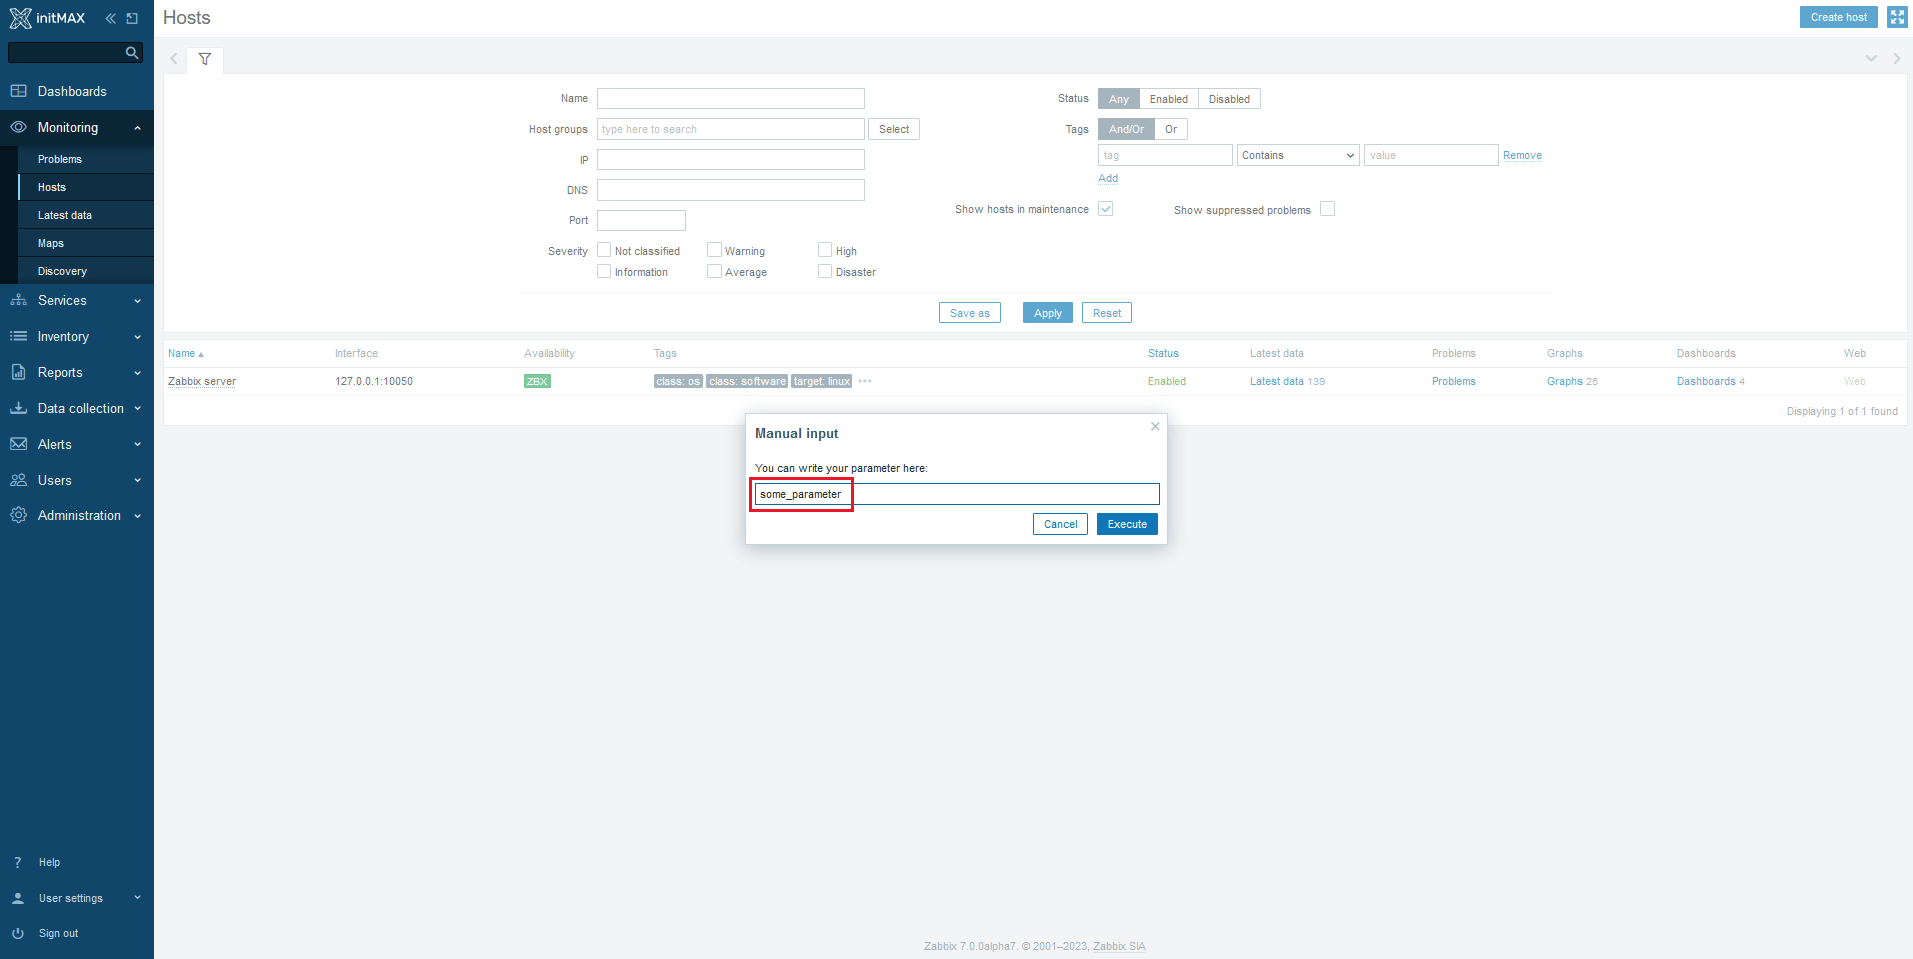
Running of this type of script with parameters then looks like this:

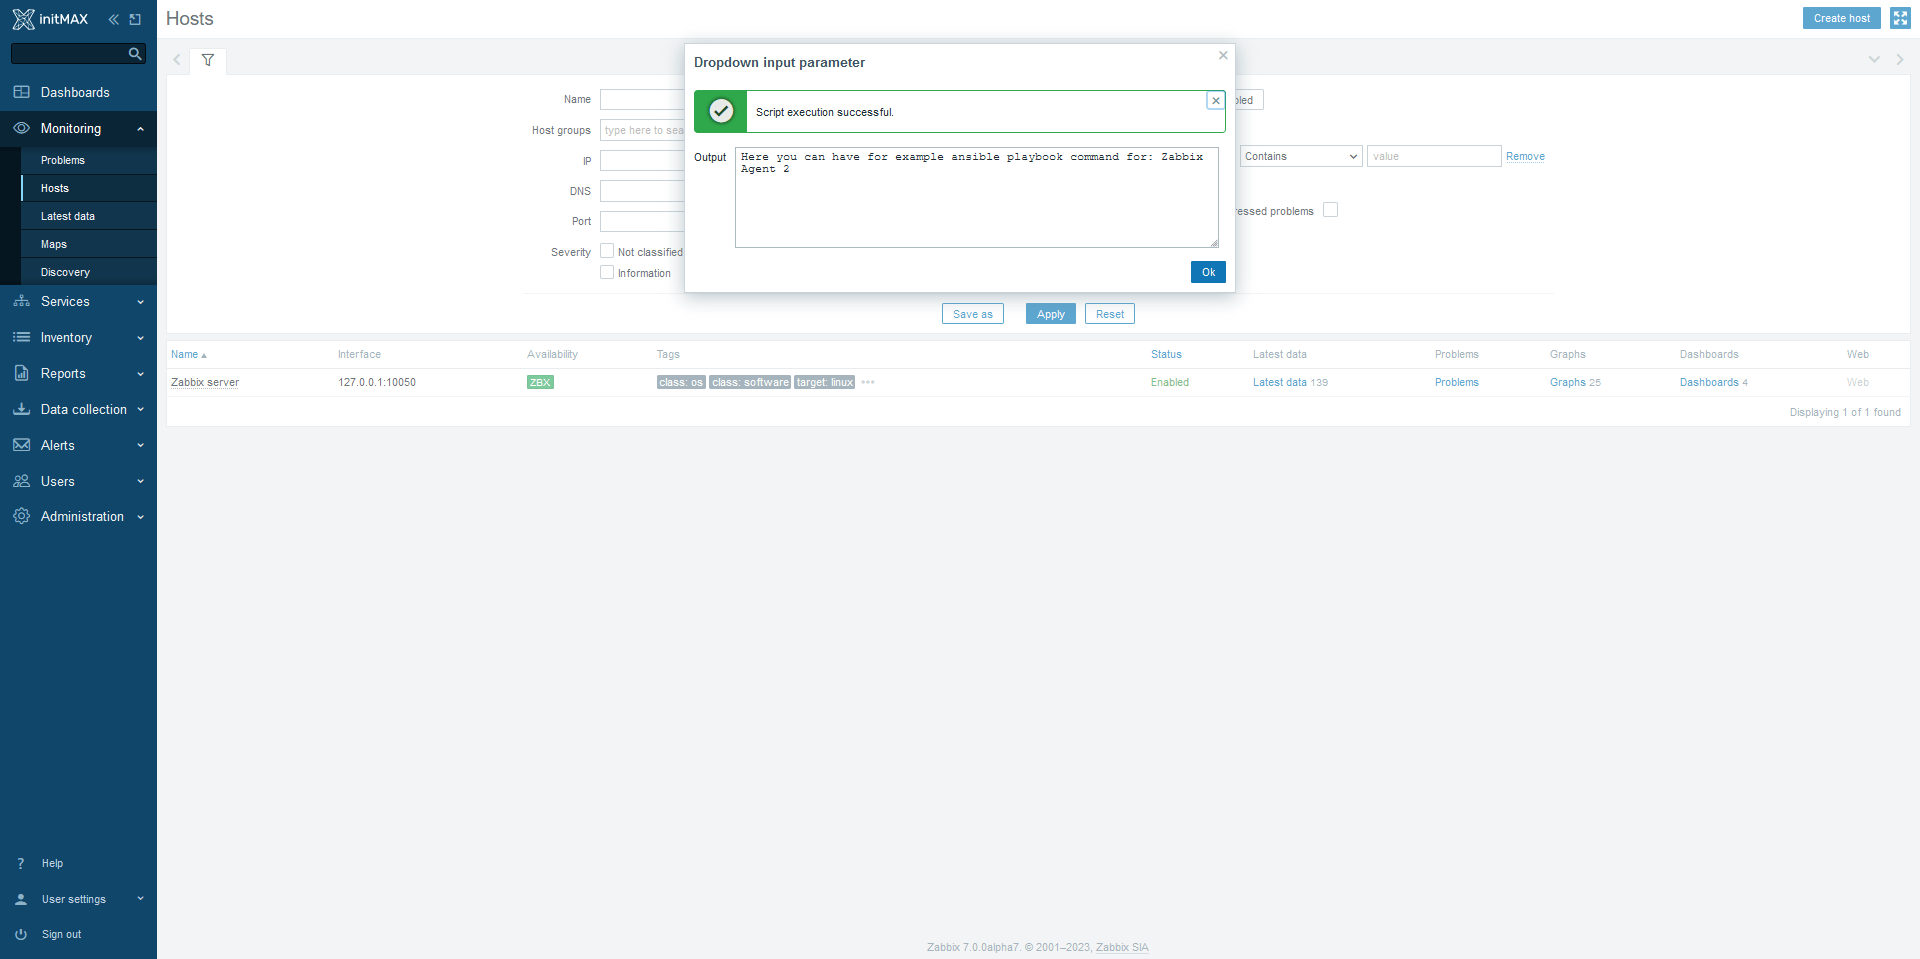
And here we can see the result:

Simplified cloning
In the new version of Zabbix 7.0 LTS, the process of cloning guests, templates or maps has been changed. Previously, there were two options for cloning, while now the option of “simple” cloning (Clone) disappeared and this function was be completely replaced by Full clone, with all of its functionality.
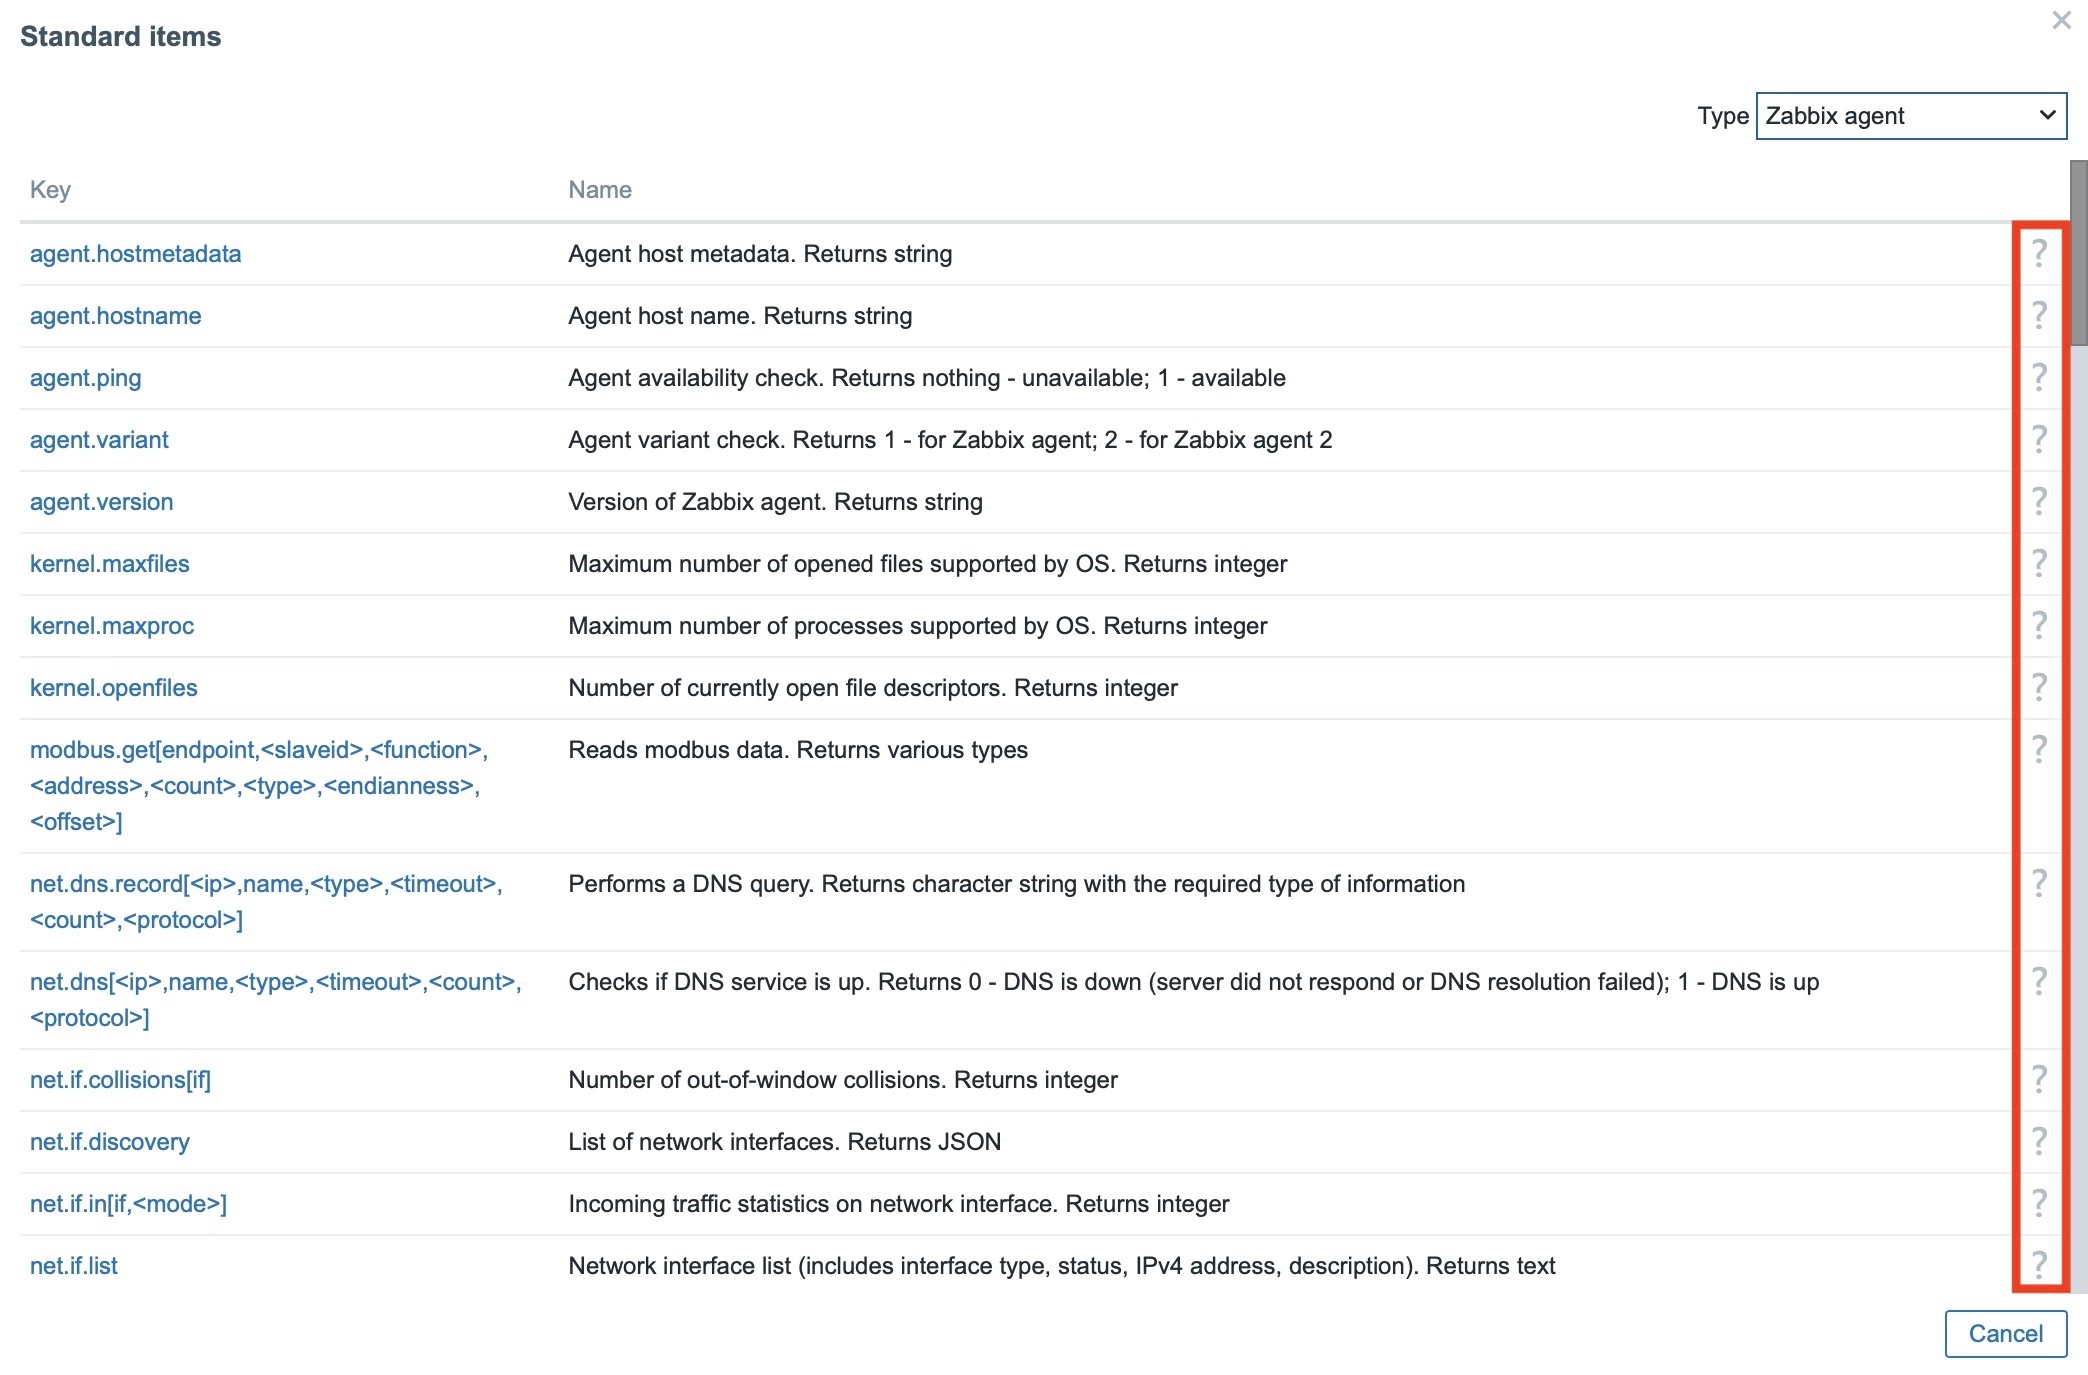
Documentation link for each standard item
Each standard item now has a direct link from the front-end to the documentation page.
Multi-page PDF reporting
Scheduled reports function now sends a report that contains multiple pages, even so for multi-paged dashboards .
Each page of the generated PDF corresponds to one page of the dashboard.
Previously, this feature was limited to the first page only, even for a multi-page dashboard.
Settings for timeout per item / proxy / server
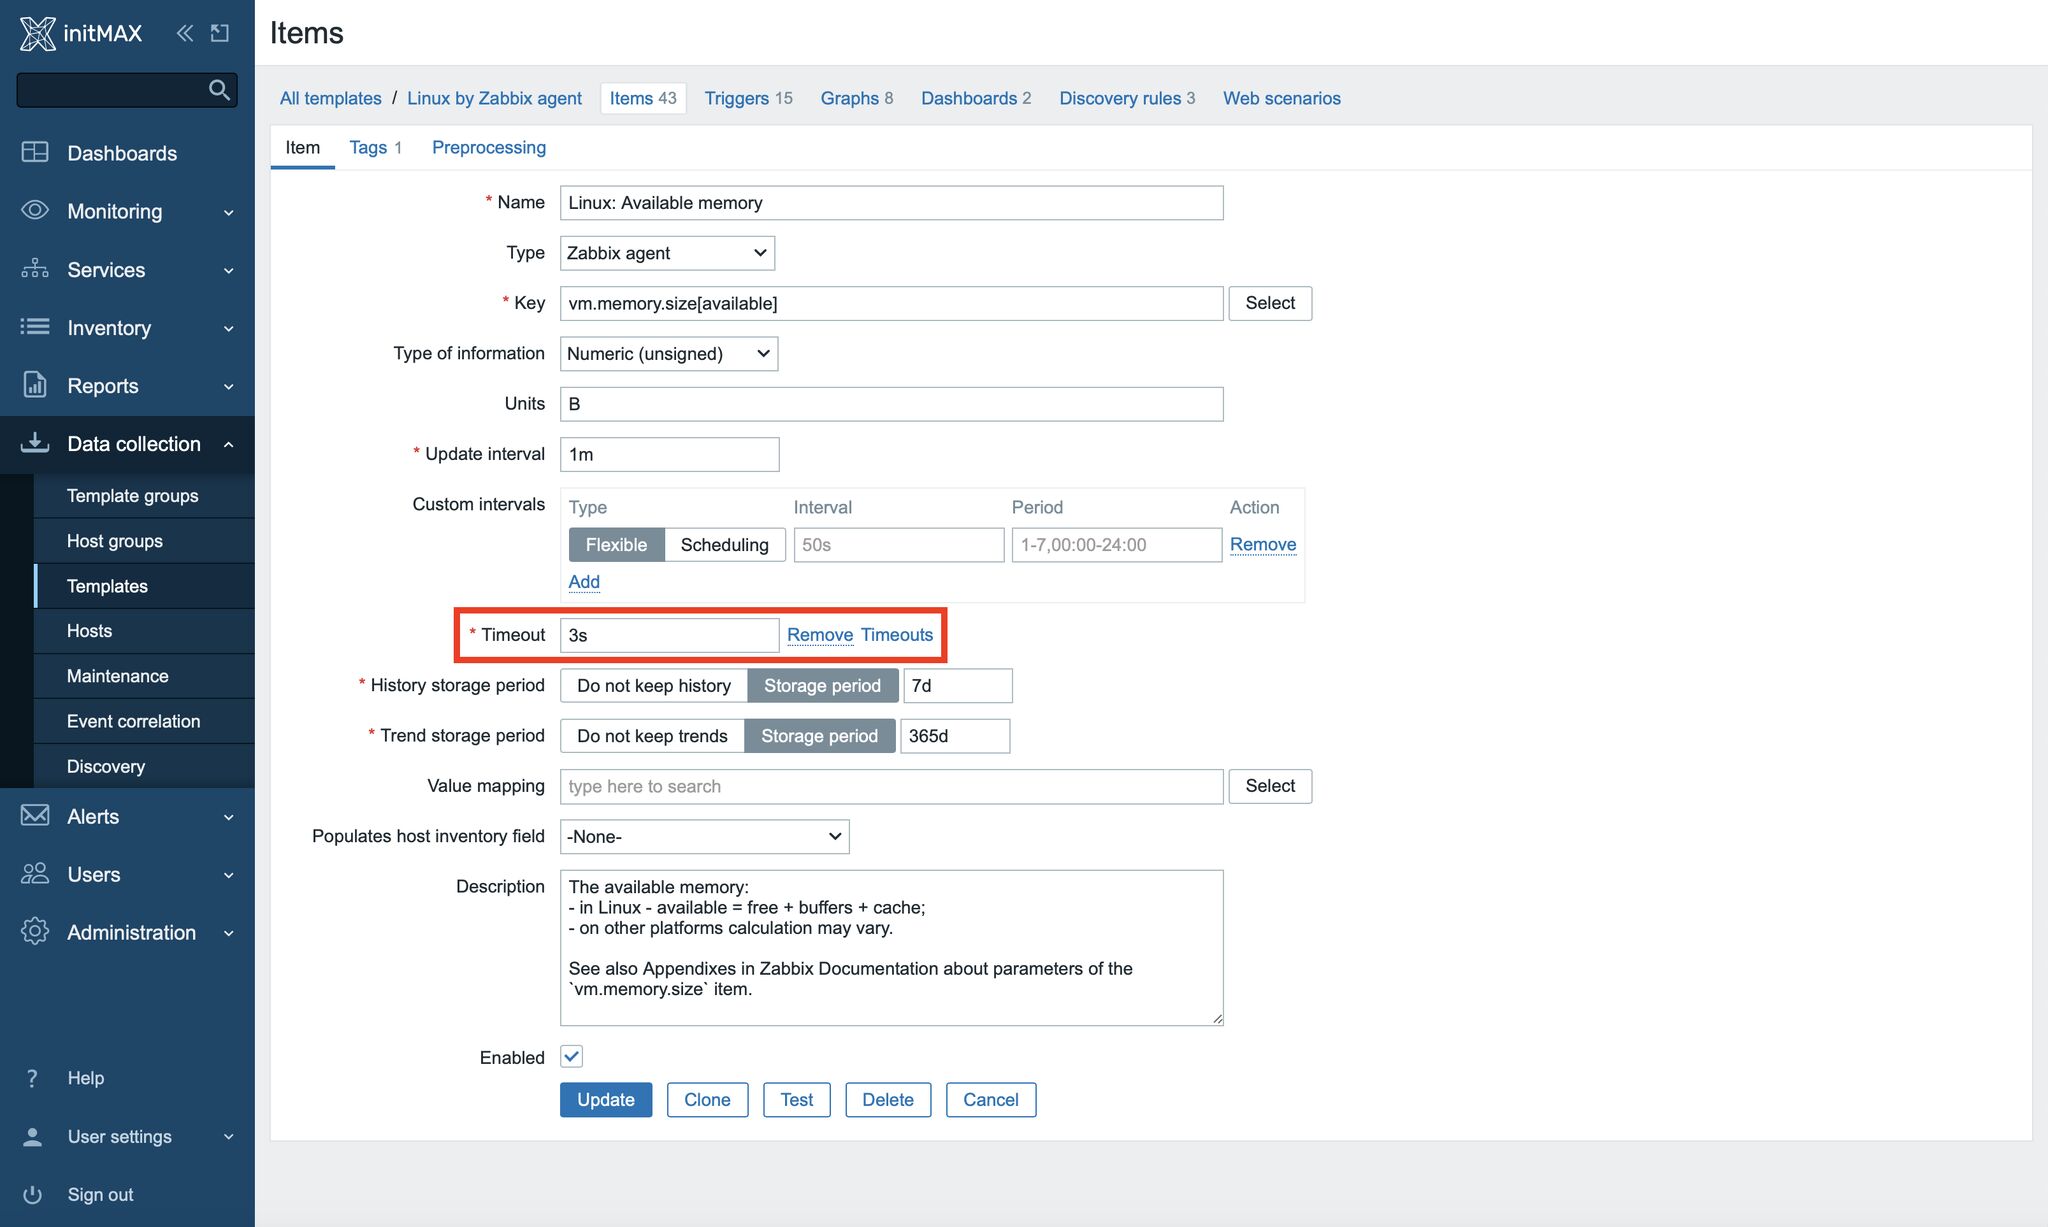
Another, revolutionary feature in Zabbix 7.0 LTS is now the possibility to set timeout for individual items.
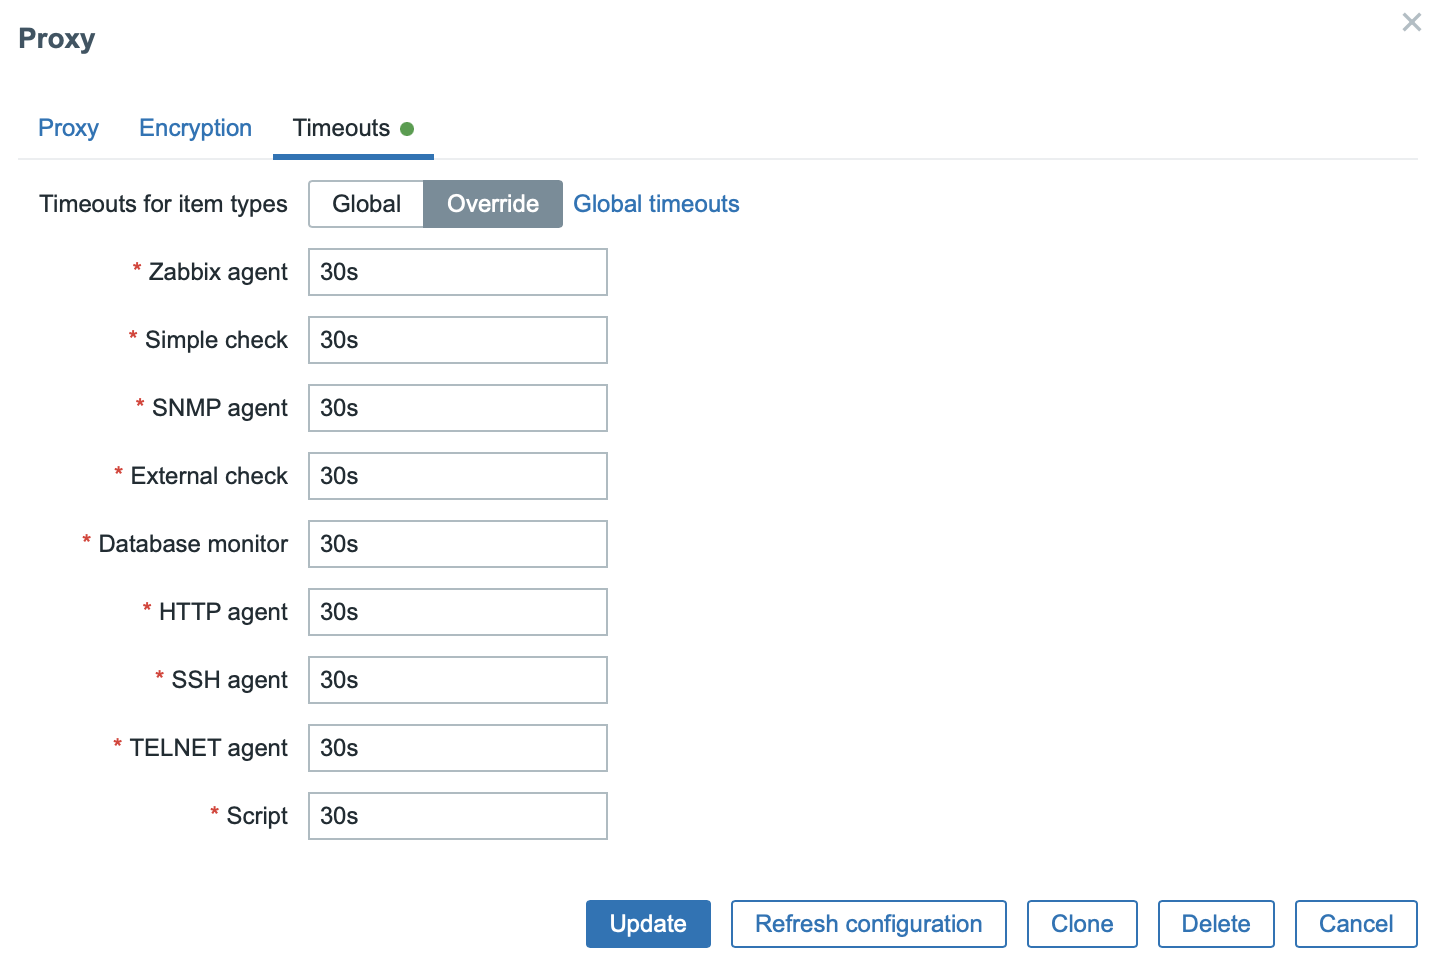
If necessary, it is possible to set custom settings for timeouts on the proxy itself in Administration -> Proxies in the Timeouts tab.
The time limit can be set in the range of 1 – 600s, directly in the front-end selectively for a specific item or globally with the possibility to overwrite these settings on item level.
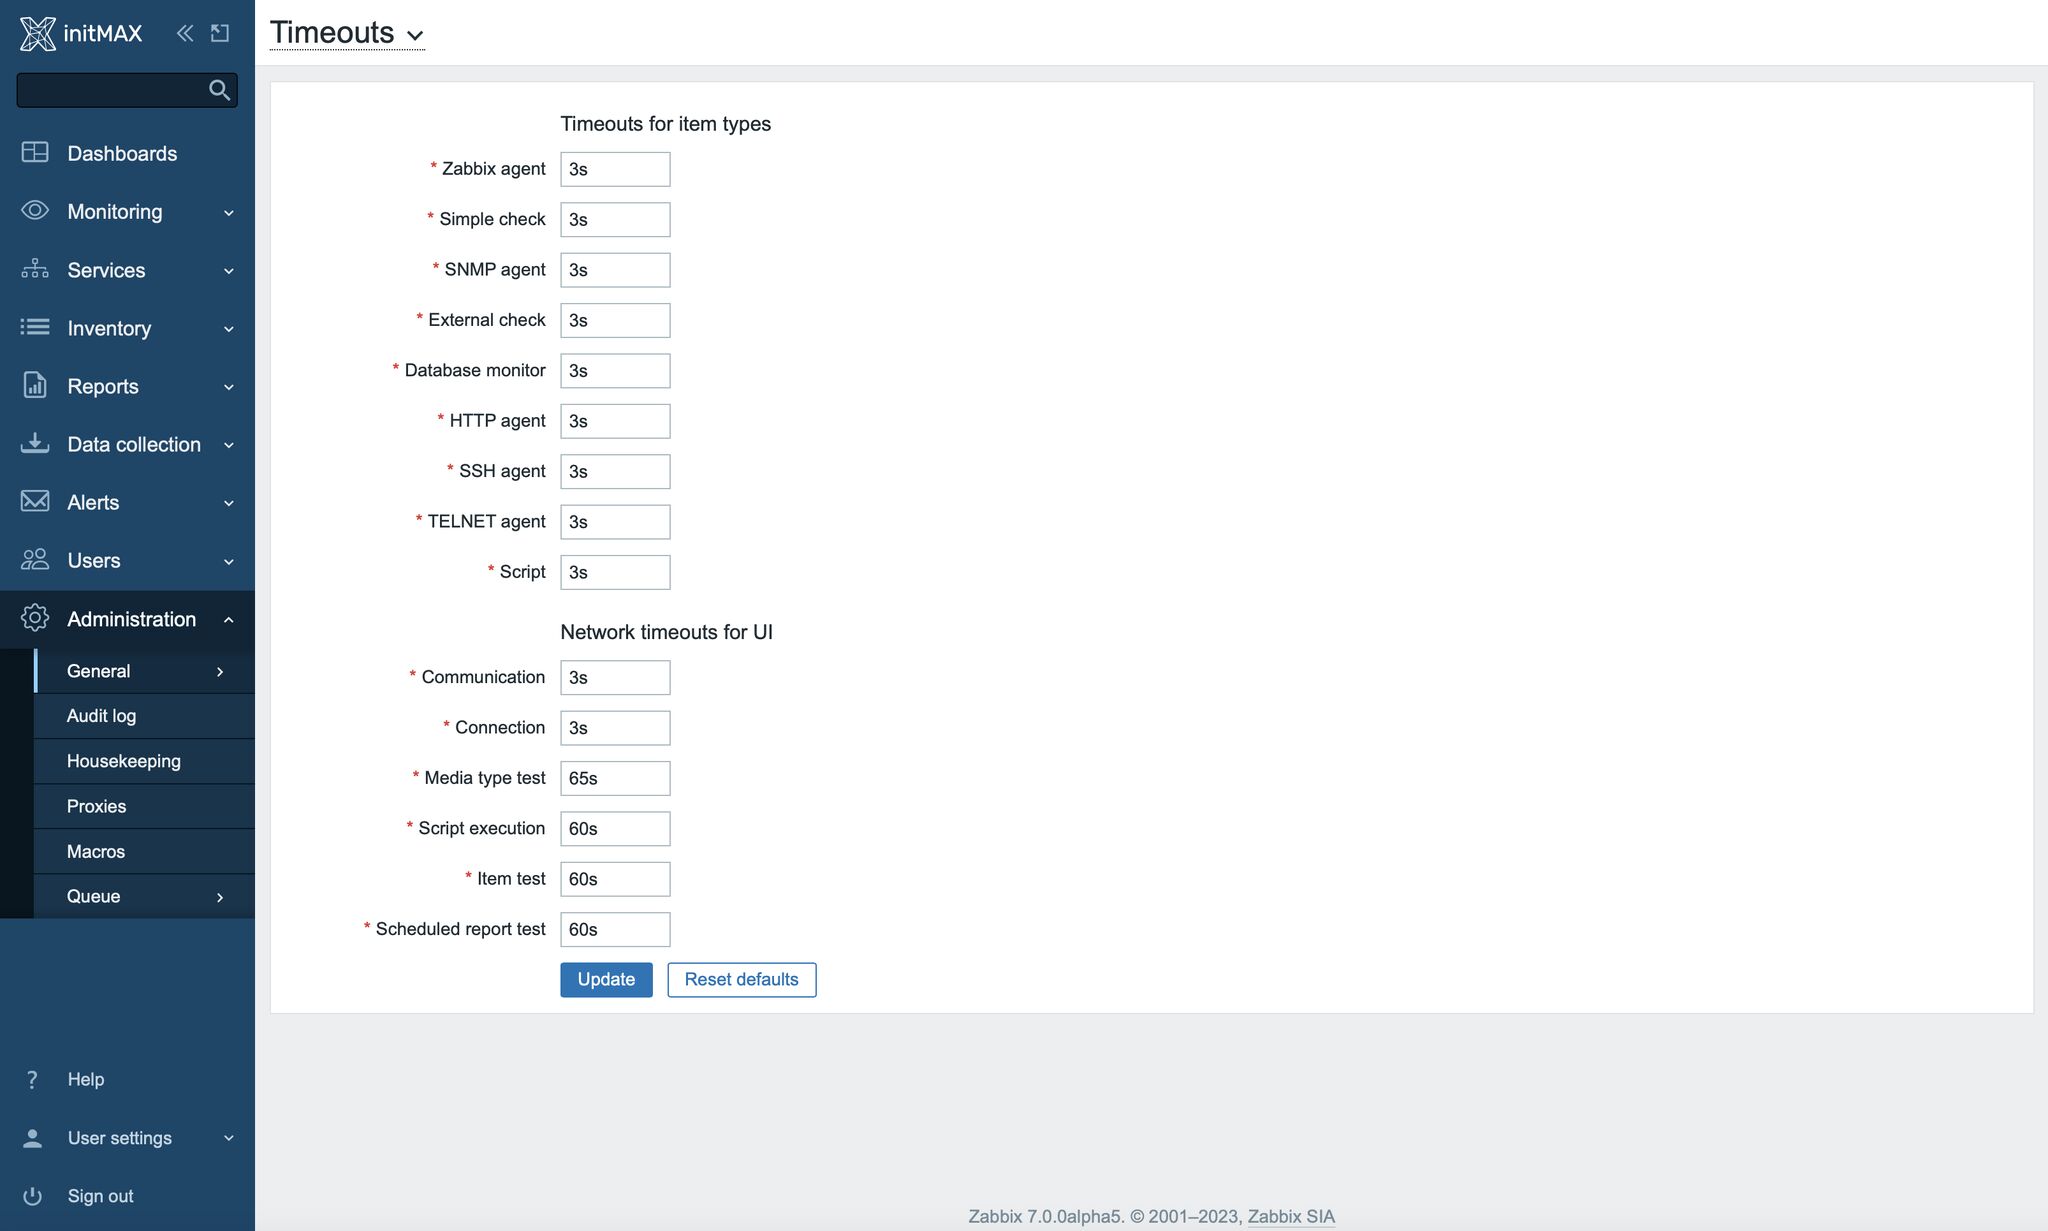
This option will greatly improve with the performance and optimization of the entire monitoring in relation to your IT infrastructure and its capabilities, and there will be no longer the need to recompile the Zabbix agent with manually set time limits, for example, if you use more complex SQL queries for database monitoring.
New functions
New functions have been added for use in trigger expressions and calculated items:
jsonpath()– returns the JSONPath resultxmlxpath()– returns the XML XPath result
Updated functions
Several functions have been updated:
- Aggregation functions now also support non-numeric types for calculation. This can be useful, for example, with the
countandcount_foreachfunctions. - The
countandcount_foreachaggregation functions support optional operator and pattern parameters that can be used to fine-tune item filtering and count only values that match the given criteria. - All foreach functions now no longer include unsupported items in the calculation.
- The
last_foreachfunction, previously set to ignore the time period argument, now accepts it as an optional parameter.
Sending data to Zabbix server using API
Previously, sending data to the Zabbix server was possible using the zabbix-sender tool, or by implementing a custom communication protocol based on JSON.
Newly, it is now also possible to send data to the Zabbix server via the HTTP protocol using the history.push API method.
Receiving sent data requires a configured Zabbix trapper item or an HTTP agent item (with trapping enabled).
Successful history.push API operations are also logged in the Reports -> Audit log section, and this method is also available in the API method list when configuring user permissions.
You can see an example of using this API method here:
{rn u0022jsonrpcu0022: u00222.0u0022,rn u0022methodu0022: u0022history.pushu0022,rn u0022paramsu0022: [rn {rn u0022itemidu0022: 10600,rn u0022valueu0022: 0.5,rn u0022clocku0022: 1690891294,rn u0022nsu0022: 45440940rn },rn],rn u0022idu0022: 1rn}Auditlog converted to hypertable in TimescaleDB
On new installations, the auditlog table has been converted to a hypertable in TimescaleDB to take advantage of better performance as well as automatic partitioning on time (7 days by default).
To successfully update existing installations, you must re-run the timescaledb.sql script located in the database/postgresql path before starting the Zabbix server.
If the Zabbix server is started for the first time without running this script first, then a warning message will pop up.
Increased character limit
The character limit for all URL fields is now 2048 characters, and the character limit for all User/Username and Password authentication fields is increased to 255 characters.
Support for the old numeric type has been dropped
The old style of decimal numbers, previously marked as deprecated, are no longer supported because numeric values of extended range are now used (Float64).
Oracle RDBMS deprecated
The support for Oracle as a back-end database has been deprecated and is expected to be completely removed in future versions.
Removed support for TimescaleDB v1
Support for the TimescaleDB v1 database has been marked as deprecated and Zabbix version 7.0 LTS no longer supports it.
New templates
- Acronis Cyber Protect Cloud
- AWS Cost Explorer
- AWS ECS
- AWS ELB Application Load Balancer
- AWS ELB Network Load Balancer
- Azure Cost Management
- Check Point Next Generation Firewall
- Cisco Meraki
- Cisco SD-WAN
- FortiGate
- HashiCorp Nomad
- HPE iLO
- MSSQL by Zabbix Agent 2
- MantisBT
- NextCloud
- OpenStack Nova
- Oracle Cloud Infrastructure
- PostgreSQL by ODBC
- Website by Browser
- YugabyteDB
Zabbix download and other useful links
- Zabbix 7.0 LTS can be downloaded here: www.zabbix.com/download
- Here you can find complete documentation to the new version: https://www.zabbix.com/documentation/7.0/en/manual/introduction/whatsnew700
As official partners and big fans of the Zabbix platform, we are able to provide you with services from all areas of Zabbix monitoring at the highest level. If you would be interested in a live demonstration of Zabbix installations at our customers, we will be happy to show you Zabbix in practice.


Give us a Like, share us, or follow us 😍
So you don’t miss anything: