In this guide, we will show you how to install and configure Zabbix so that it is able to use the potential of the new “Browser” item.
The Browser item in Zabbix allows you to retrieve data from web pages using a browser. It is a new type of item that uses a web browser to interact with web pages, allowing it to monitor and collect data that is only available through web interfaces. This item type is useful for monitoring states that cannot be directly monitored via standard protocols or APIs. There is also the possibility to directly obtain a screenshot from the page you are monitoring.
Browser items collect data by running user-defined JavaScript code and retrieving data over HTTP/HTTPS. This item can simulate actions in the browser such as clicking, typing, navigating through websites and other user interactions with websites or web applications.
In addition to the script, an optional list of parameters (name, value pairs) and a time limit can be specified. More detailed information can be found on the Zabbix documentation pages:
Preparing the environment
We will install Podman, in which we will subsequently run a Docker container with Selenium.
This is a much cleaner way than installing a full graphical environment, including Google Chrome and then Selenium WebDriver, on the Zabbix Server itself.
We would like to point out that the container may require quite a lot of RAM (>2GB), and this needs to be taken into account in advance.
First, just to be sure, update the OS, which in this case is Rocky Linux 9:
dnf -y updateInstall Podman and the necessary dependencies:
dnf -y install podman podman-composeThen download the official Selenium script for docker-compose and save it with the name that podman-compose recognizes by default.
This “full” compose recipe contains all three of the most used browsers, which is certainly not needed for basic testing.
For the purposes of our example, we will leave it like that for now.
wget https://raw.githubusercontent.com/SeleniumHQ/docker-selenium/trunk/docker-compose-v3-full-grid.yml -O docker-compose.ymlWith this compose file, start the container using podman-compose:
podman-compose up -dMake sure that the container is running:
podman psSelenium server should now be available at http://localhost:4444, as we defined this port when starting up the container.
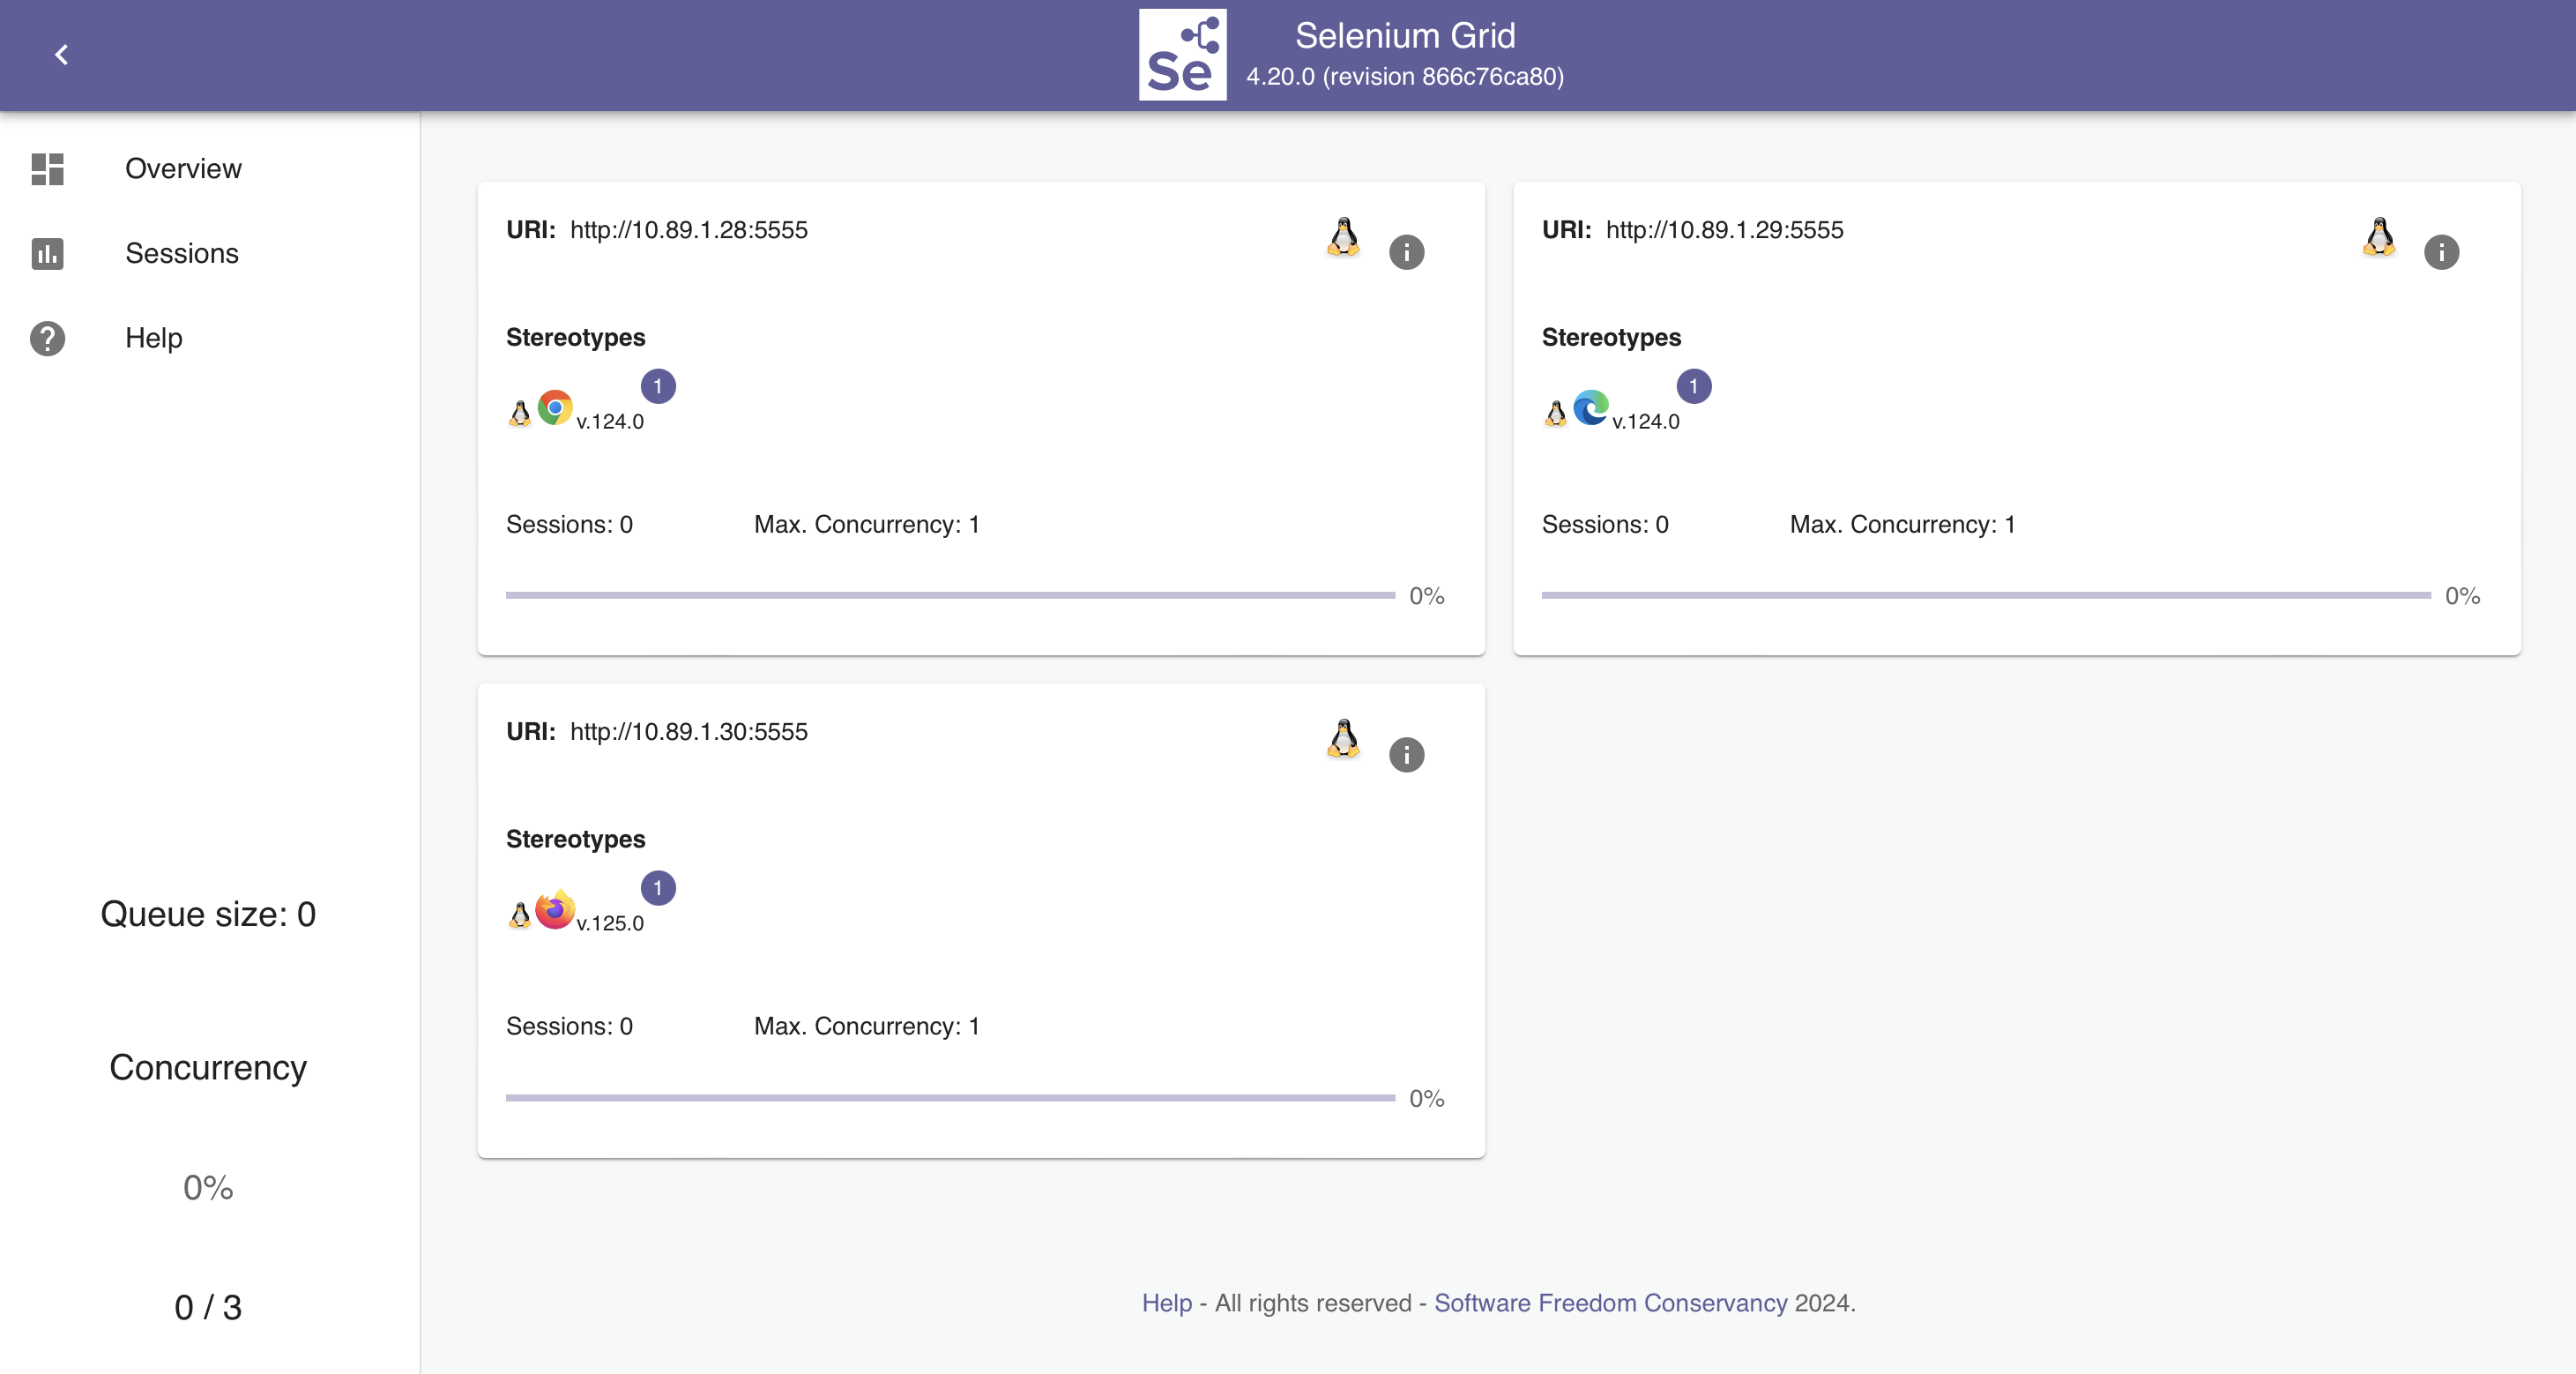
Hint: You can also check Selenium directly using the Selenium server URL; in our example it is http://localhost:4444. Once loaded, the Selenium Grid page will appear where you can see the status and available browsers or concurrency settings. You can also set up monitoring of the user’s browser via VNC here. But first, you will need to set a password for it. By default, the password is set to “secret”, so we strongly recommend changing this.
Zabbix server settings
For the functionality of this entire solution, you need to enable Selenium WebDriver at the Zabbix Server level.
So open the Zabbix server configuration file:
nano /etc/zabbix/zabbix_server.confAnd here, edit the WebDriverURL configuration directive to match your chosen address and port of the running container. In our case it is http://localhost:4444.
### Option: WebDriverURL
#       WebDriver interface HTTP[S] URL. For example http://localhost:4444 used with Selenium WebDriver standalone server.
#
# Mandatory: no
# Default:
# WebDriverURL=
WebDriverURL=http://localhost:4444
Next, enable Browser Pollers, i.e. the processes that collect the values for the item Browser.
Do this by adequately setting the StartBrowserPollers directive, which for the purposes of our example is sufficient to leave at the value 5.
### Option: StartBrowserPollers
#       Number of pre-forked instances of browser item pollers.
#
# Mandatory: no
# Range: 0-1000
# Default:
# StartBrowserPollers=1
StartBrowserPollers=5
Save the modified configuration file and restart the Zabbix Server to apply the changes:
systemctl restart zabbix-serverZabbix frontend settings
To quickly test the functionality, we have a sample template provided by Zabbix, which you can find here. Download the template and import it into your Zabbix.
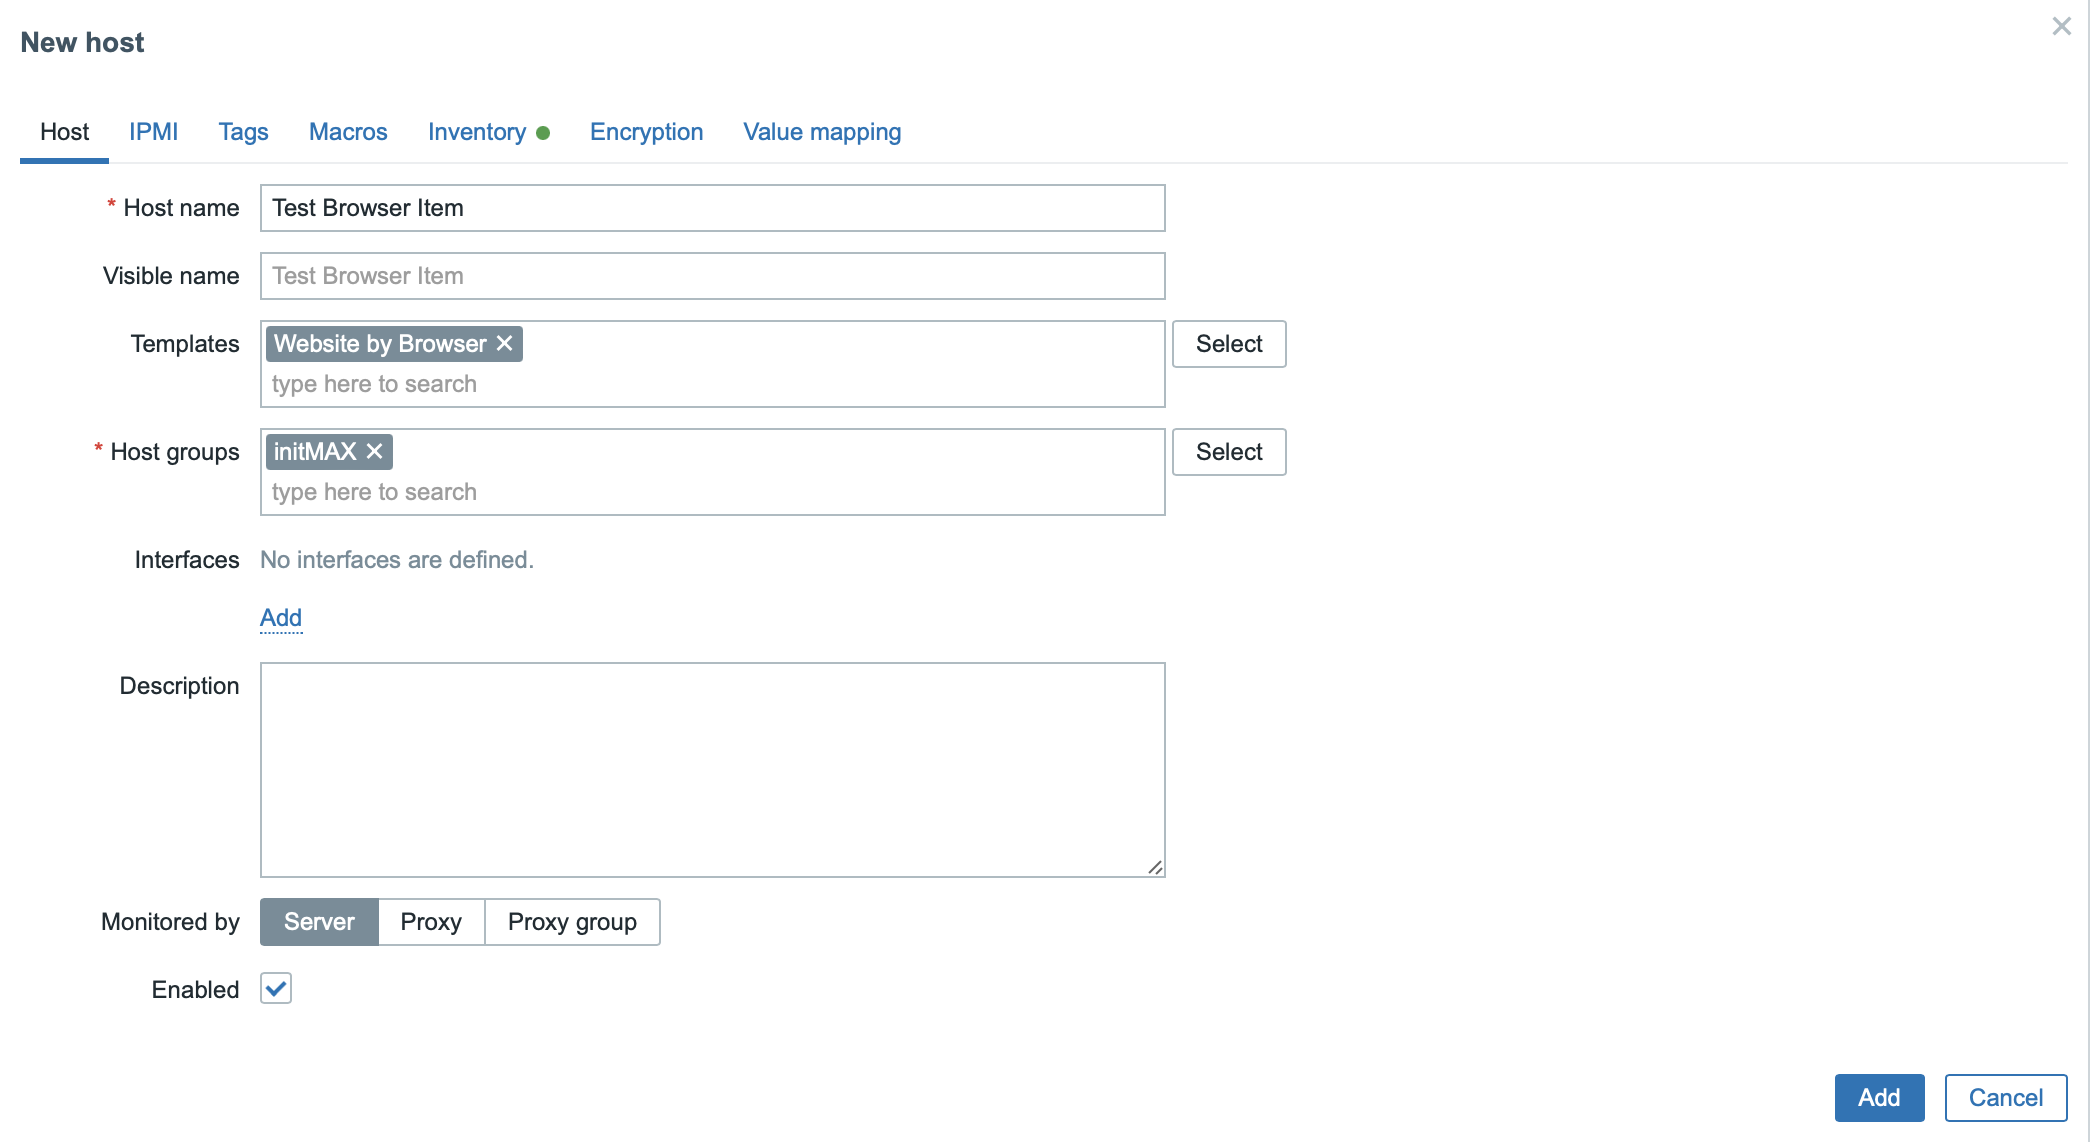
Then create a test host and assign this template to it:
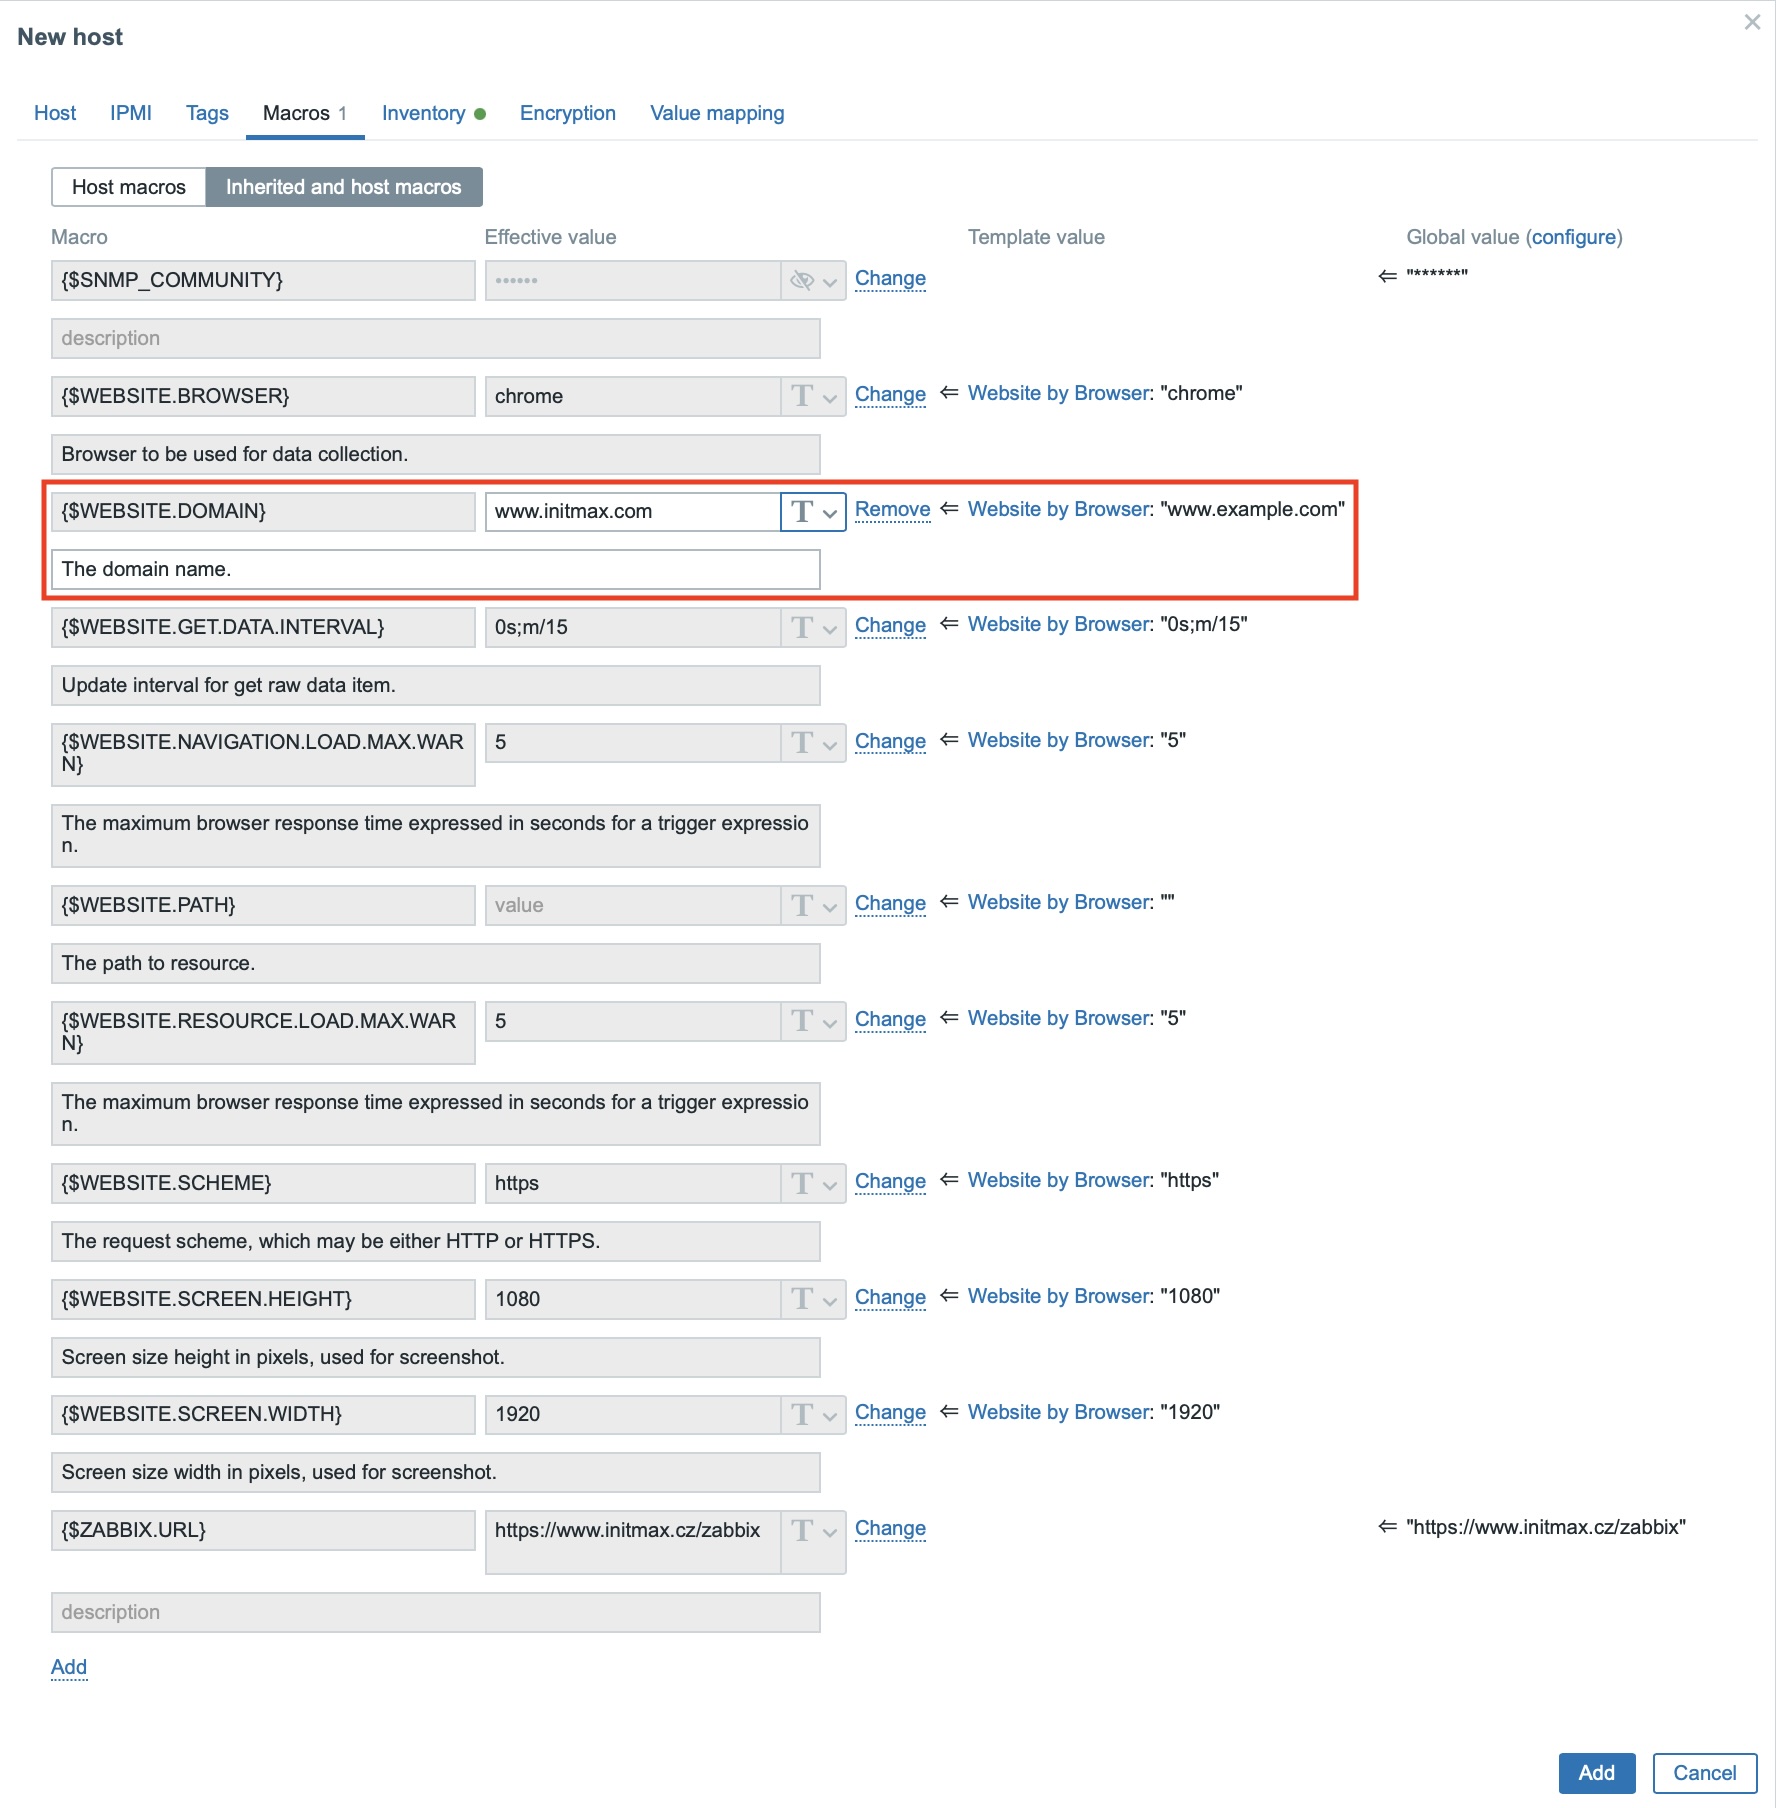
For proper functionality, you must not forget to change the macro settings inside the template itself. The most important will of course be the target URL we want to monitor, i.e. the {$WEBSITE.DOMAIN} macro (highlighted in the image below). In the macros of the template, you can also find many other useful parameters. Such as the choice of browser, check intervals, or screen resolution.
With this setting, save the host and you can move to the data preview. The speed of loading the current data depends on the set interval, which is primarily controlled by the template macro. Fortunately, you can use the Execute now button for the immediate launch, namely on the item Website by Browser: Website {$WEBSITE.DOMAIN} Get data.
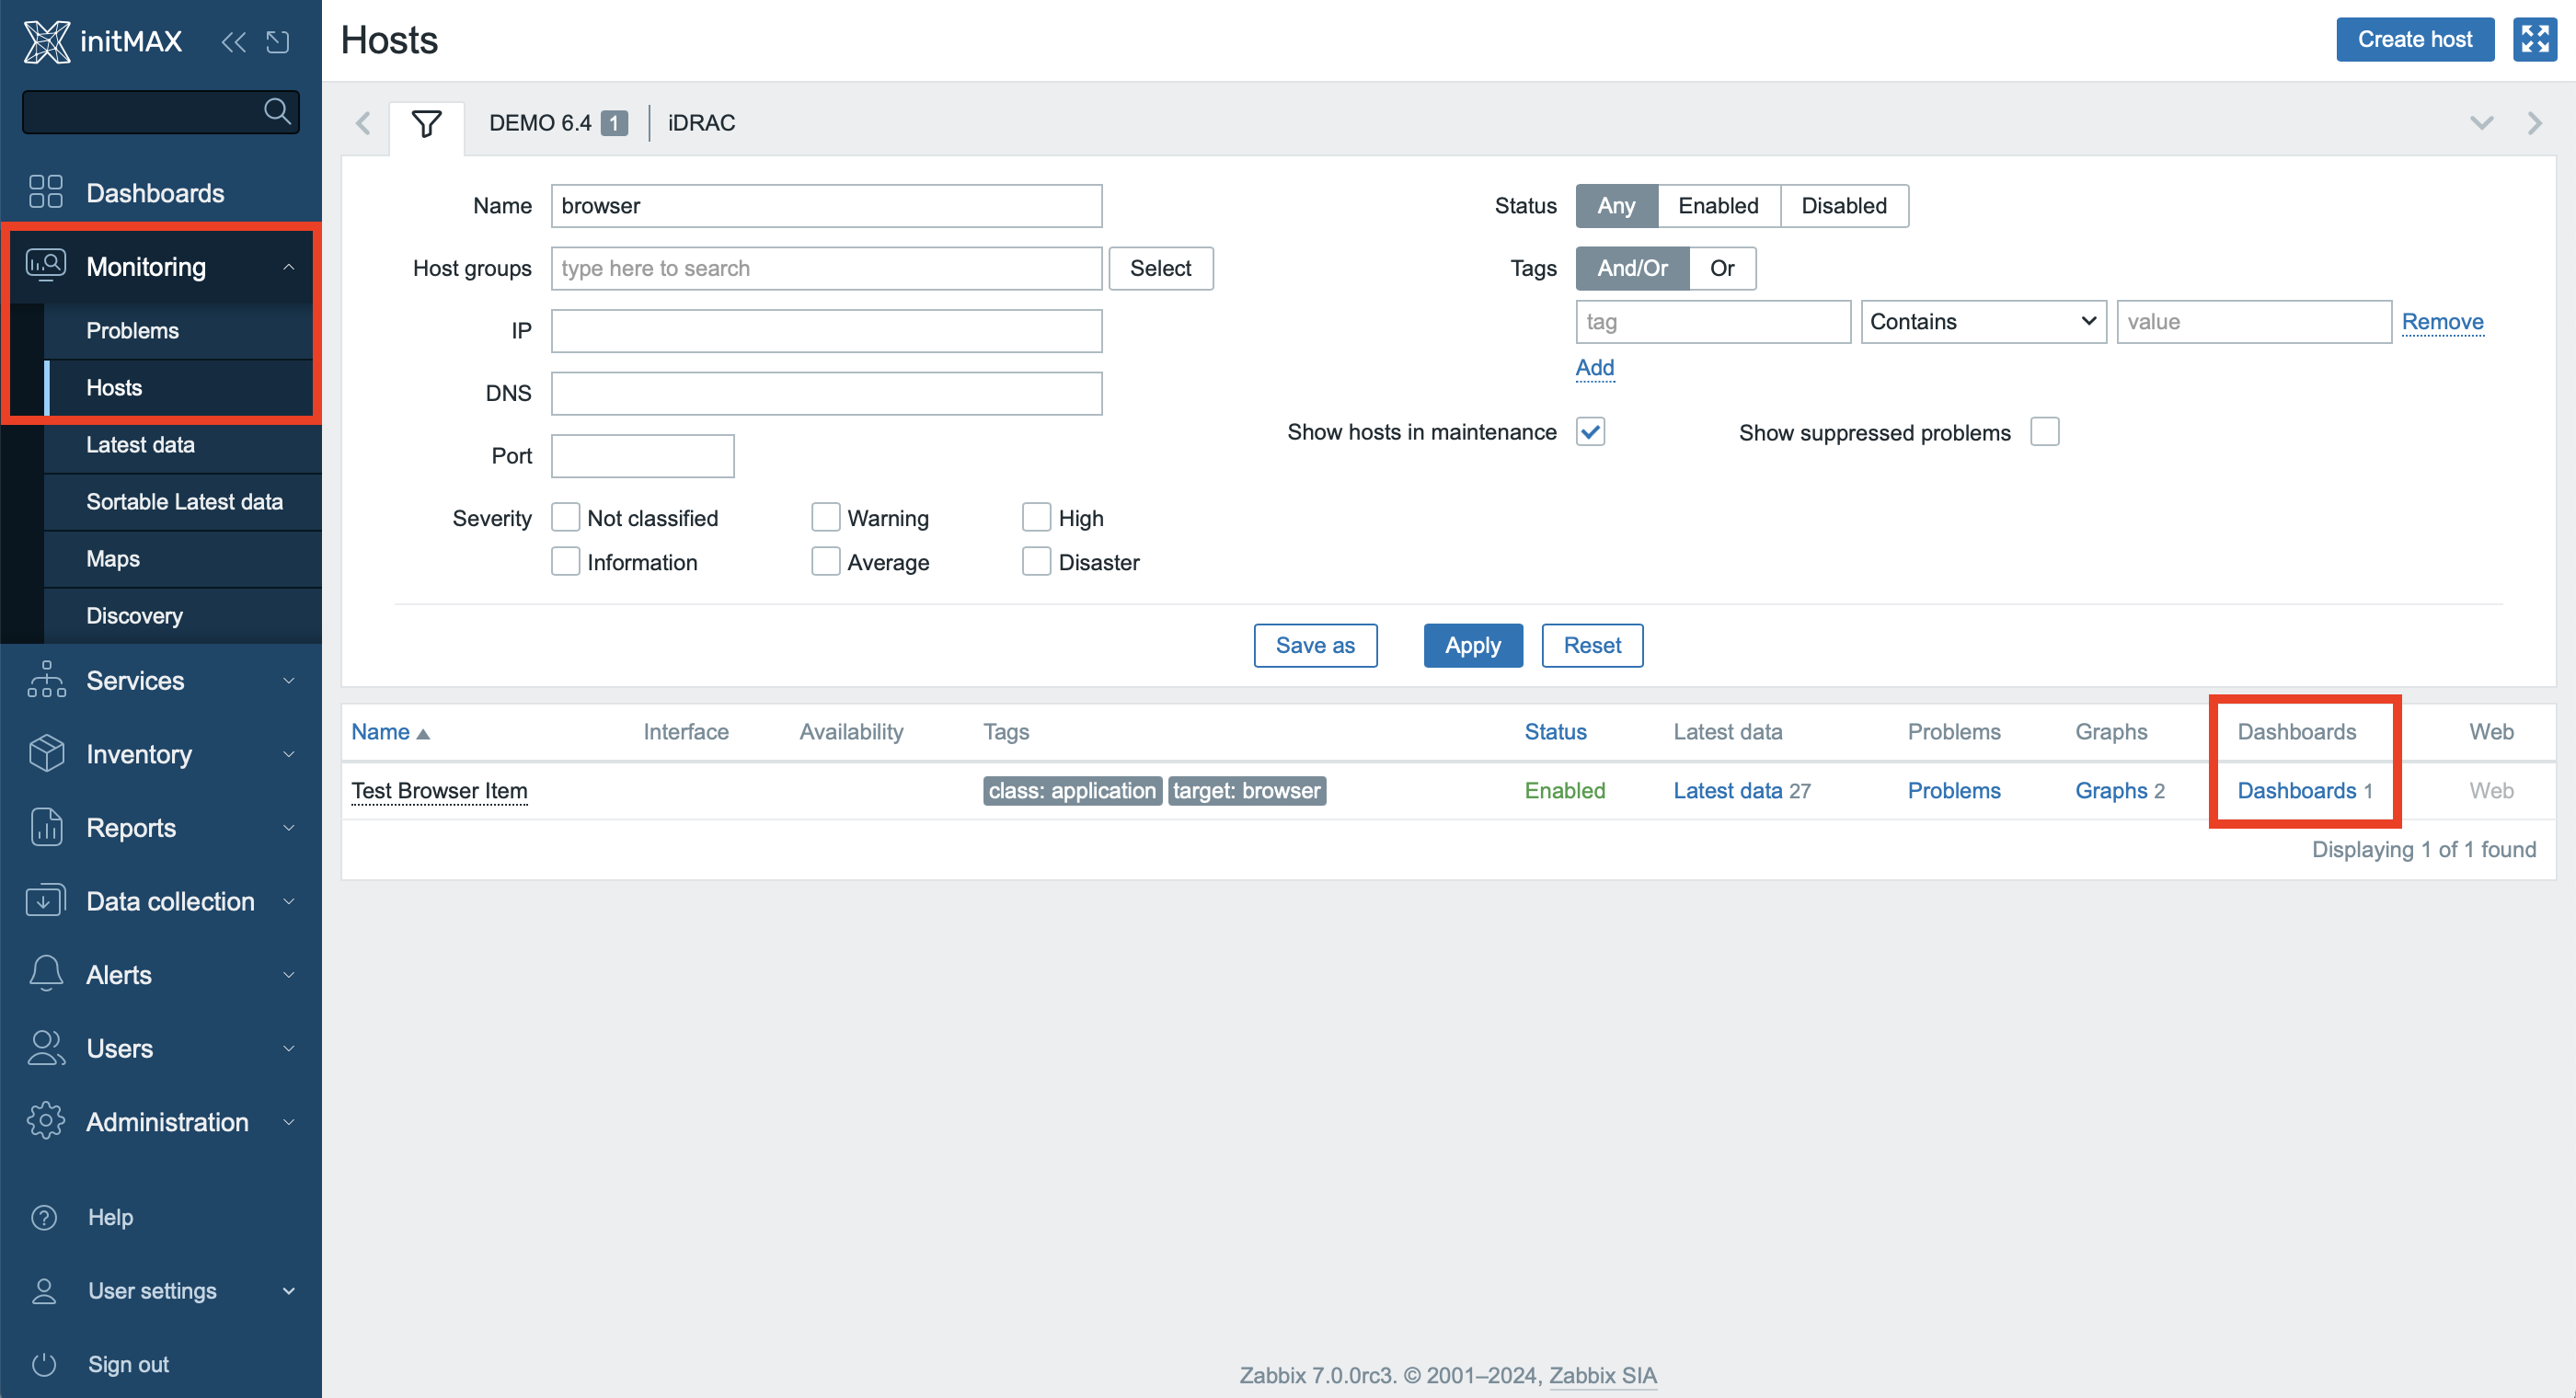
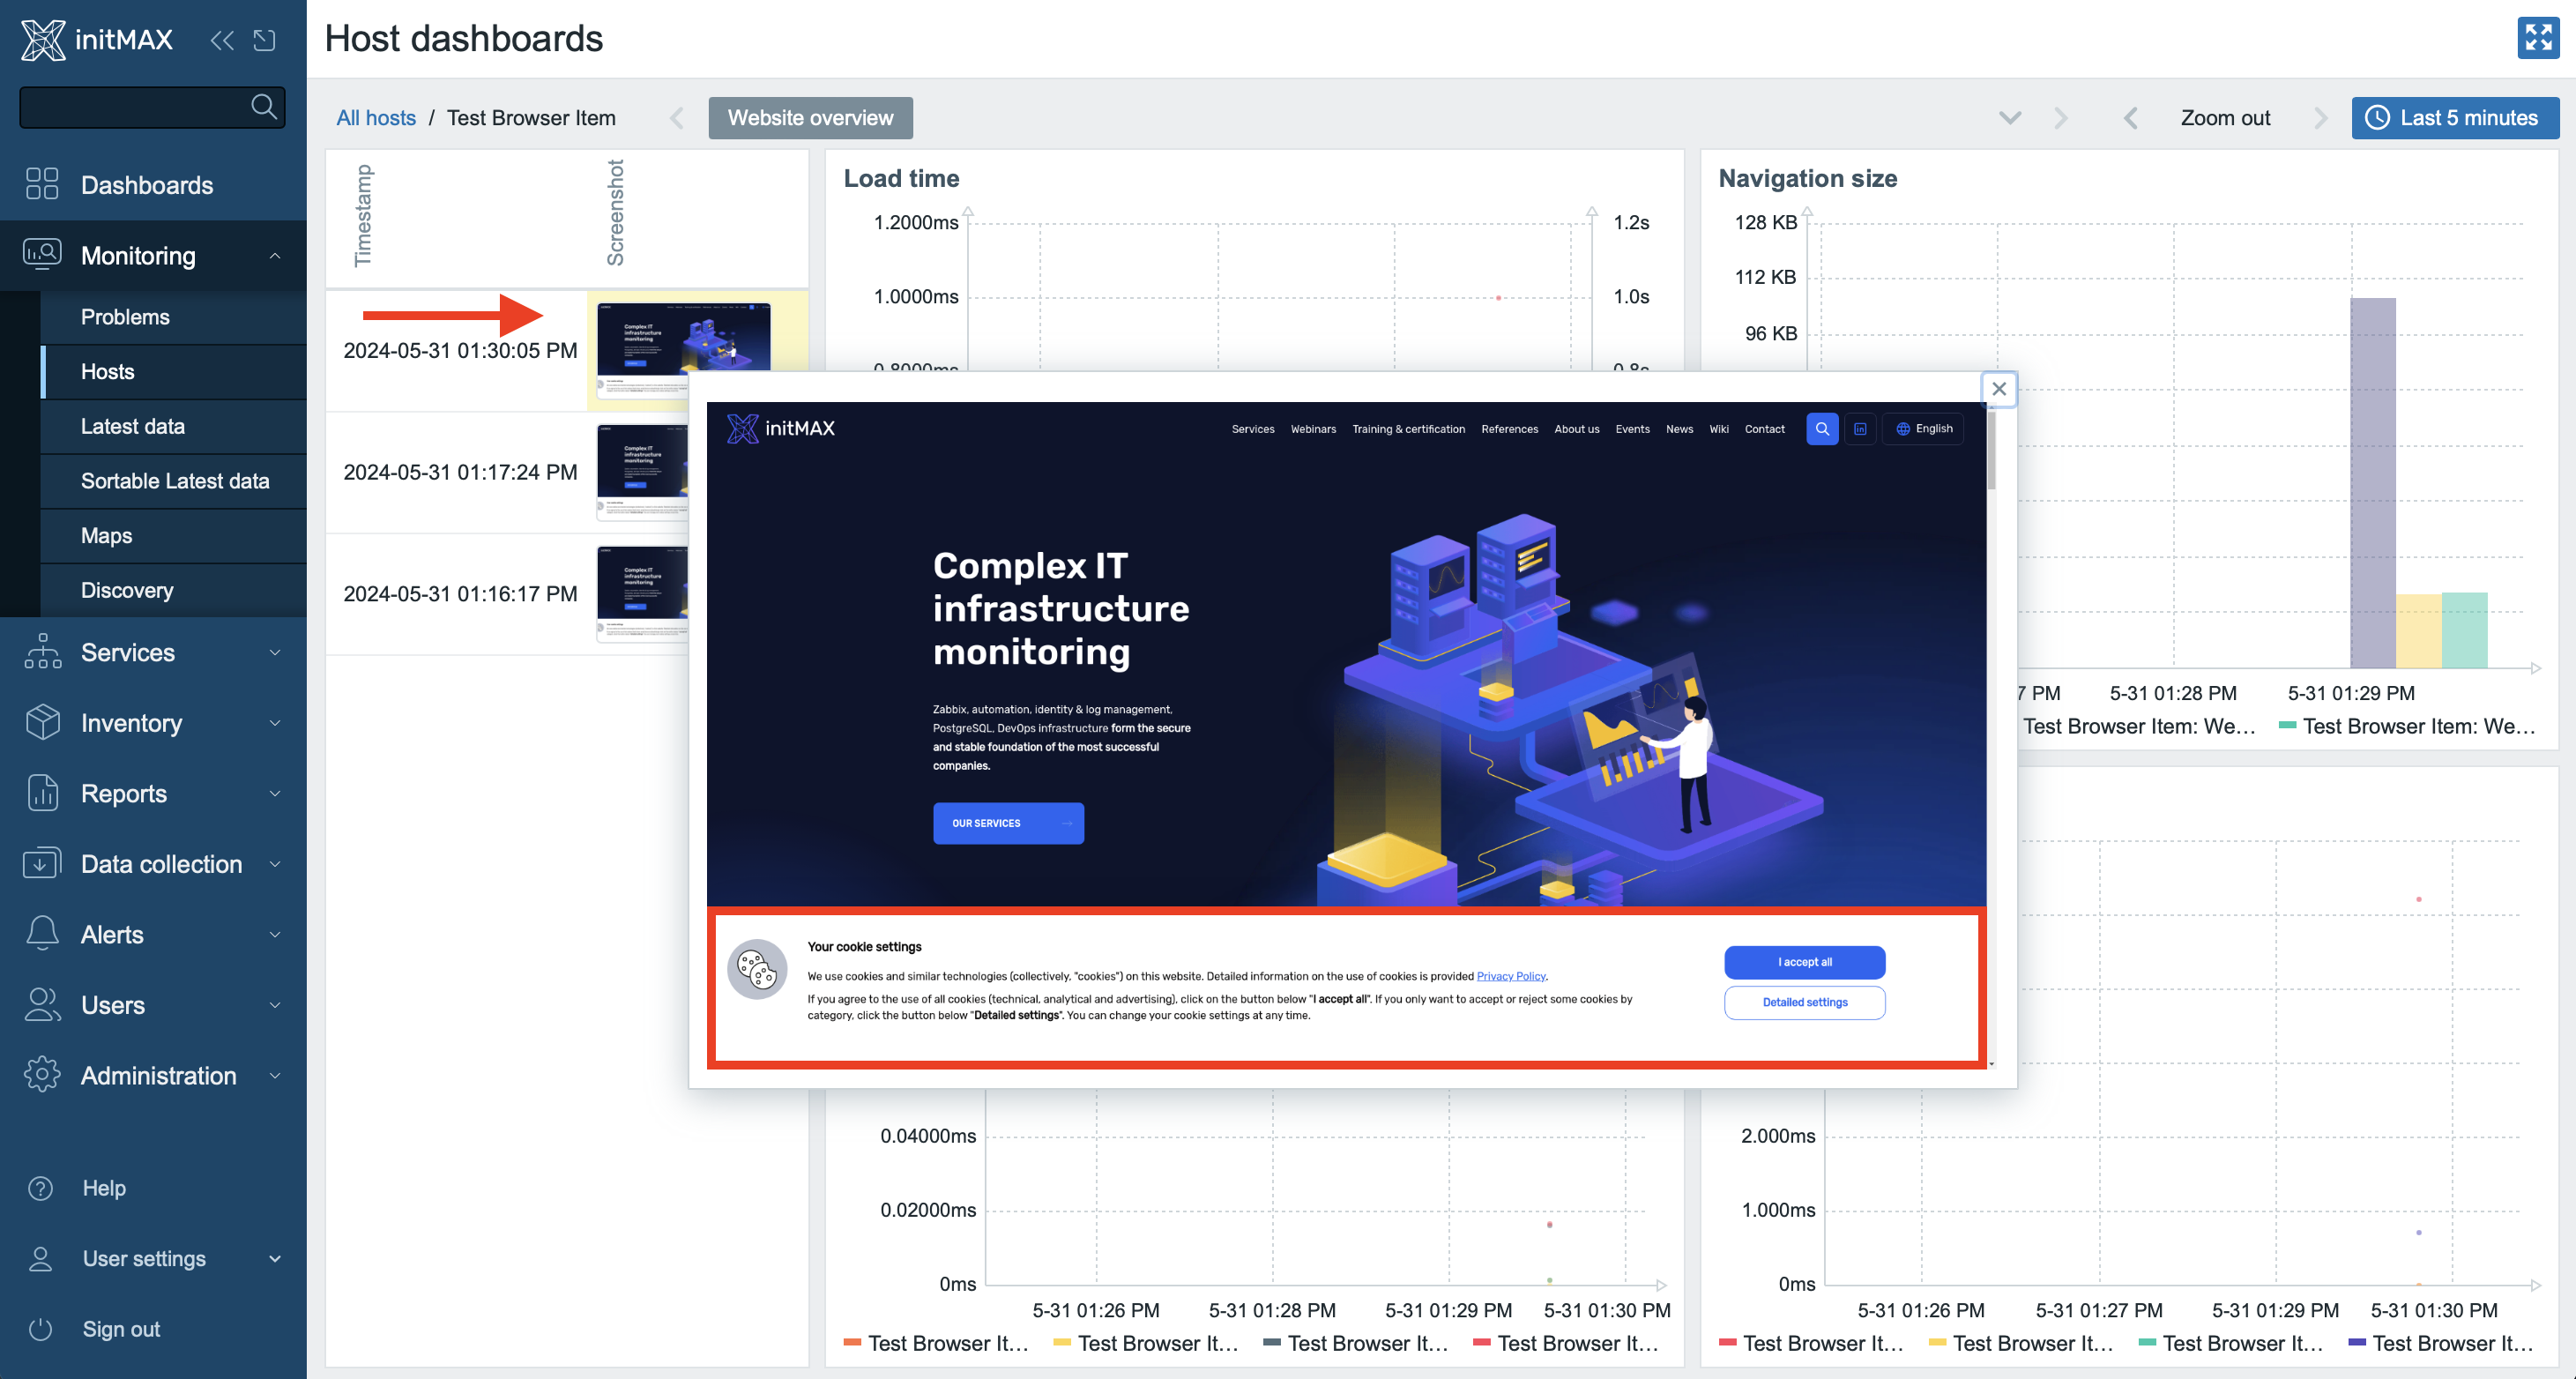
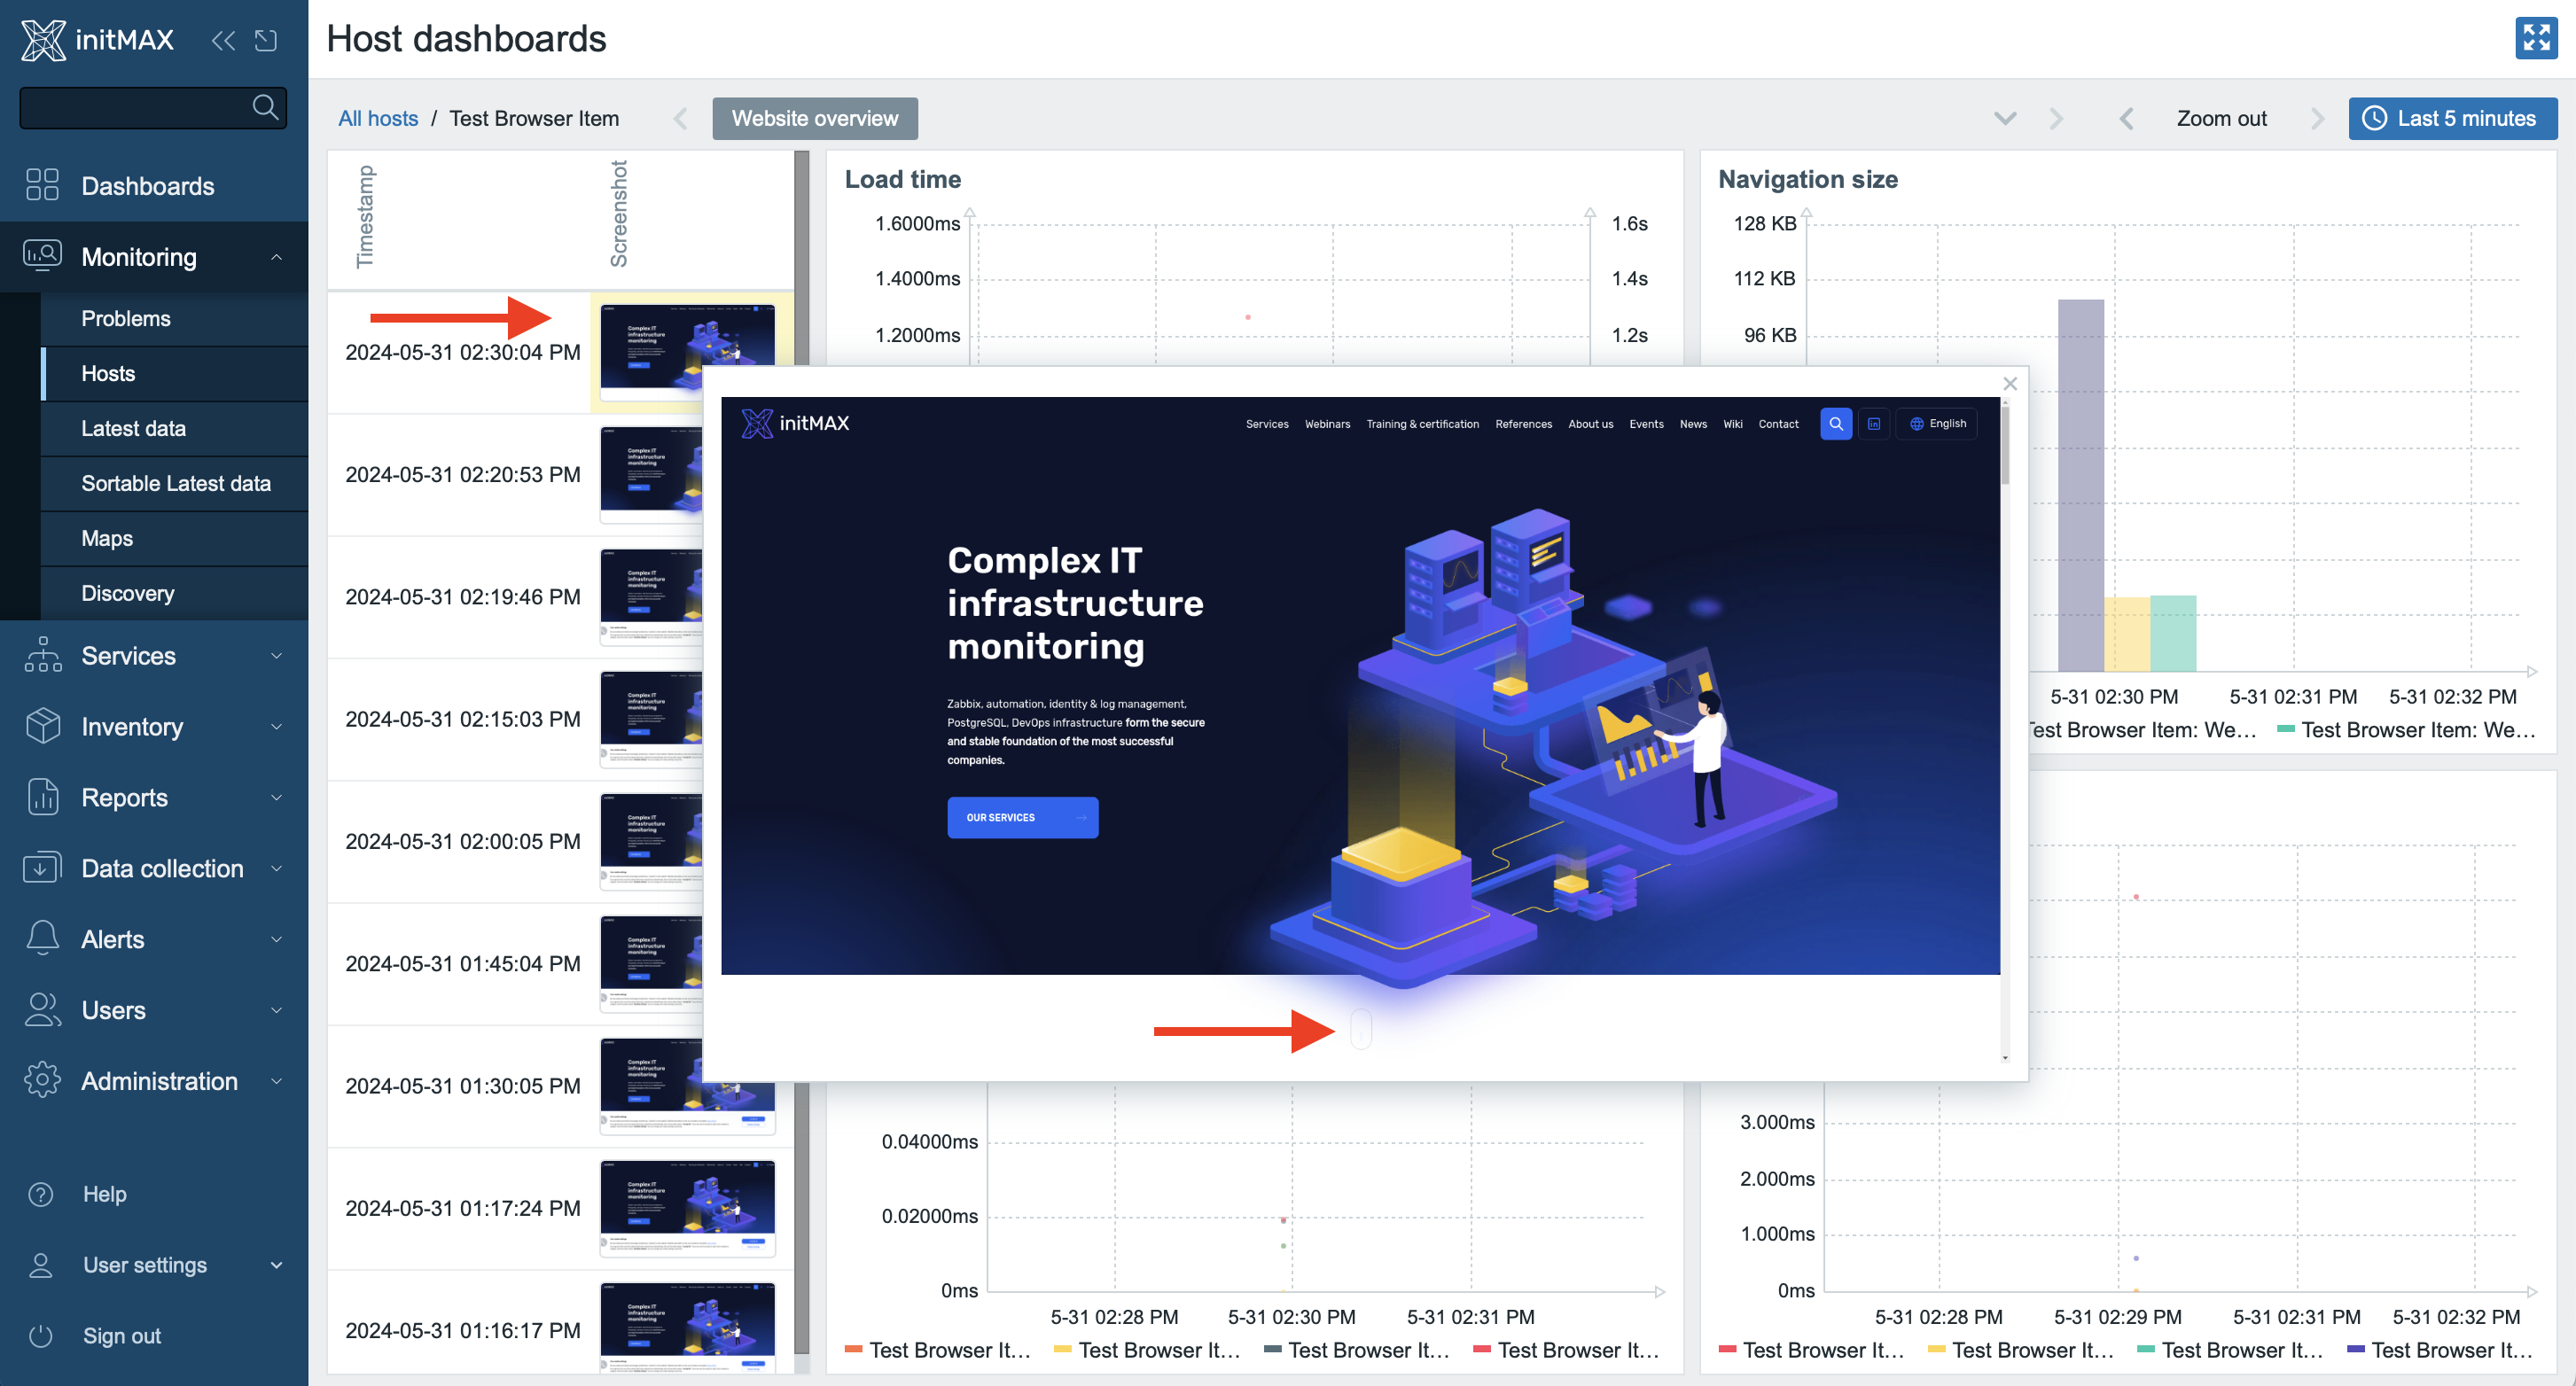
The best overview of the collected data can be found directly through the dashboard supplied by Zabbix together with the template.
You can find this dashboard in section Monitoring -> Hosts, filter out our newly created host and then you can easily click through to this dashboard:
After opening, a ready-made dashboard is displayed. This dashboard contains a screenshot of our first run and a lot of other useful performance metrics.
Note that the screenshot also includes a legally required cookie notice. The removal of this warning can be found in the next chapter of this guide. We will show you there how to adapt this template more to your specific requirements.
Template modification and custom tests
When editing, we will use the original Zabbix template, which is sufficient for the needs of our example. However, in production, it is always better to have a template of its own for each specific check. That way everything needed can be defined in its own template instead of modifying just the one template.
During previous testing, for example, we didn’t like the cookie warning on the collected screenshots.
The easiest way to get rid of this bar is to click on the I accept all button within the page, which will confirm the choice of cookies.
So now we’ll show you how to add this simple click as a part of our test.
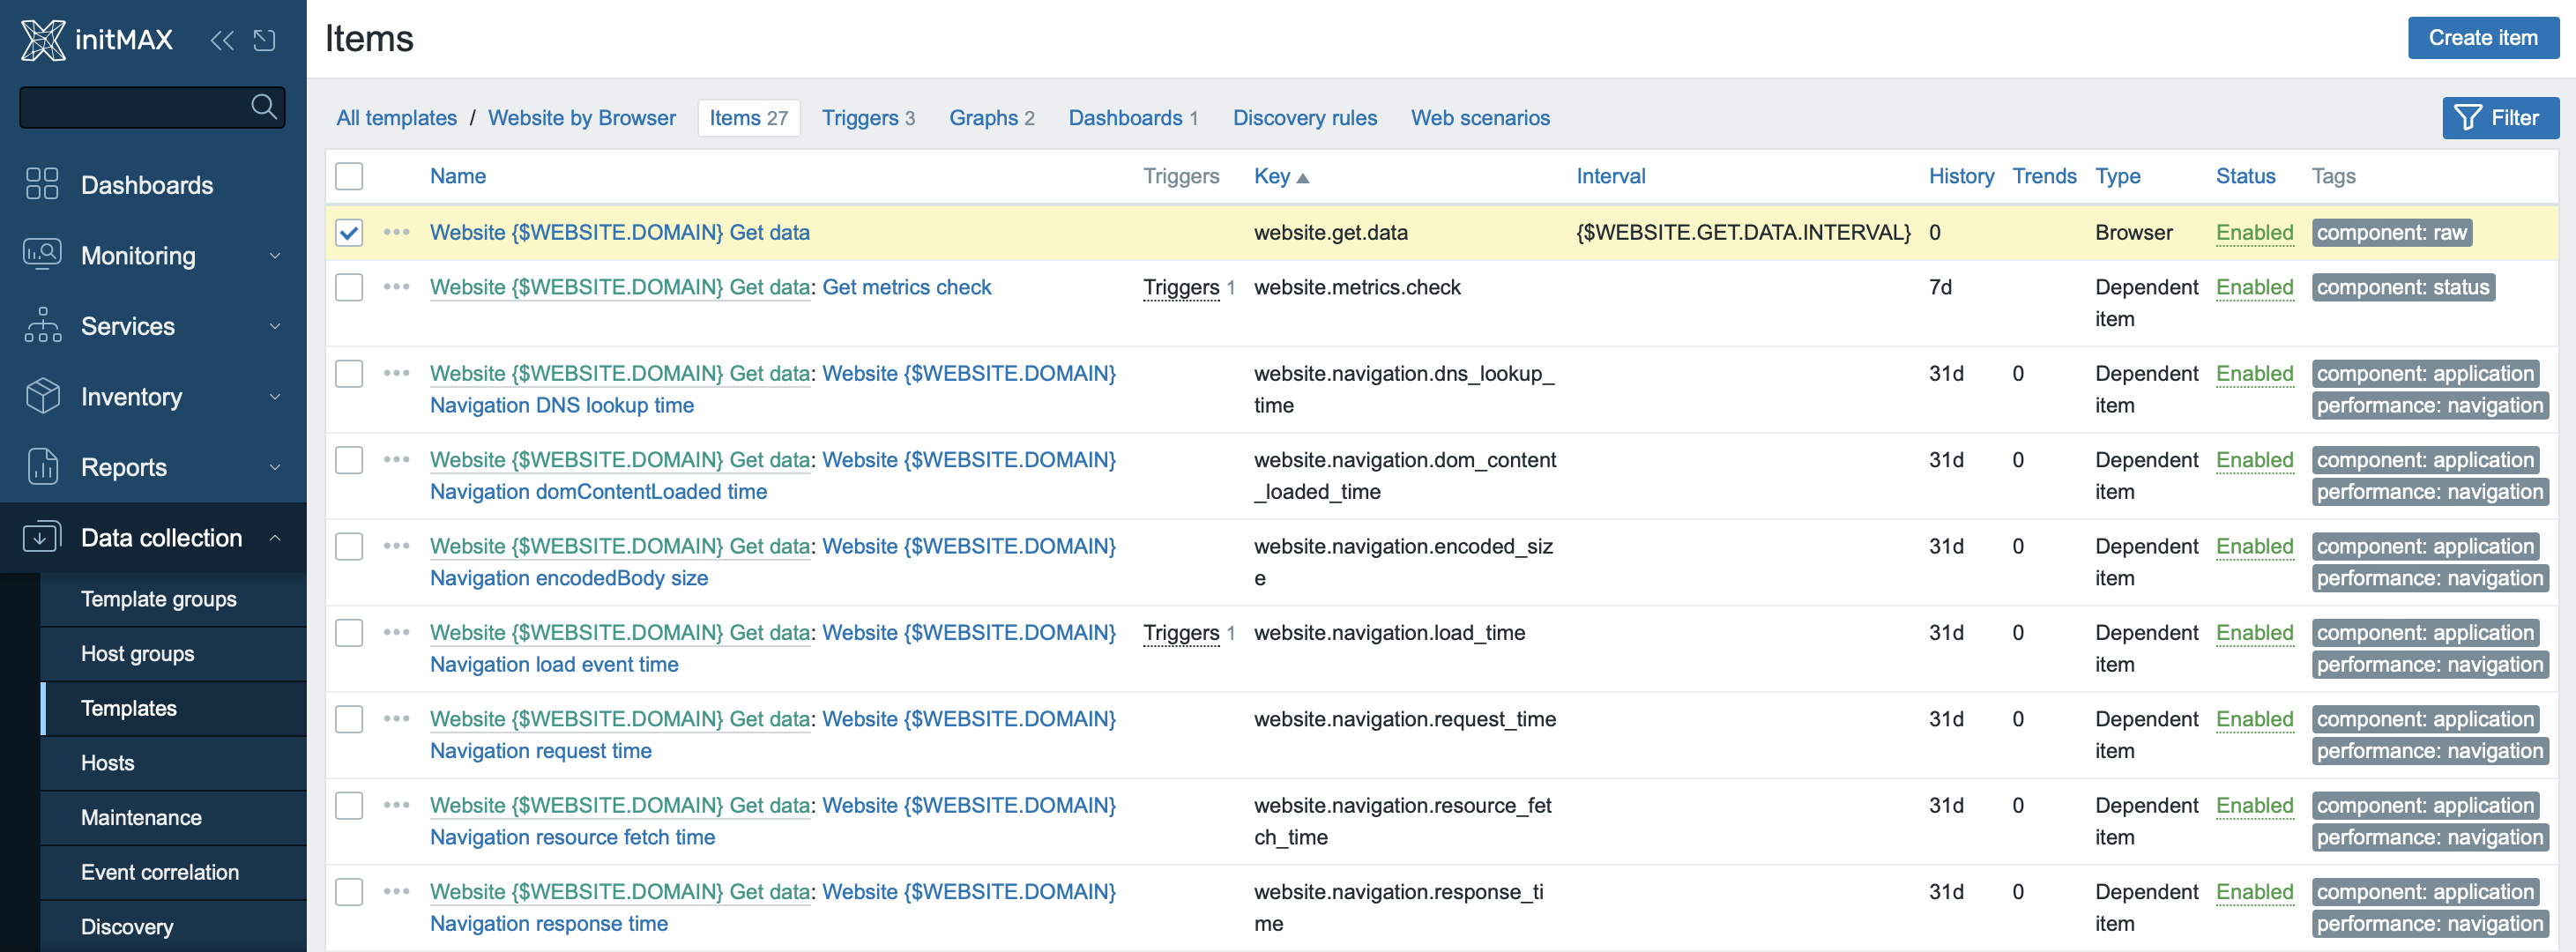
Let’s open our sample template “Website by Browser”, where you can find an item with a tag component: raw.
This item is called Website by Browser: Website {$WEBSITE.DOMAIN} Get data, and in one of the previous steps we used it to manually force the check.
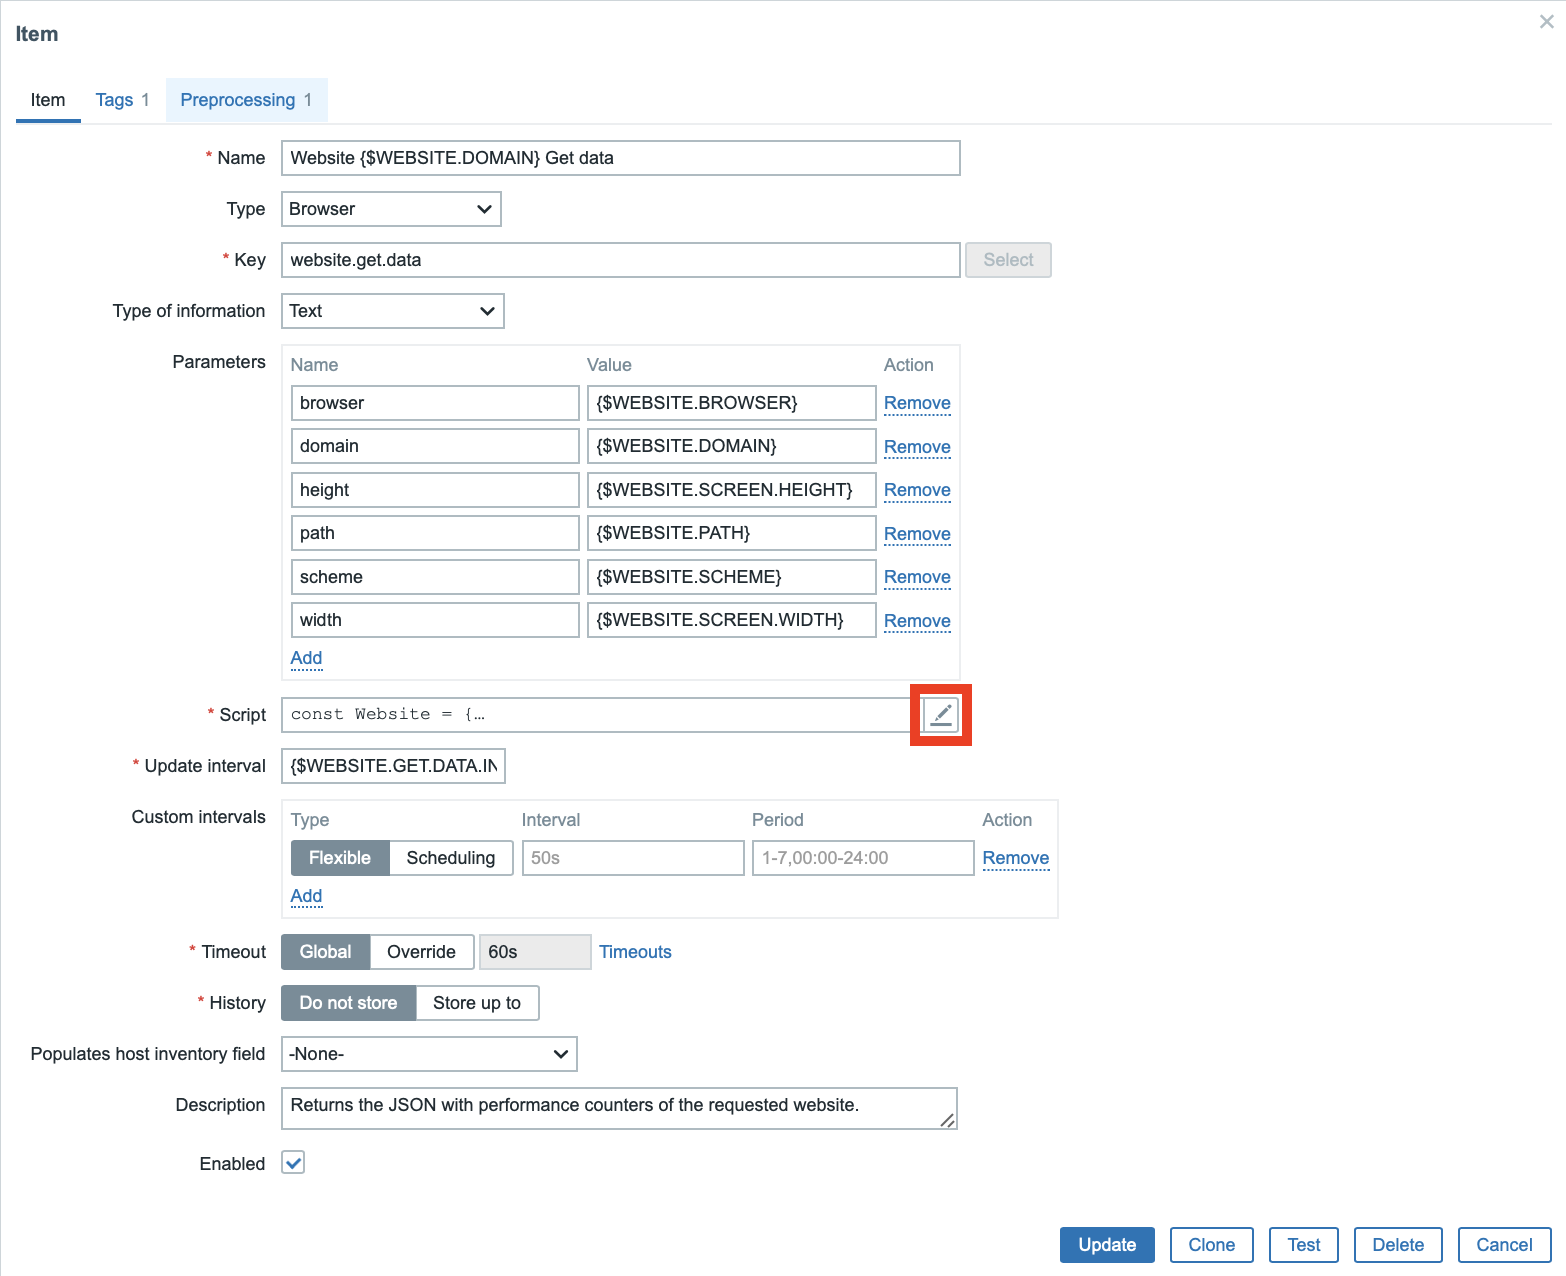
The setting of this item also includes a script written in JavaScript. Open it using the edit button, highlighted in red on the screenshot below.
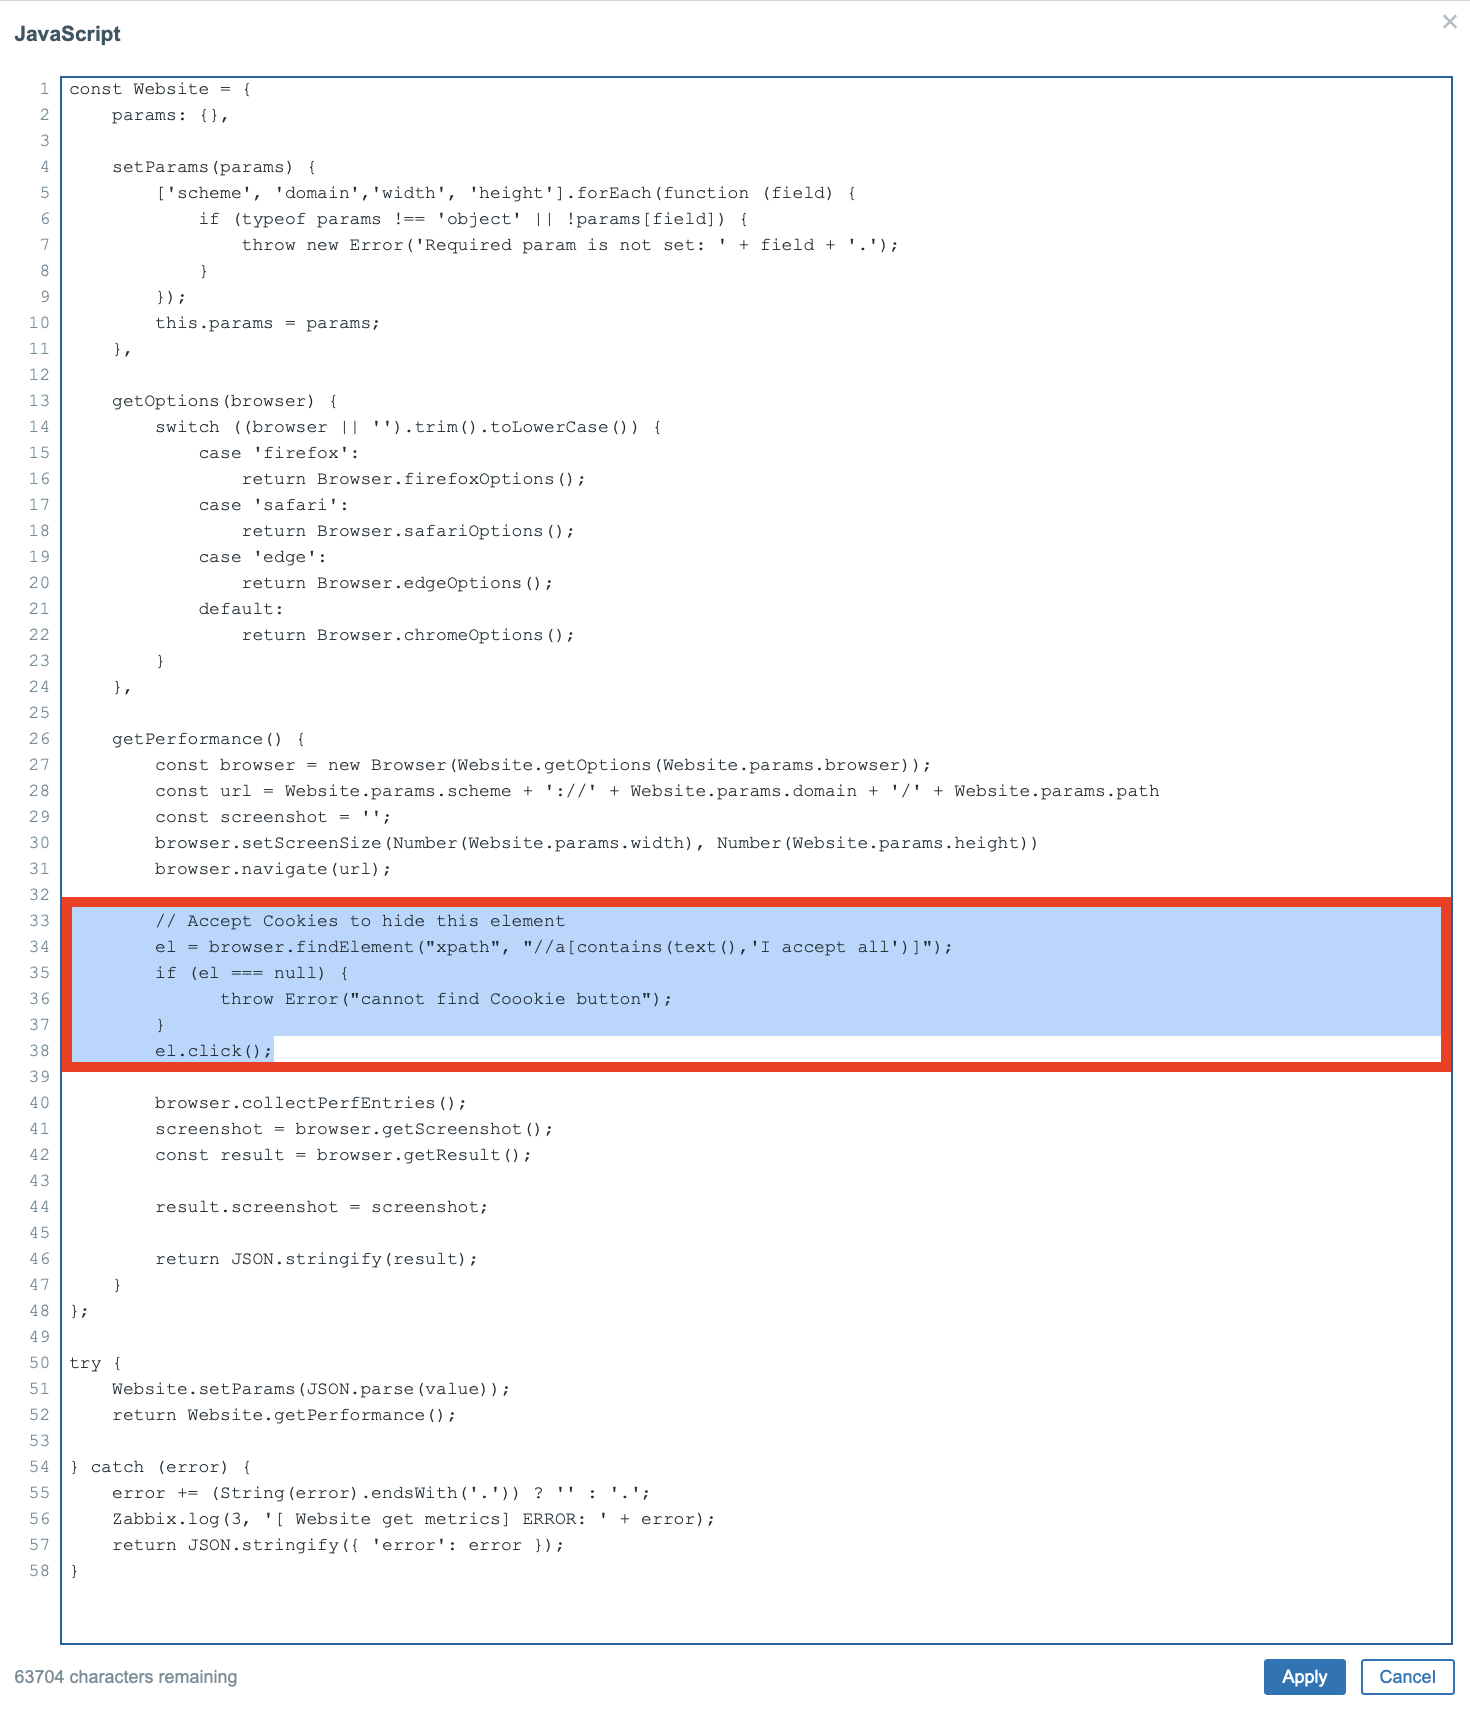
Add the following section to the script:
// Accept Cookies to hide this element
el = browser.findElement("xpath", "//a[contains(text(),'I accept all')]");
if (el === null) {
    throw Error("cannot find Cookie button");
    }
el.click();
This piece of code searches the content of the loaded page using xpath, finds the element containing text “I accept all” and clicks on it.
XPath is a standard Selenium technique to navigate through a page’s HTML structure and the description of the process can easily be found on the Internet.
Here you can see what the resulting script looks like:
Save the script with the Apply button, save the item with the Update button and return to our test host, where you can observe the result.
Again, don’t forget that new data will arrive with a delay depending on the preset interval – to speed this operation up, you can again click on the Execute now button, as in the previous case.
In the screenshot shown above, you can see the result, where the cookie warning bar has disappeared.
This completes our sample Browser item setup and our usage example is over.
Don’t forget that all the capabilities and options for setting up this item can be found in the Zabbix documentation, as mentioned at the beginning of the article.
Give us a Like, share us, or follow us 😍
So you don’t miss anything: