
Description
Enhanced Problems is a problems table you build the way your operations desk needs it. You pick the columns, their order, labels and widths, set the font and the colours – and the same table then reads well both on an operator’s monitor and on the large screen on the wall.
Filtering works by host group, host, severity, tags and problem name, and optionally by the hosts the dashboard is currently showing. Host groups can also be excluded, so one widget can show everything except the test environment.
A problem is handled in the widget itself: right-click selects a row and the Actions menu offers Acknowledge, Unacknowledge, Delete and Journal. From Zabbix 6.2 there is also Time acknowledge – an acknowledgement for a set period.
The Count and First occurrence columns and the row link take their value from a problem tag or from a regular expression over the update messages, so the table can carry numbers Zabbix itself offers no column for. The widget speaks all 27 languages a Zabbix frontend can display.
The widget runs on Zabbix 6.0 to 8.0 from a single package and is HA ready – multi-frontend and HA installations work out of the box, just install the package on every frontend node.
Everything above is in the FREE edition. The PRO edition adds what a wall display needs: the widget’s own title block with a summary row and per-severity counts, a second and third sorting level together with the display mode and the acknowledge style, the widget’s own severity colours, and action buttons – webhooks or Zabbix scripts for selected problems, defined by an administrator in Administration → Enhanced Problems.
Usage examples
Example 1: Open problems with the PRO summary
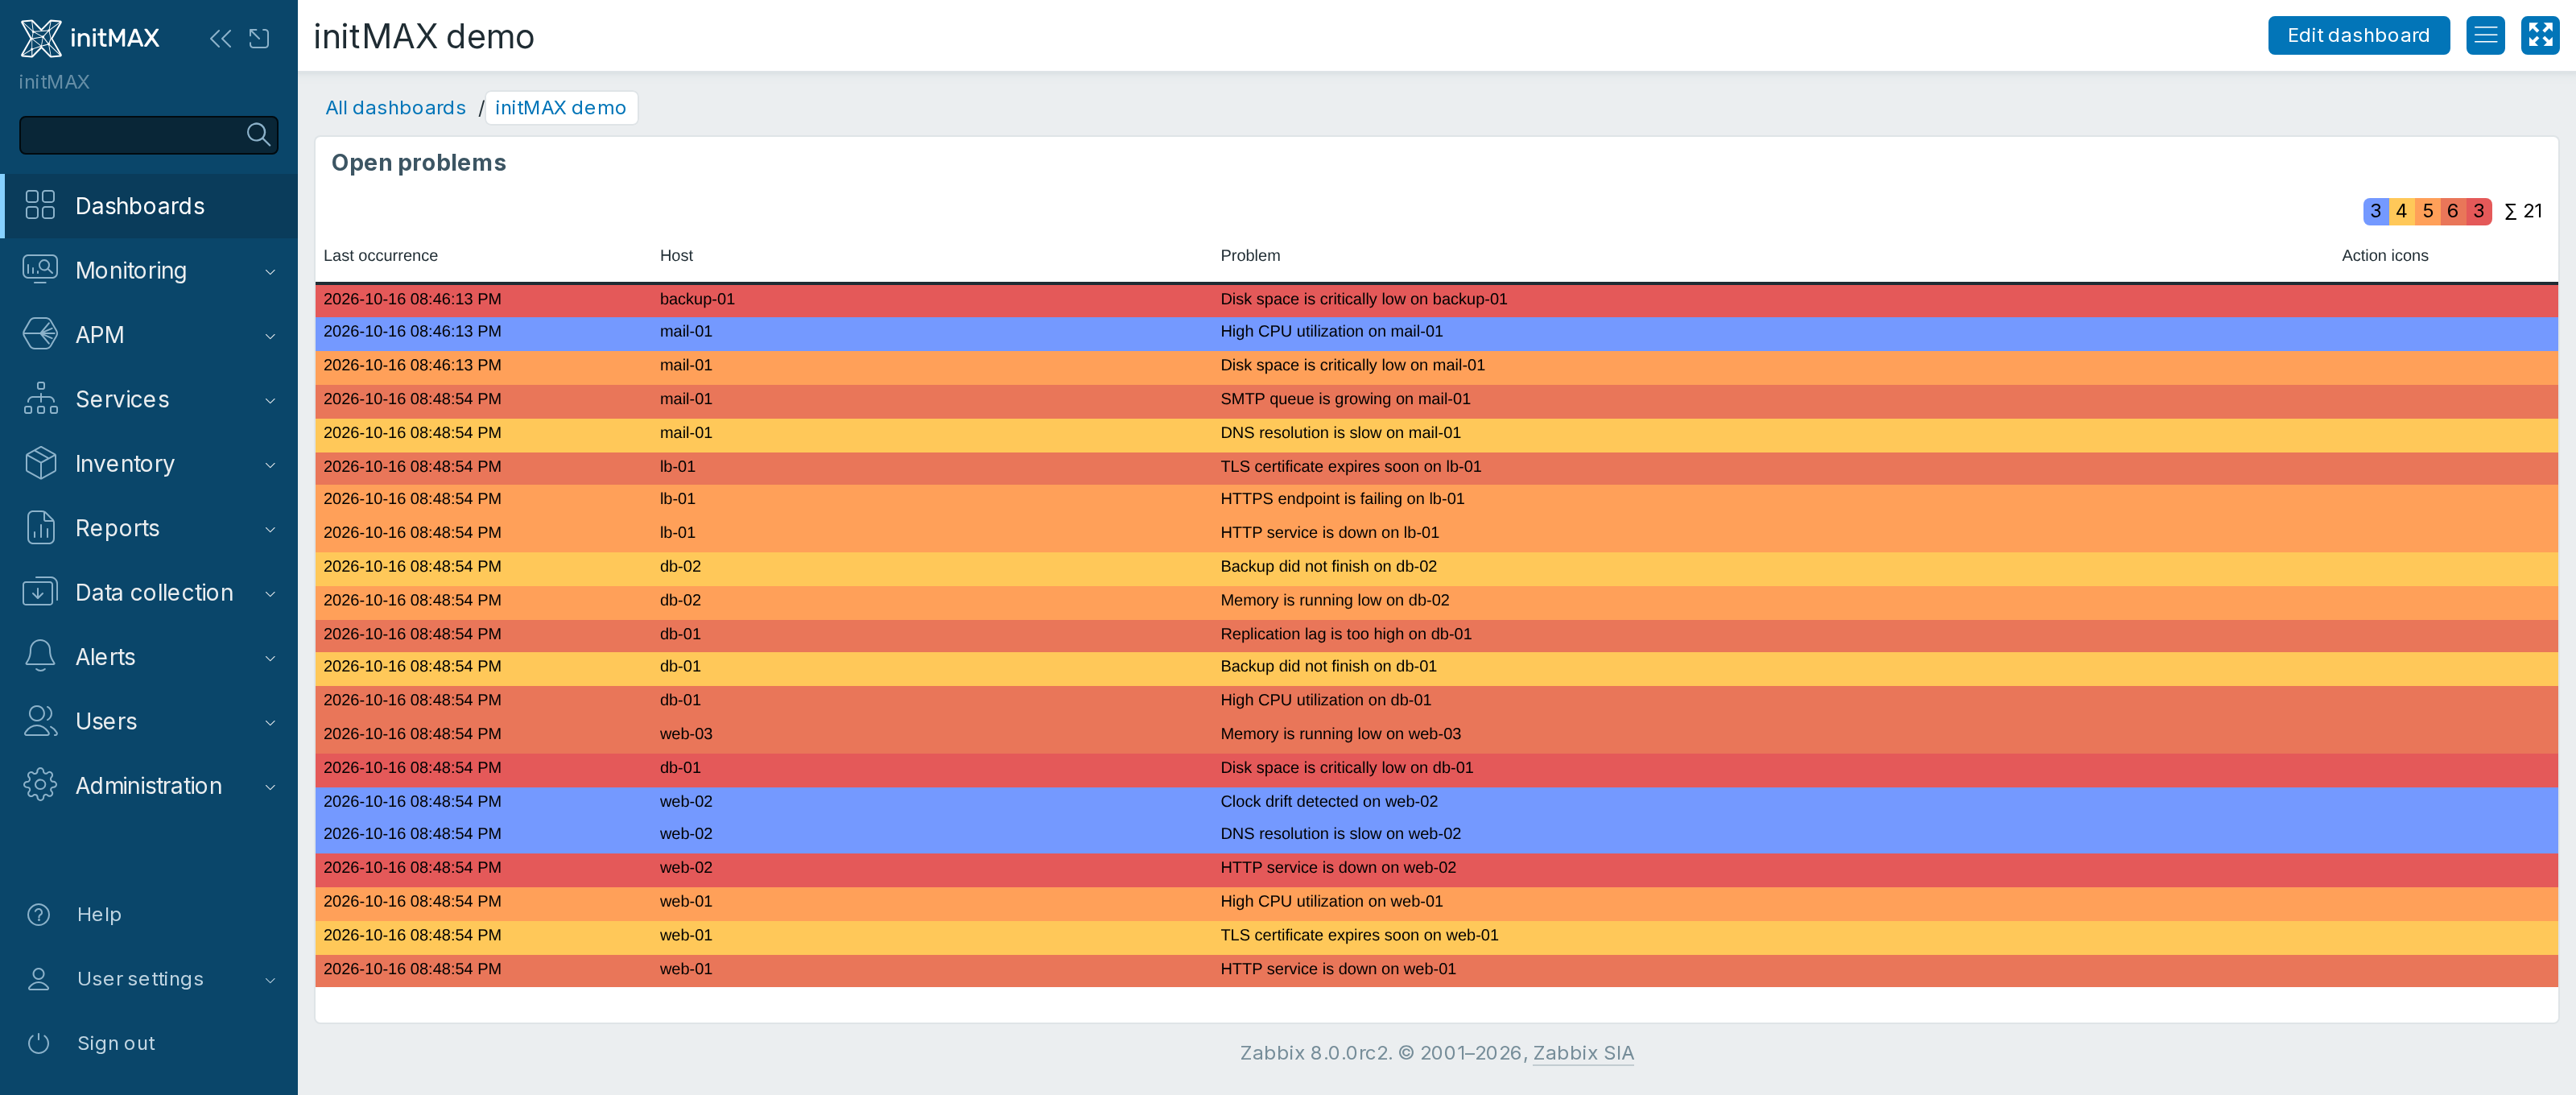
On a dashboard the widget shows twenty-one open problems from eight hosts: the Last occurrence, Host, Problem and Action icons columns, ordered by severity and coloured by it. Top right is the summary row with the per-severity counts and the total – that one is a PRO feature.
Example 2: Action buttons on a problem row (PRO)
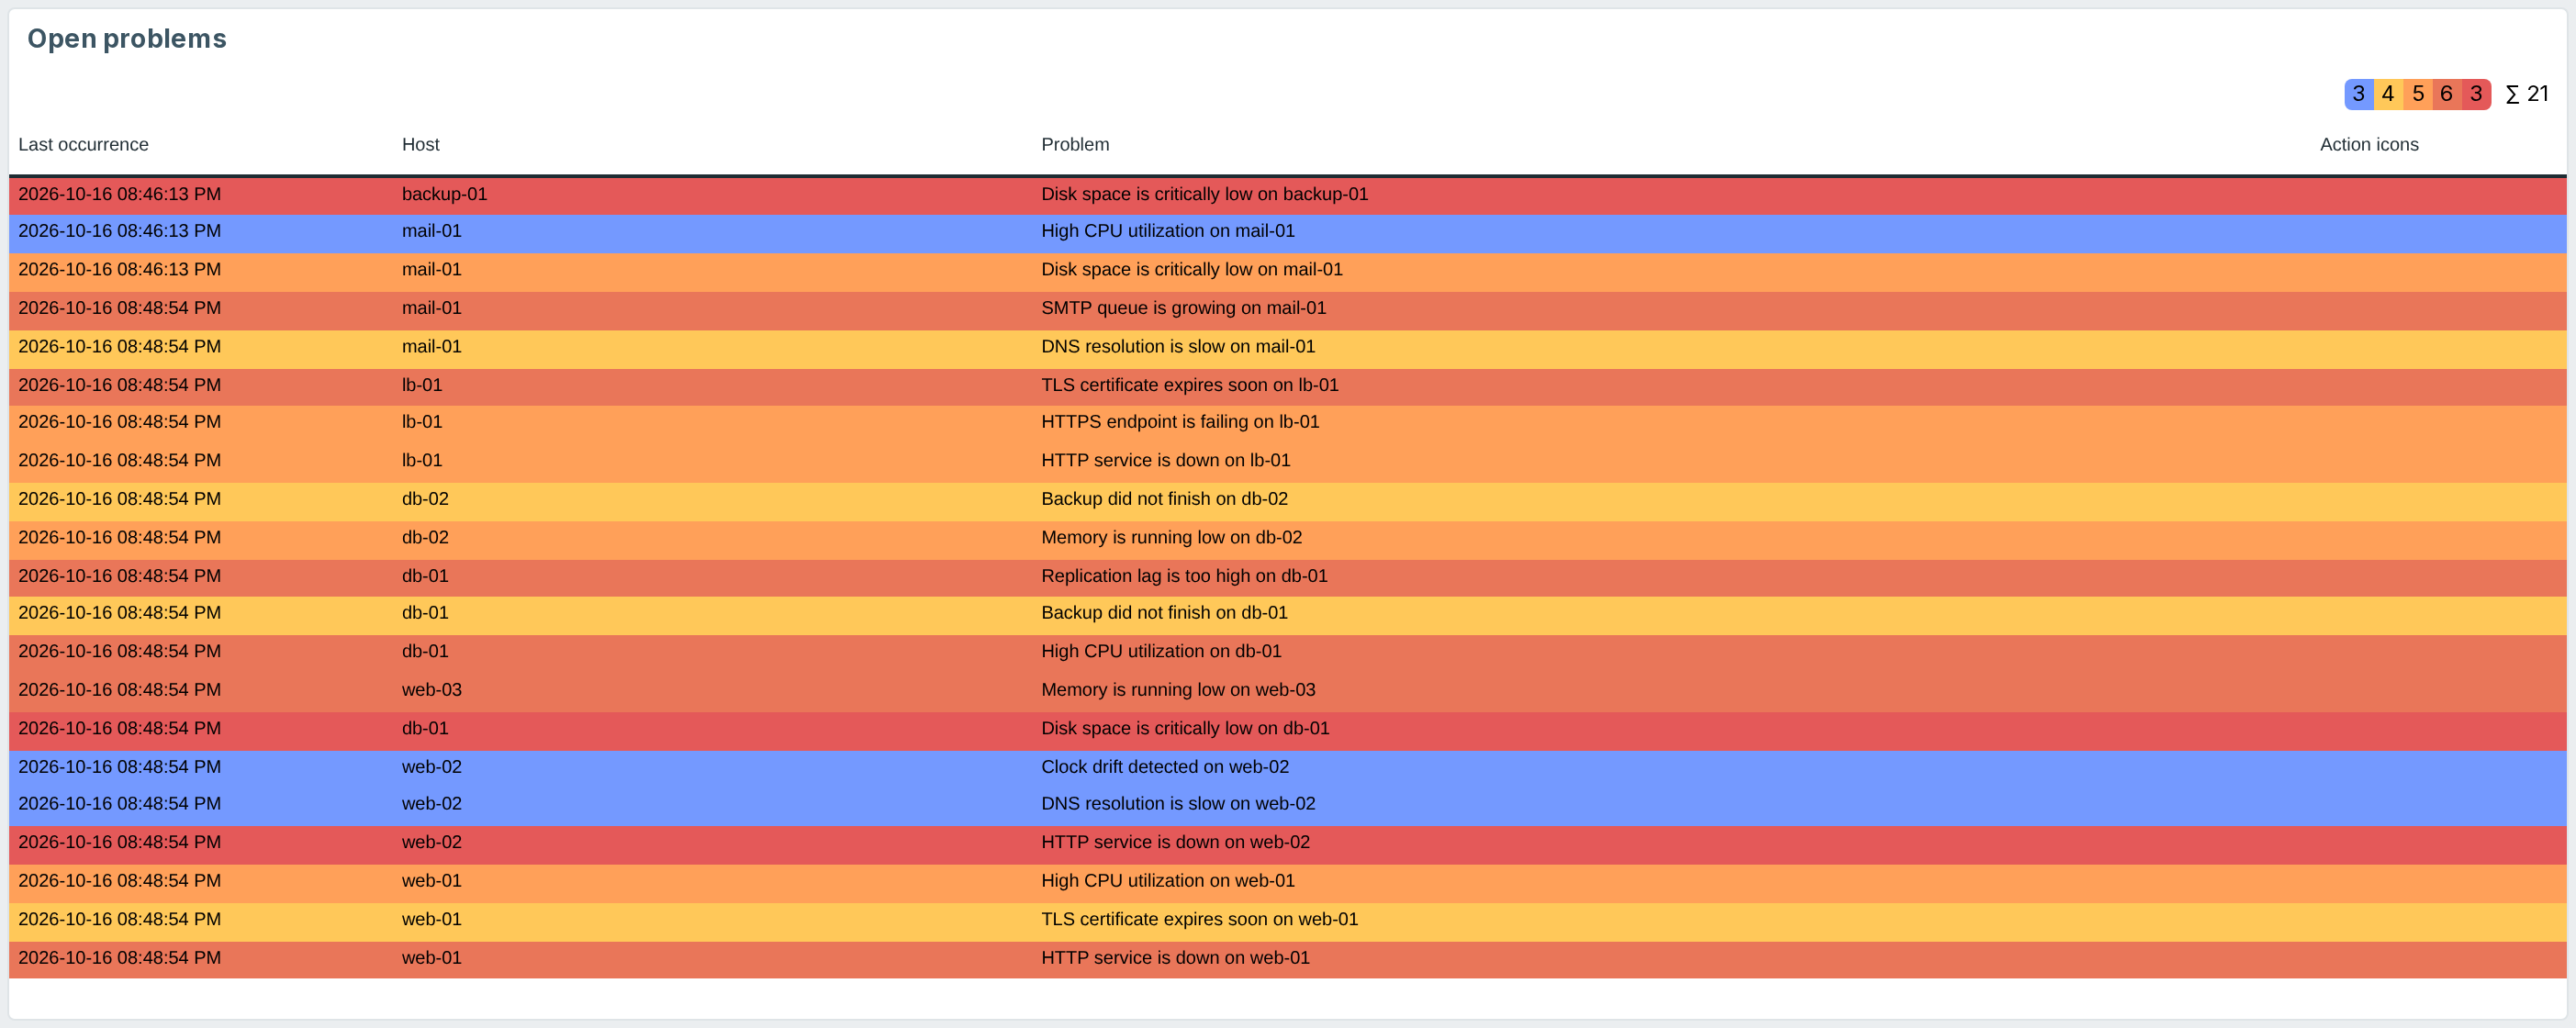
Right-clicking a row selects the problem and opens the Actions menu. Under the built-in entries (Acknowledge, Time acknowledge, Unacknowledge, Delete, Journal, Follow URL, Copy to clipboard) sit the buttons an administrator defined – here Create ticket, Restart service and Open runbook. The operator opens a ticket or restarts a service without leaving the dashboard.
Example 3: Defining an action button in Administration (PRO)
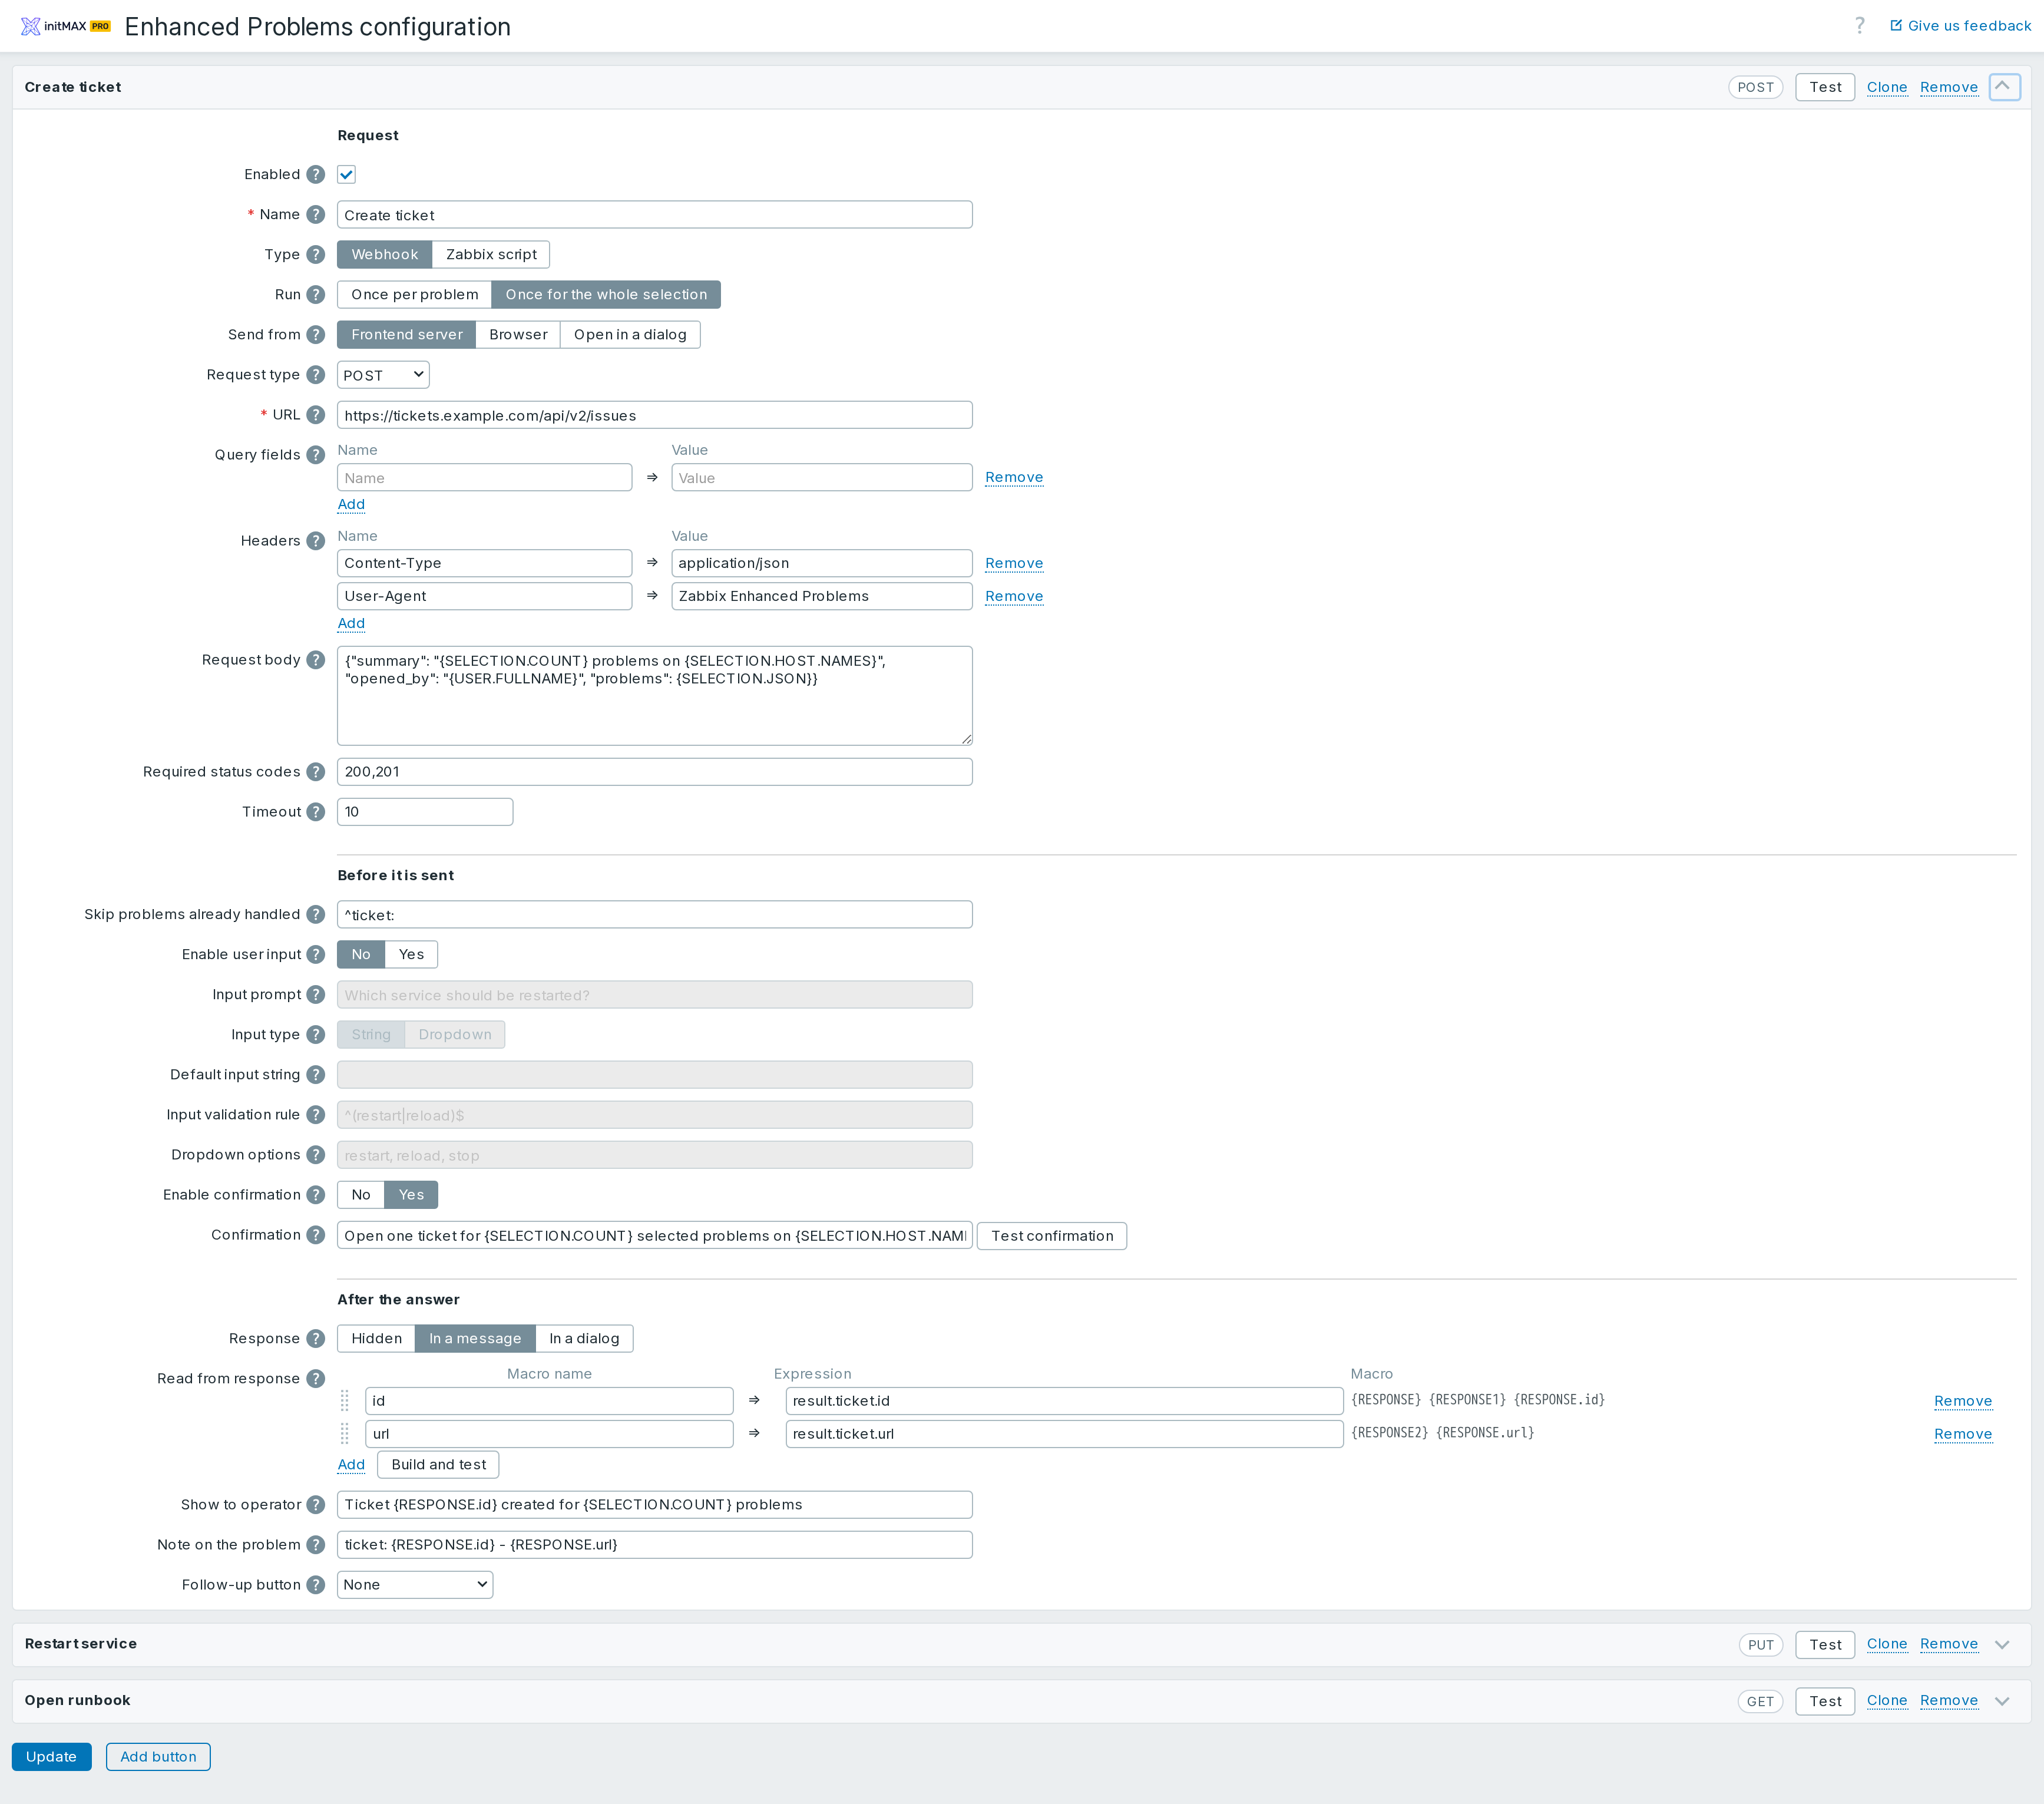
Buttons are defined once, globally, in Administration → Enhanced Problems. Webhook buttons use the familiar HTTP agent fields: URL, query fields, method, headers, body and the expected status codes. Before it fires, the operator can be asked for a value (free text or a list) and made to confirm; values are then read out of the answer into {RESPONSE.id} macros that compose both the message the operator sees and the note left on the problem.
Example 4: The widget configuration (FREE and PRO)
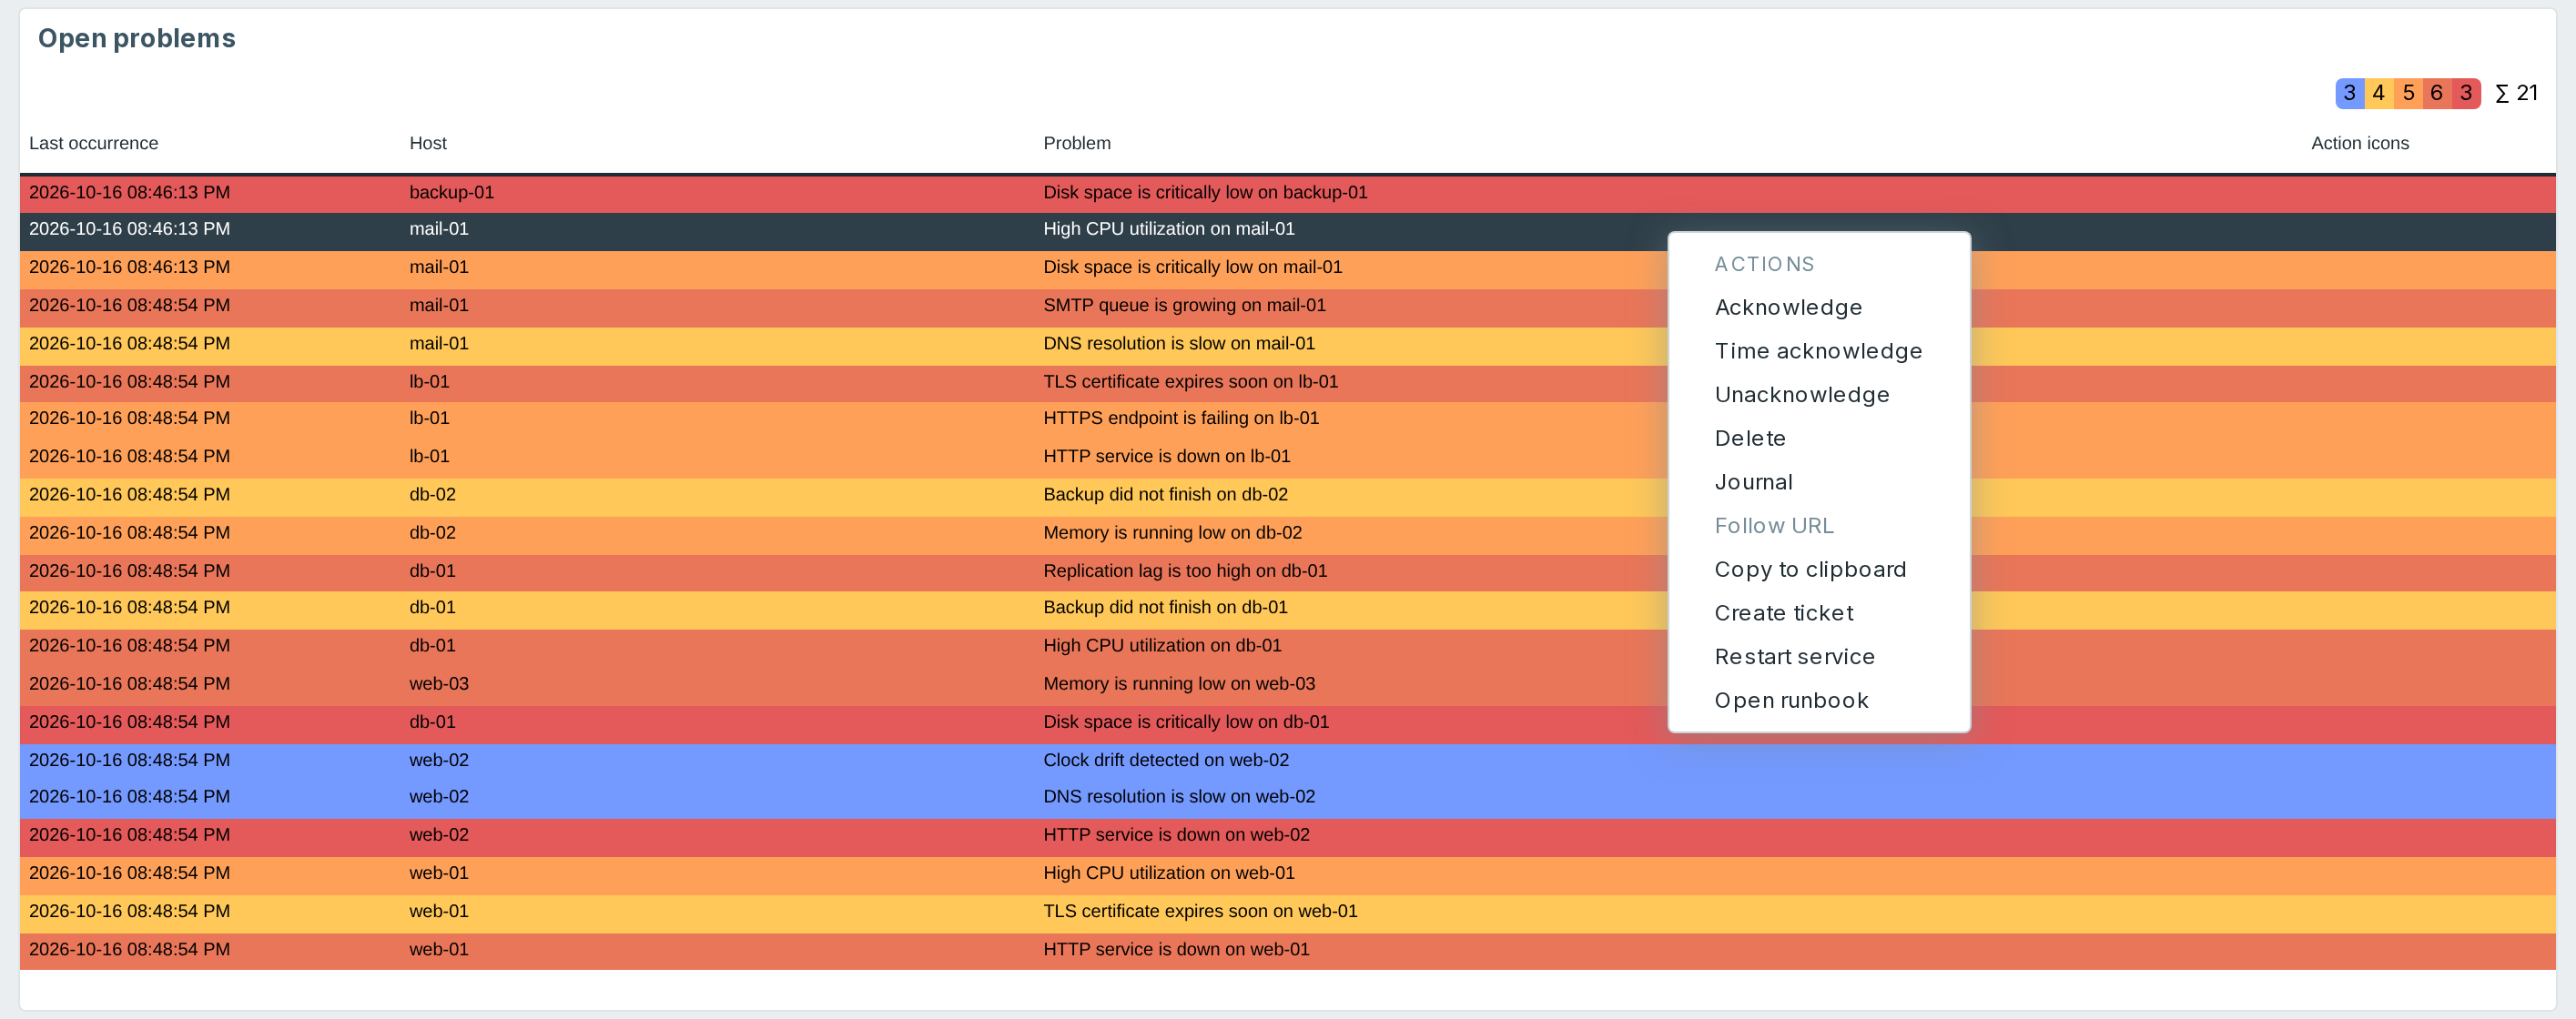
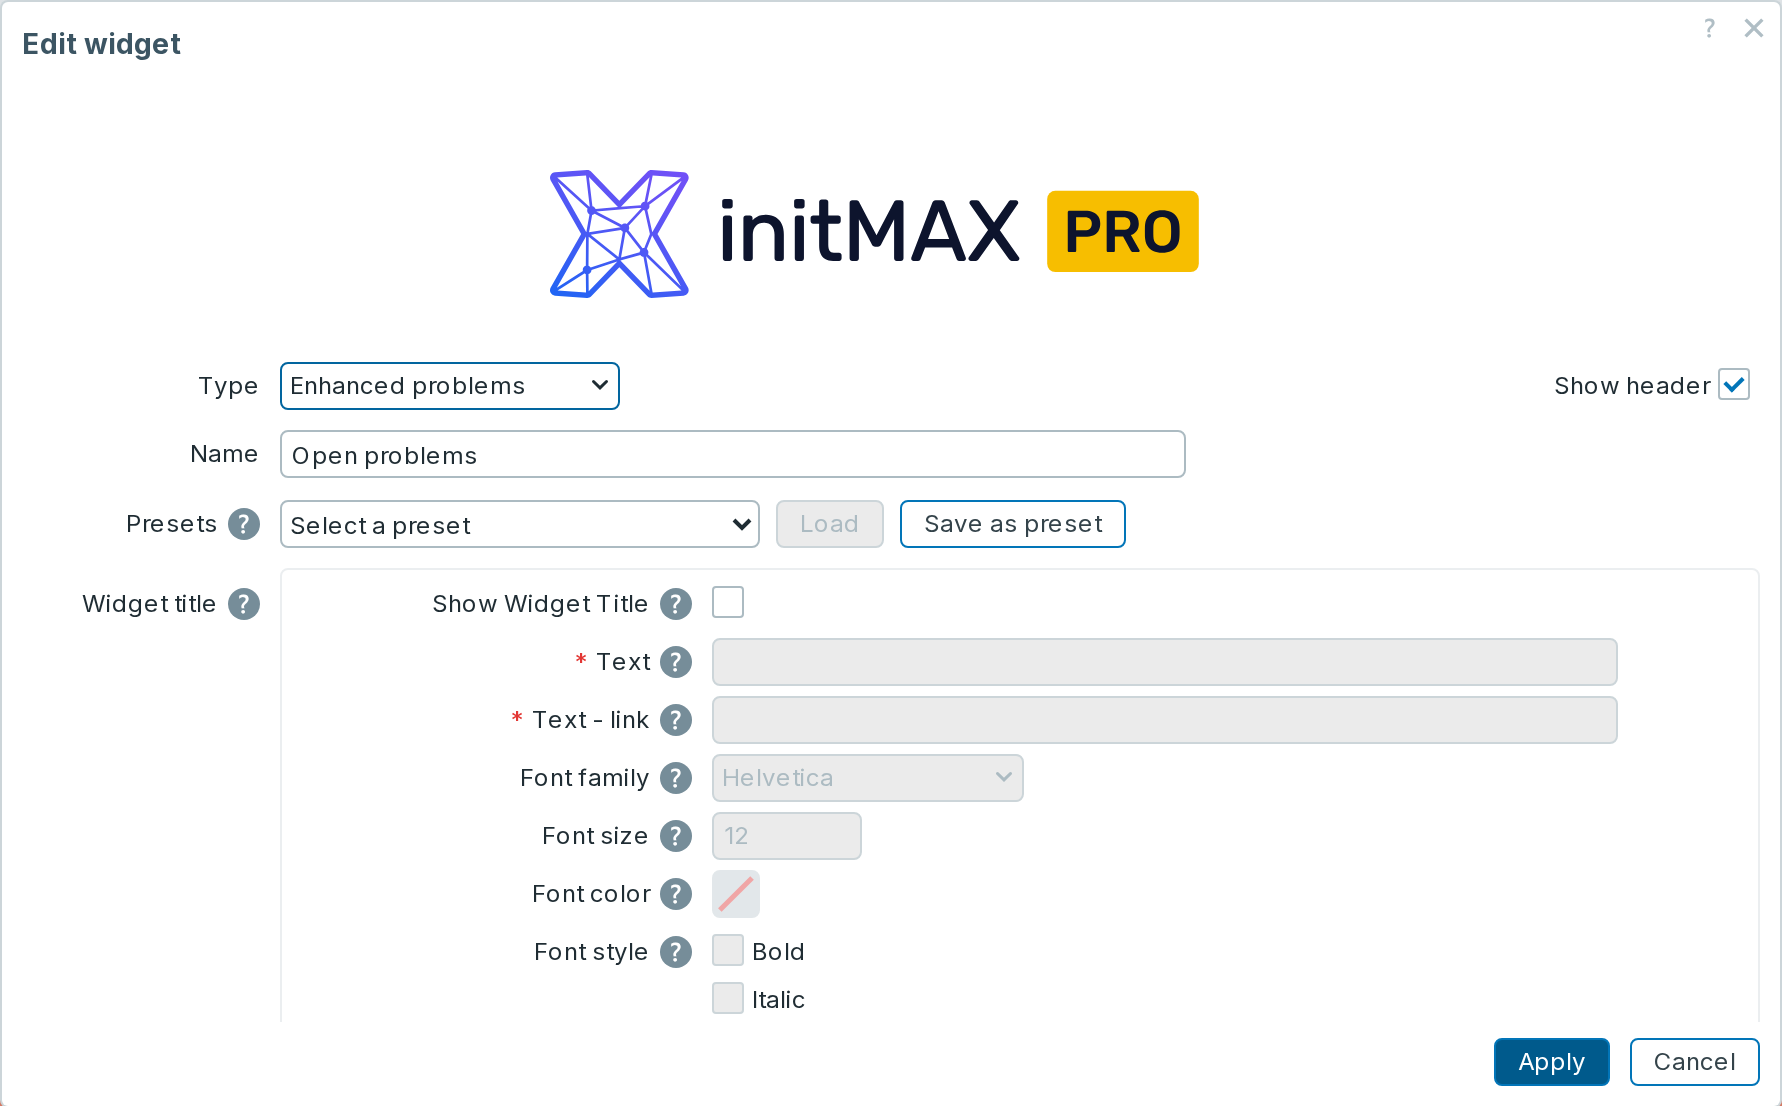
The whole widget is set up in one familiar form. In the FREE edition the PRO fields are visible but locked, with a padlock and an explanation, so it is clear what the PRO edition adds.
Installation
Enhanced Problems is distributed as a standard deb/rpm package from our repository repo.initmax.com. One package carries both module trees and deploys the one that matches your frontend. It supports Zabbix 6.0 – 8.0 and is HA ready – multi-frontend and HA setups work out of the box, just install the package on every frontend node.
Connect to the server running the Zabbix frontend over SSH (do this on every frontend node) and pick your distribution. Would you rather have a plain archive? Every release also ships as a ZIP – FREE straight from the repository, PRO from the catalog page in the Portal after signing in – handy for offline or manual installs.
RHEL / Rocky / Alma

FREE edition
# RHEL / Rocky / Alma
rpm -Uvh https://repo.initmax.com/zabbix/release/initmax-release-latest.noarch.rpm
dnf clean all && dnf install -y zabbix-module-enhancedproblems
PRO edition
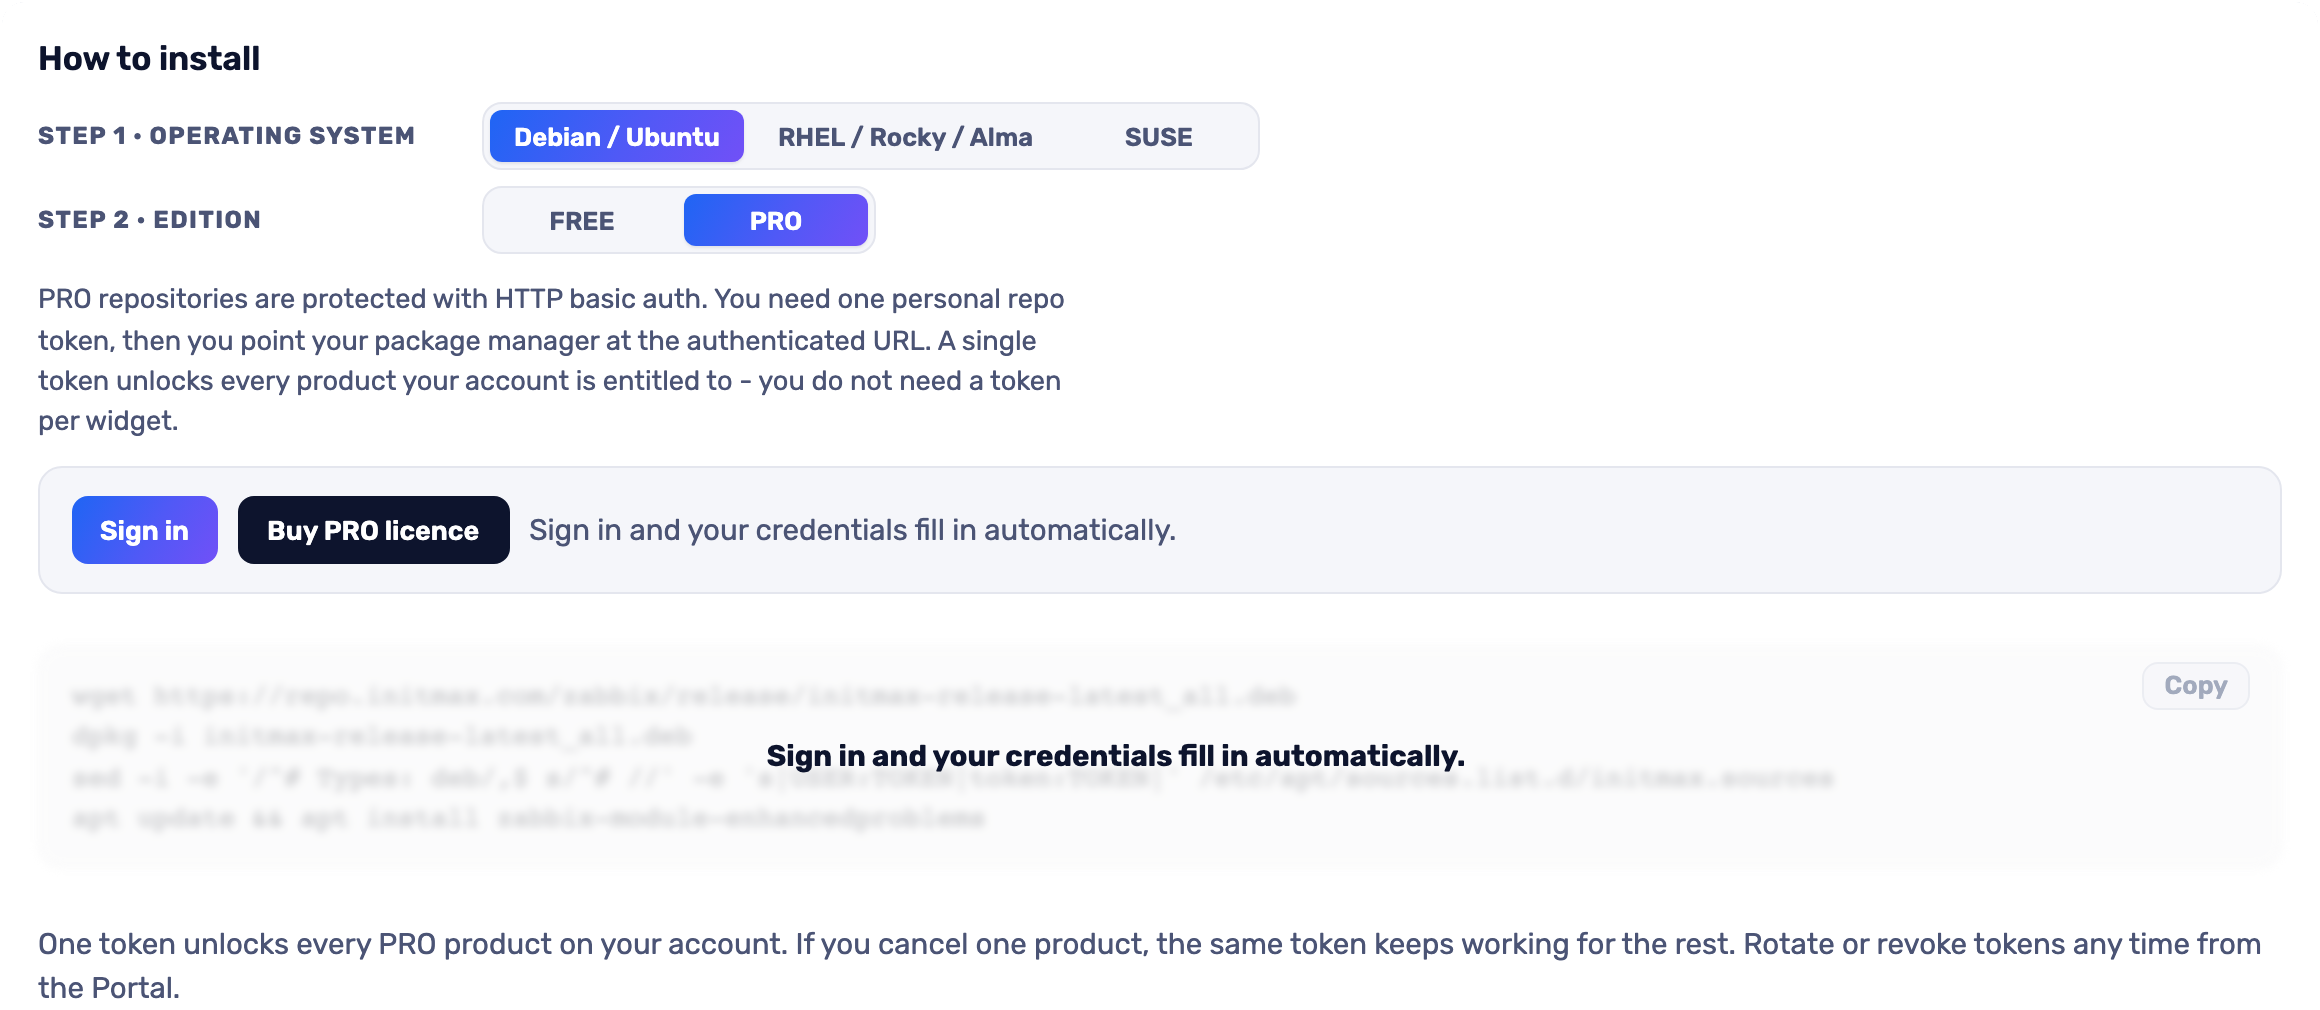
The most convenient route is the portal: pick your operating system and the PRO edition, sign in and your token is filled into the command for you – just copy it. Open the installer in the portal (the image below is clickable too).
SUSE
FREE edition
# SUSE
rpm -Uvh https://repo.initmax.com/zabbix/release/initmax-release-latest.noarch.rpm
zypper --gpg-auto-import-keys refresh && zypper install -y zabbix-module-enhancedproblems
PRO edition
The most convenient route is the portal: pick your operating system and the PRO edition, sign in and your token is filled into the command for you – just copy it. Open the installer in the portal (the image below is clickable too).
Debian / Ubuntu
FREE edition
# Debian / Ubuntu
wget https://repo.initmax.com/zabbix/release/initmax-release-latest_all.deb
dpkg -i initmax-release-latest_all.deb
apt update && apt install zabbix-module-enhancedproblems
PRO edition
The most convenient route is the portal: pick your operating system and the PRO edition, sign in and your token is filled into the command for you – just copy it. Open the installer in the portal (the image below is clickable too).
Verification
The module is enabled automatically during the package installation. You can verify it in the Zabbix frontend menu: Administration → General → Modules
If the widget was already running on that frontend (from an earlier package or from a manual installation), the package keeps its state – a module you disabled on purpose stays disabled – and the old manual copy is cleaned up as well, so the widget never shows up twice in the module list. Existing widgets on your dashboards keep working, the widget type does not change. Updates then arrive through your package manager (apt / dnf / zypper) like any other system package.
Configuration
Complete configuration presets (FREE and PRO)
Since 2.3, save the widget configuration under a name: filters, groups and hosts, tags, ordered columns and widths, sorting and appearance. Load the preset on another dashboard and check that its filters suit the destination.
Webhooks and Zabbix scripts (PRO)
Choose Webhook or Zabbix script for an action button. Scripts from Alerts → Scripts run as the operator, once per host or problem according to the script scope. Script manual input requires Zabbix 7.0 or newer. Process the output like a webhook response: extract values, show the result, add a note and run a follow-up. Buttons can be cloned and tested.
One ticket for the whole selection (PRO)
A webhook can run once per problem or Once for the whole selection. Use {SELECTION.COUNT}, {SELECTION.EVENT.IDS}, {SELECTION.HOST.NAMES}, {SELECTION.TEXT} or {SELECTION.JSON}. Record the resulting ticket number in a note on every selected problem. Skip already handled matches an existing note pattern to avoid processing the same problems again.
Last occurrence time
Under Columns, Update message dates Last occurrence controls whether a note changes the last-occurrence time. Turn it off when recording a ticket number must not move the time of the actual event. Values extracted from notes use the latest matching update.
Widget fields
The widget form is split into groups. Fields marked (PRO) are visible in the FREE edition but locked.
| Field group | What it sets |
|---|---|
| Widget title (PRO) | Show Widget Title, Text, Text – link, Font family, Font size, Font color, Font style, Background color – the widget’s own title bar instead of the dashboard’s. |
| Filtering | Severity, Tags (And/Or or Or), Host based filtering, Host groups, Exclude host groups, Hosts, problem name, Show unacknowledged only, Show suppressed problems. |
| Sorting | First level sorting column and order. (PRO) Second and third sorting level – they decide the order of rows that tie on the first one, so rows stop swapping places on every refresh. |
| Display options | Maximum displayed alarm count, Show header, Font, Font size, Font color, Background color, horizontal and vertical scrollbar. (PRO) Display mode (table or lines) and Acknowledge problem style (colour or shading only). |
| Columns | Which columns are shown, in which order, with which label and width. Count from (tag or update message), Count from tag, Count from update message, First occurrence from tag, Row link from tag. |
| Summary row (PRO) | Show summary row, name, link, which problems are counted per severity and in the total. |
| Severity colours (PRO) | Custom severity colours – background and text for each of the six levels. An empty text colour picks black or white automatically, whichever contrasts better. |
Action buttons (PRO)
Button definitions are global and live in Administration → Enhanced Problems – the URL of a ticket system is infrastructure, not dashboard decoration. A widget then only chooses which of them to show. The menu is shown only to users whose Zabbix role allows acknowledging problems, and the server checks the same permission again when a button is pressed.
| Part of the definition | What it holds |
|---|---|
| Send from | Frontend server (the default; headers with credentials never leave the server), Browser (called from the operator’s own session) or Open in a dialog (the address is shown in an overlay above the dashboard – for a prefilled form or a runbook). |
| Request | URL, Query fields, Request type (GET/POST/PUT), Headers, Request body, Required status codes, Timeout. |
| Before it is sent | Enable user input with a prompt, a type (free string or a dropdown), a default and a validation rule; the value lands in {MANUALINPUT}. Enable confirmation and its question. |
| After the answer | Read from response – a path into JSON (result.ticket.id), a regular expression, or a header (header:Location); each row becomes a {RESPONSE.id} macro. Show to operator, Note on the problem, Follow-up button. |
| Macros | {EVENT.ID}, {EVENT.NAME}, {EVENT.SEVERITY}, {EVENT.TIME}, {EVENT.COUNT}, {EVENT.LAST}, {HOST.NAME}, {HOST.HOST}, {TRIGGER.ID}, {EVENT.TAGS.<name>}, {USER.USERNAME}, {USER.NAME}, {USER.SURNAME}, {USER.FULLNAME}, {MANUALINPUT}, {DATE}, {TIME}, {DATETIME.ISO}. |
Where to get it?
You will find the widget in our product catalog, where you can read more about both editions and how to get the product. After the purchase, your licence and the install commands are waiting in the customer portal.