gaugeMAX
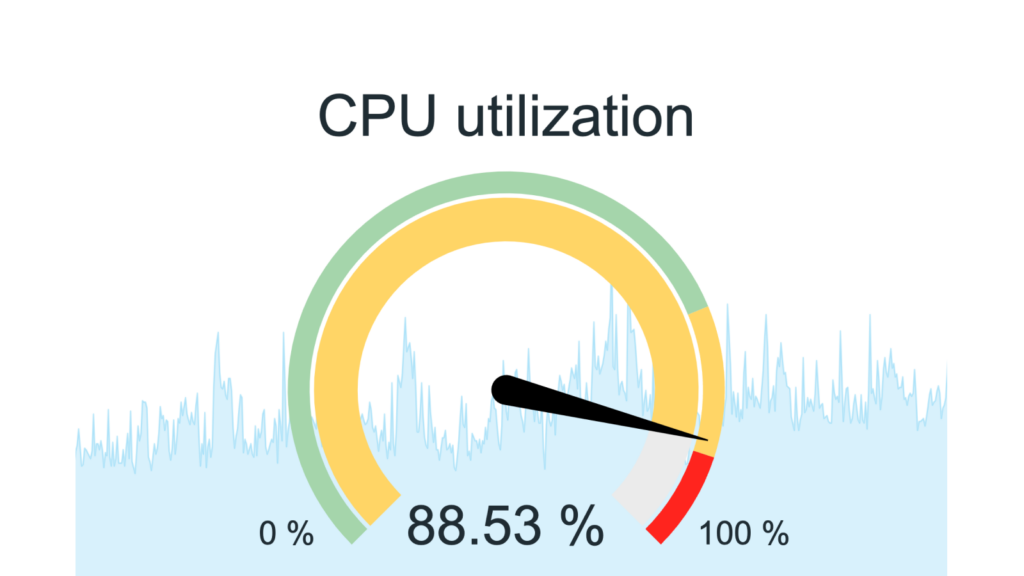
This widget enhances the “Gauge” widget by adding a historical display with a background graph. The widget shows the current value prominently, while the graph in the background visualizes historical data.
Editions
Free
99 $
All features of ‘Gauge’ widget
Graph in the background visualizes historical data
Customizable graph settings
├ Line, Staircase, and Bar graph types
├ Adjustable graph width
├ Graph transparency control
├ Fill level adjustment
├ Color selection for graph in the background
├ Aggregation function (e.g., average)
├ Custom aggregation intervals
├ Handling of missing data
├ Customizable time period for data display
├ Min and Max Y-axis customization
Editions
Free
All features of ‘Gauge’ widget
Graph in the background visualizes historical data
Customizable graph settings
├ Line, Staircase, and Bar graph types
├ Adjustable graph width
├ Graph transparency control
├ Fill level adjustment
├ Color selection for graph in the background
├ Aggregation function (e.g., average)
├ Custom aggregation intervals
├ Handling of missing data
├ Customizable time period for data display
├ Min and Max Y-axis customization
99 $
All features of ‘Gauge’ widget
Graph in the background visualizes historical data
Customizable graph settings
├ Line, Staircase, and Bar graph types
├ Adjustable graph width
├ Graph transparency control
├ Fill level adjustment
├ Color selection for graph in the background
├ Aggregation function (e.g., average)
├ Custom aggregation intervals
├ Handling of missing data
├ Customizable time period for data display
├ Min and Max Y-axis customization
Software distribution
Distribution & Repository access
Editions labeled as Free are openly accessible through our public Git repository. Premium editions (like Pro and Enterprise) are delivered through our secure private Git repository, which serves as the central distribution point for our maintained software. Upon purchase, you’ll receive immediate access credentials to this repository, where you can download your products, access documentation, and get all future updates compatible with your Zabbix LTS installation.
Access & Ownership
When you purchase a paid edition, you gain lifetime access to the product version you download. The purchase includes one full year of updates and maintenance, during which we ensure compatibility with the latest minor version of Zabbix LTS. Our development team continuously maintains and improves the products, providing regular updates, security patches, and new features.
Subscription model
Our subscription is designed to auto-renew annually, ensuring uninterrupted access to our private repository where we maintain the latest versions of our products. This subscription model guarantees that you always have access to the most recent updates, security fixes, and feature enhancements. While you retain permanent access to your downloaded version, maintaining an active subscription ensures you benefit from ongoing product improvements and compatibility updates. For detailed subscription terms, please refer to our Terms and Conditions.
Configuration page
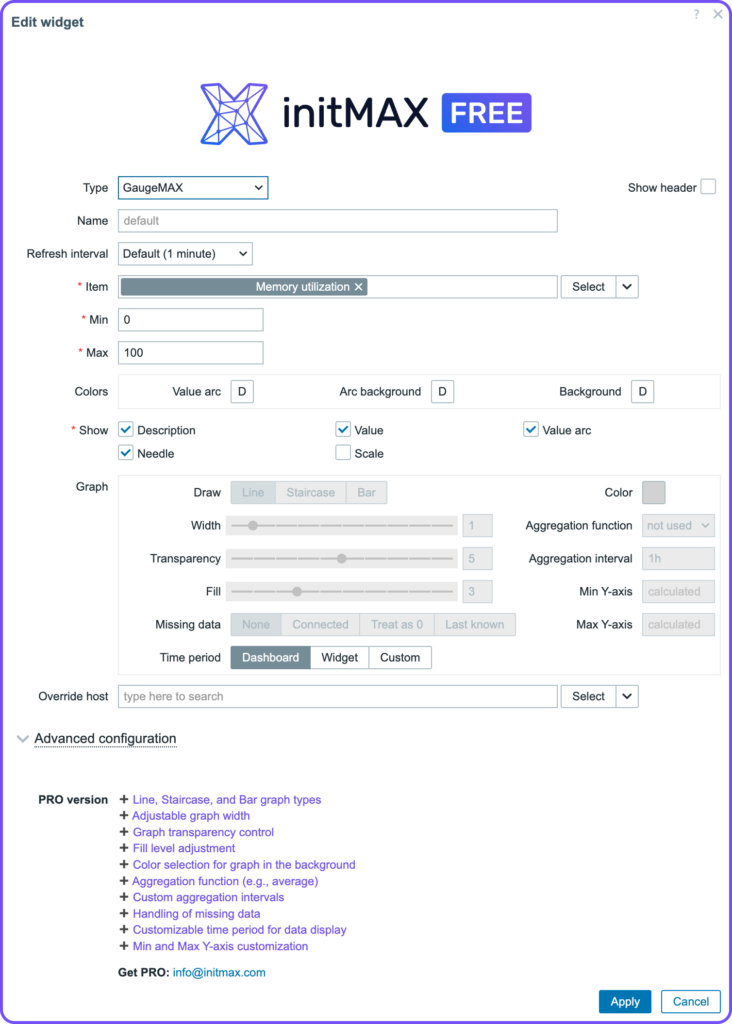
| Field | Description |
| Width | Adjust the thickness of the graph lines. |
| Transparency | Set the transparency level of the graph to better integrate with the widget’s background. |
| Fill | Adjust the fill level under the graph line for better visual distinction. |
| Color | Customize the color of the graph to match your dashboard theme. |
| Aggregation Function | Use different functions (e.g., average) to aggregate data points. |
| Aggregation Interval | Define custom intervals for data aggregation. |
| Missing Data | Choose how to handle missing data points (e.g., none, connected, treat as 0, last known). |
| Time Period | Set specific time periods for data display in the graph (e.g., Dashboard, Widget, Custom). |
| Min Y-axis | Define custom minimum values for the Y-axis. |
| Max Y-axis | Define custom maximum values for the Y-axis. |
Instalation
- Connect to your Zabbix frontend server (perform on all frontend nodes)
- Navigate to the
ui/modules/directory (uiis typically located at/usr/share/zabbix/)
cd /usr/share/zabbix/modules/- Clone repository on your server
git clone https://git:<<YOUR-TOKEN>>@git.initmax.cz/initMAX-Public/Zabbix-UI-Widgets-gaugeMAX-PRO.gitChange the owner of directory to your web user with chown
Choose default OS user
- nginx
chown nginx:nginx ./Zabbix-UI-Widget-gaugeMAX- apache
chown apache:apache ./Zabbix-UI-Widget-gaugeMAX- www-data
chown www-data:www-data ./Zabbix-UI-Widget-gaugeMAX- Go to Zabbix frontend menu -> Administration -> General -> Modules

- Use the Scan directory button on the top

- Enable the newly discovered module

- Done

- Use it and enjoy!
Similar products
headerMAX
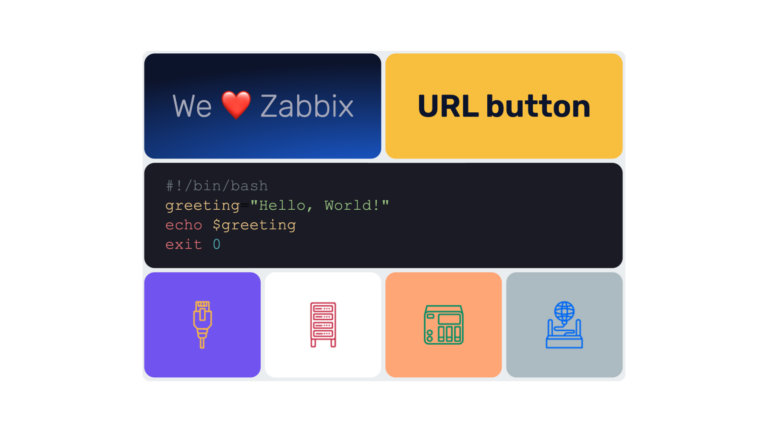
Zabbix widget that allows users to create section headers, embed images, or add buttons with customisable URL links in the dashboard UI.
itemMAX
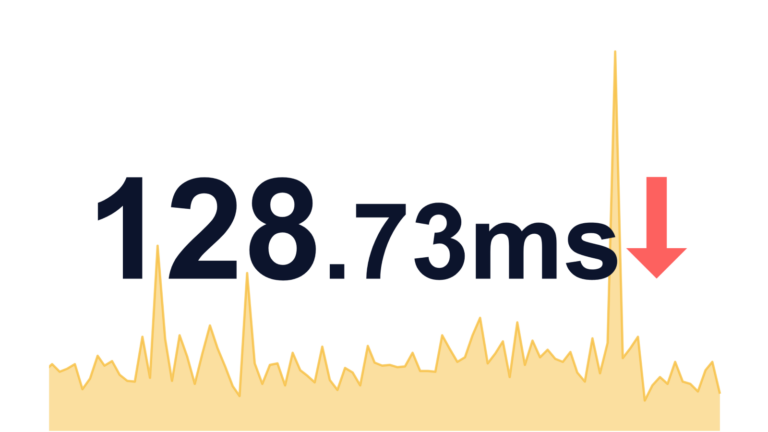
Extends the Item value widget with a background graph. Clearly and concisely displays current status information along with historical data visualization.
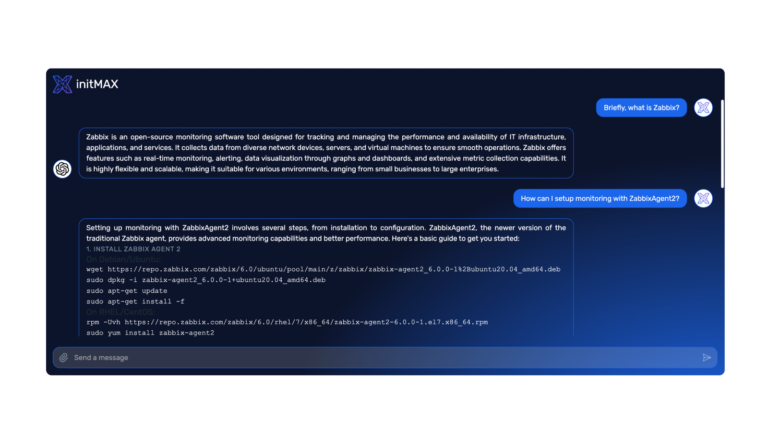
ChatGPT
The ChatGPT widget integrates AI capabilities into your Zabbix dashboard, allowing interaction with OpenAI models directly from the widget.
FAQ
You will need to have Zabbix 7.0 and PHP version 8.0 installed and running. In terms of hardware, you need any device that will run Zabbix correctly.
You will receive an email confirmation of the successfully paid order and an invoice for the purchased product. You will also find a link to access and manage your subscriptions. You will also receive an email with a link to the initMAX GitLab where you can find the purchased product. You will need to set a new password first if it is the first your product purchased from initMAX. Regardless if you already have a GitLab account for other purposes. To do this, go to the link: https://git.initmax.com/users/sign_in and press the Forgot your password? enter the email you entered when you placed your order and press the Reset password button. You will receive an email with a link to set a new password. Then log in via https://git.initmax.com/users/sign_in with the new password and the email you entered when you placed your order. You can also click directly on the link of the product you purchased, which will be sent to you in the order confirmation email, to log in there. You can now access and download the purchased product.
Select the desired widget on the product page, which also has a paid version. You can try out the DEMO version of each paid product and then purchase the PRO version, which adds more features to the widget. You click on the Get widget and Get PRO button, go through the checkout where you need to agree to the terms of purchase and other necessary. You proceed to the cart where you pay for the product. You can pay by card, Google Pay or Apple Pay if you have an Apple device. Payment is facilitated by FastSpring. After payment, you will receive a confirmation email with the necessary details to log in to Gitlab where you can download the purchased product. You’ll also receive an invoice for your order and access to your account, where you can see all your orders and cancel your auto-renewal subscription. The products are sold by subscription for 1 year. This is 1 license for 1 user, which is tied to a specific email.

