In this article, we will show you how to easily install and configure Zabbix Java Gateway, with additional example of Tomcat monitoring.
Selection of the operating system
The guide includes instructions for RHEL platforms on version 9, where you only need to adjust the repositories if necessary. The guide for Debian is prepared for version 12, which is currently the latest supported version.
What is Zabbix Java Gateway?
- Standalone component of Zabbix for monitoring Java applications using JMX (Java Management Extensions).
- Enables Zabbix to collect metrics directly from Java applications.
- Must be connected to a Zabbix server or Zabbix proxy.
- Written in Java (requires Java Runtime Environment).
Deployment Considerations
Only one Java Gateway per Zabbix Server or Proxy.
(For multiple Java Gateways, deploy additional Zabbix Proxies (active/passive).)
Communication between Zabbix components and Java Gateway cannot be encrypted.
As of version 7.4, it’s the last remaining internal Zabbix communication channel without encryption.
Communication from Java Gateway to monitored Java applications can be secured (encrypted and/or authenticated).
Version alignment is critical – Zabbix Java Gateway must match the Zabbix server/proxy version.
Don’t forget to explicitly define allowed IP addresses in the Java Gateway configuration (zabbix_java_gateway.conf).
Installation Best Practices
Java Runtime Environment (JRE) is automatically installed alongside Zabbix Java Gateway (is Java-based).
No dedicated template provided by Zabbix for the Java Gateway itself – use the generic Java template.
Custom libraries (JAR files) might be needed for specific Java server, typically located in the application’s bin directory.
Proper configuration of Java pollers is crucial – settings must be aligned on both:
- Zabbix Server/Proxy (Java pollers count)
- Zabbix Java Gateway (start pollers)
Recommended practice: Deploy Zabbix Java Gateway alongside Zabbix Server or Proxy on the same machine for enhanced security
Installation and Self Monitoring
Now, when we are aware of basic description of what Zabbix Java Gateway is, and we have learned it’s terminology, we can proceed with the installation.
First, we will exclude any installation packages related to Zabbix from the EPEL repository, assuming it is installed.
We do this by adding the following line to the end of the /etc/yum.repos.d/epel.repo file:
[epel]
...
excludepkgs=zabbix*
We will add the Zabbix repositories and clear the installation cache. Replace version 7.0 with your version (e.g., 8.0, 6.0, 7.2, …)
rpm -Uvh https://repo.zabbix.com/zabbix/7.0/rocky/9/x86_64/zabbix-release-latest.el9.noarch.rpm
dnf clean all
And now we can proceed with Zabbix Java Gateway installation
dnf install zabbix-java-gatewayWe will add the Zabbix repositories and clear the installation cache. Replace version 7.0 with your version (e.g., 8.0, 6.0, 7.2, …)
wget https://repo.zabbix.com/zabbix/7.0/debian/pool/main/z/zabbix-release/zabbix-release_latest_7.0+debian12_all.deb
dpkg -i zabbix-release_latest_7.0+debian12_all.deb
apt update
And now we can proceed with Zabbix Java Gateway installation
apt install zabbix-java-gatewayConfiguration File Locations
- Zabbix Java Gateway
/etc/zabbix/zabbix_java_gateway.conf - main configuration file
/etc/zabbix/zabbix_java_gateway_logback.xml - logging configuration- Zabbix Server
/etc/zabbix/zabbix_server.conf- Zabbix Proxy
/etc/zabbix/zabbix_proxy.confEnabling Zabbix Java Gateway
After installation, enable Java monitoring in your server or proxy by editing configuration file
nano /etc/zabbix/zabbix_server.confAnd editing these parameters, where
JavaGateway: IP or DNS of Zabbix Java Gateway
JavaGatewayPort: communication port
StartJavaPollers: number of Java pollers started on Zabbix server/proxy
JavaGateway=127.0.0.1
JavaGatewayPort=10052
StartJavaPollers=5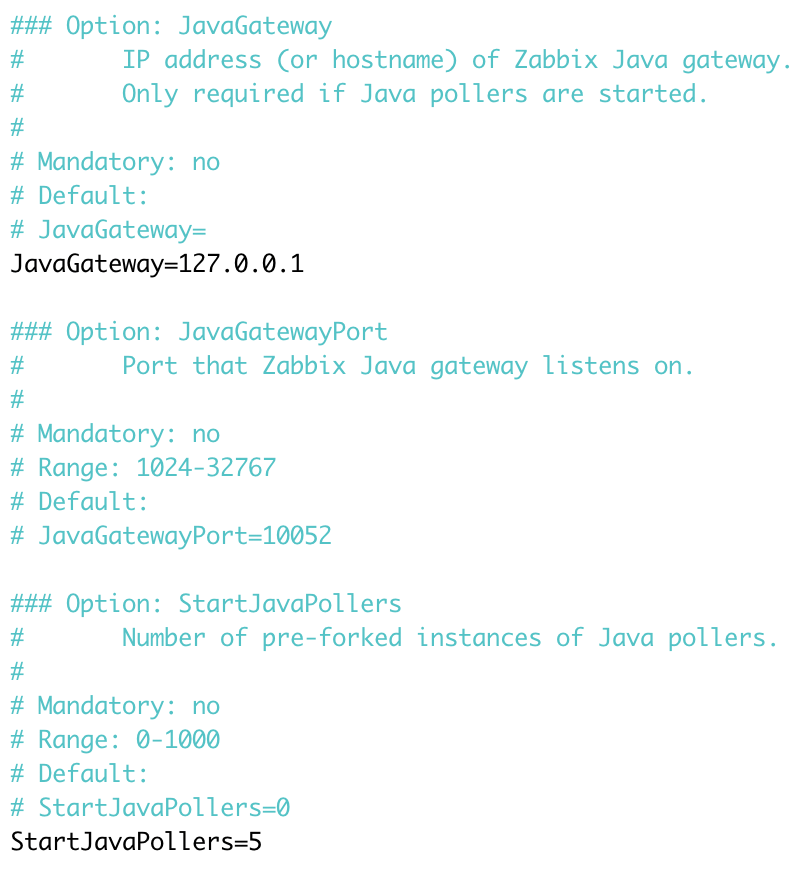
StartJavaPollers is important parameter that you always need to keep in mind.
- Default is disabled (0), Java monitoring off
- Recommended starting value: 5 pollers
- If changed, align this number also in Java Gateway configuration
- When using multiple Zabbix servers/proxies with one gateway, sum their poller counts
After final configuration, don’t forget to restart Zabbix server component
systemctl restart zabbix-serverEnabling Java Gateway Self Monitoring
Edit Zabbix Java Gateway configuration file
nano /etc/zabbix/zabbix_java_gateway.confSpecial monitoring section (self-monitoring):
Uncomment the following line to enable built-in JMX monitoring of the Gateway itself (JAVA_OPTIONS):
JAVA_OPTIONS="$JAVA_OPTIONS -Dcom.sun.management.jmxremote -Dcom.sun.management.jmxremote.port=12345
-Dcom.sun.management.jmxremote.authenticate=false -Dcom.sun.management.jmxremote.ssl=false -
Dcom.sun.management.jmxremote.registry.ssl=false"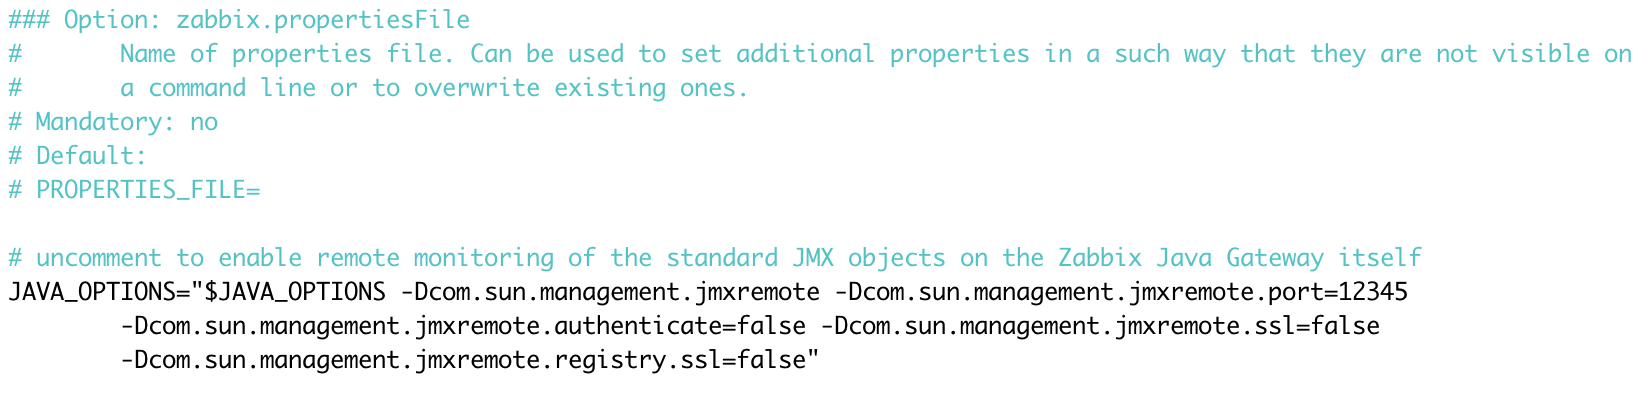
Important: Ensure each Java option (-Dcom…) starts immediately after space, with no extra spaces inside!
Apply the new settings, start the Zabbix Java Gateway, and enable it to start automatically after reboot.
systemctl enable zabbix-java-gateway.service --nowVerifying and monitoring setup
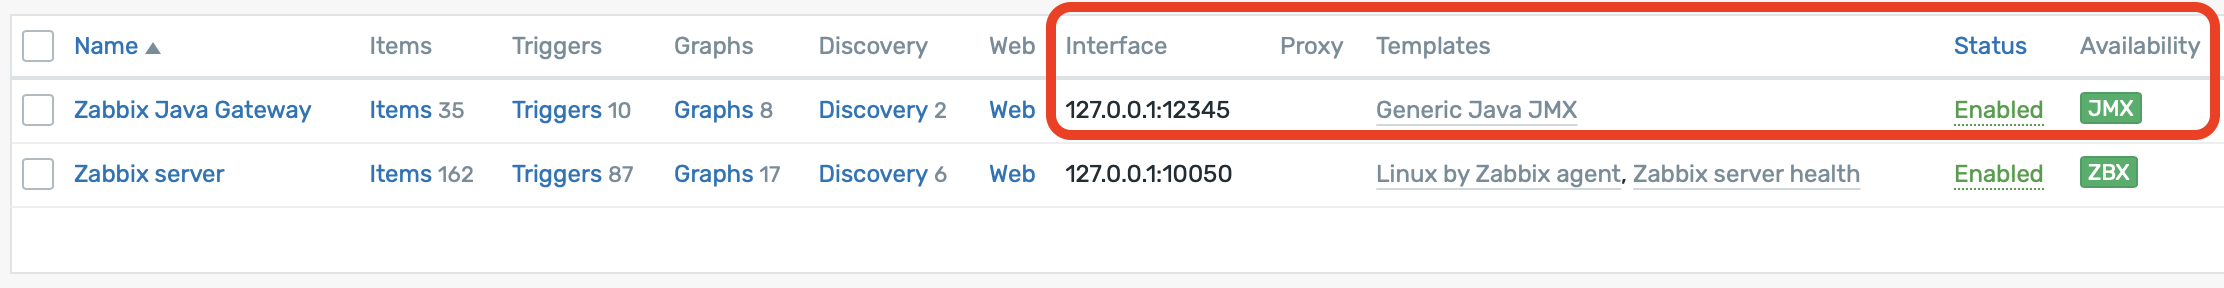
Create a host for Zabbix Java Gateway itself or use an existing host.
- Add a new JMX-type interface.
- Apply built-in template: Generic Java JMX
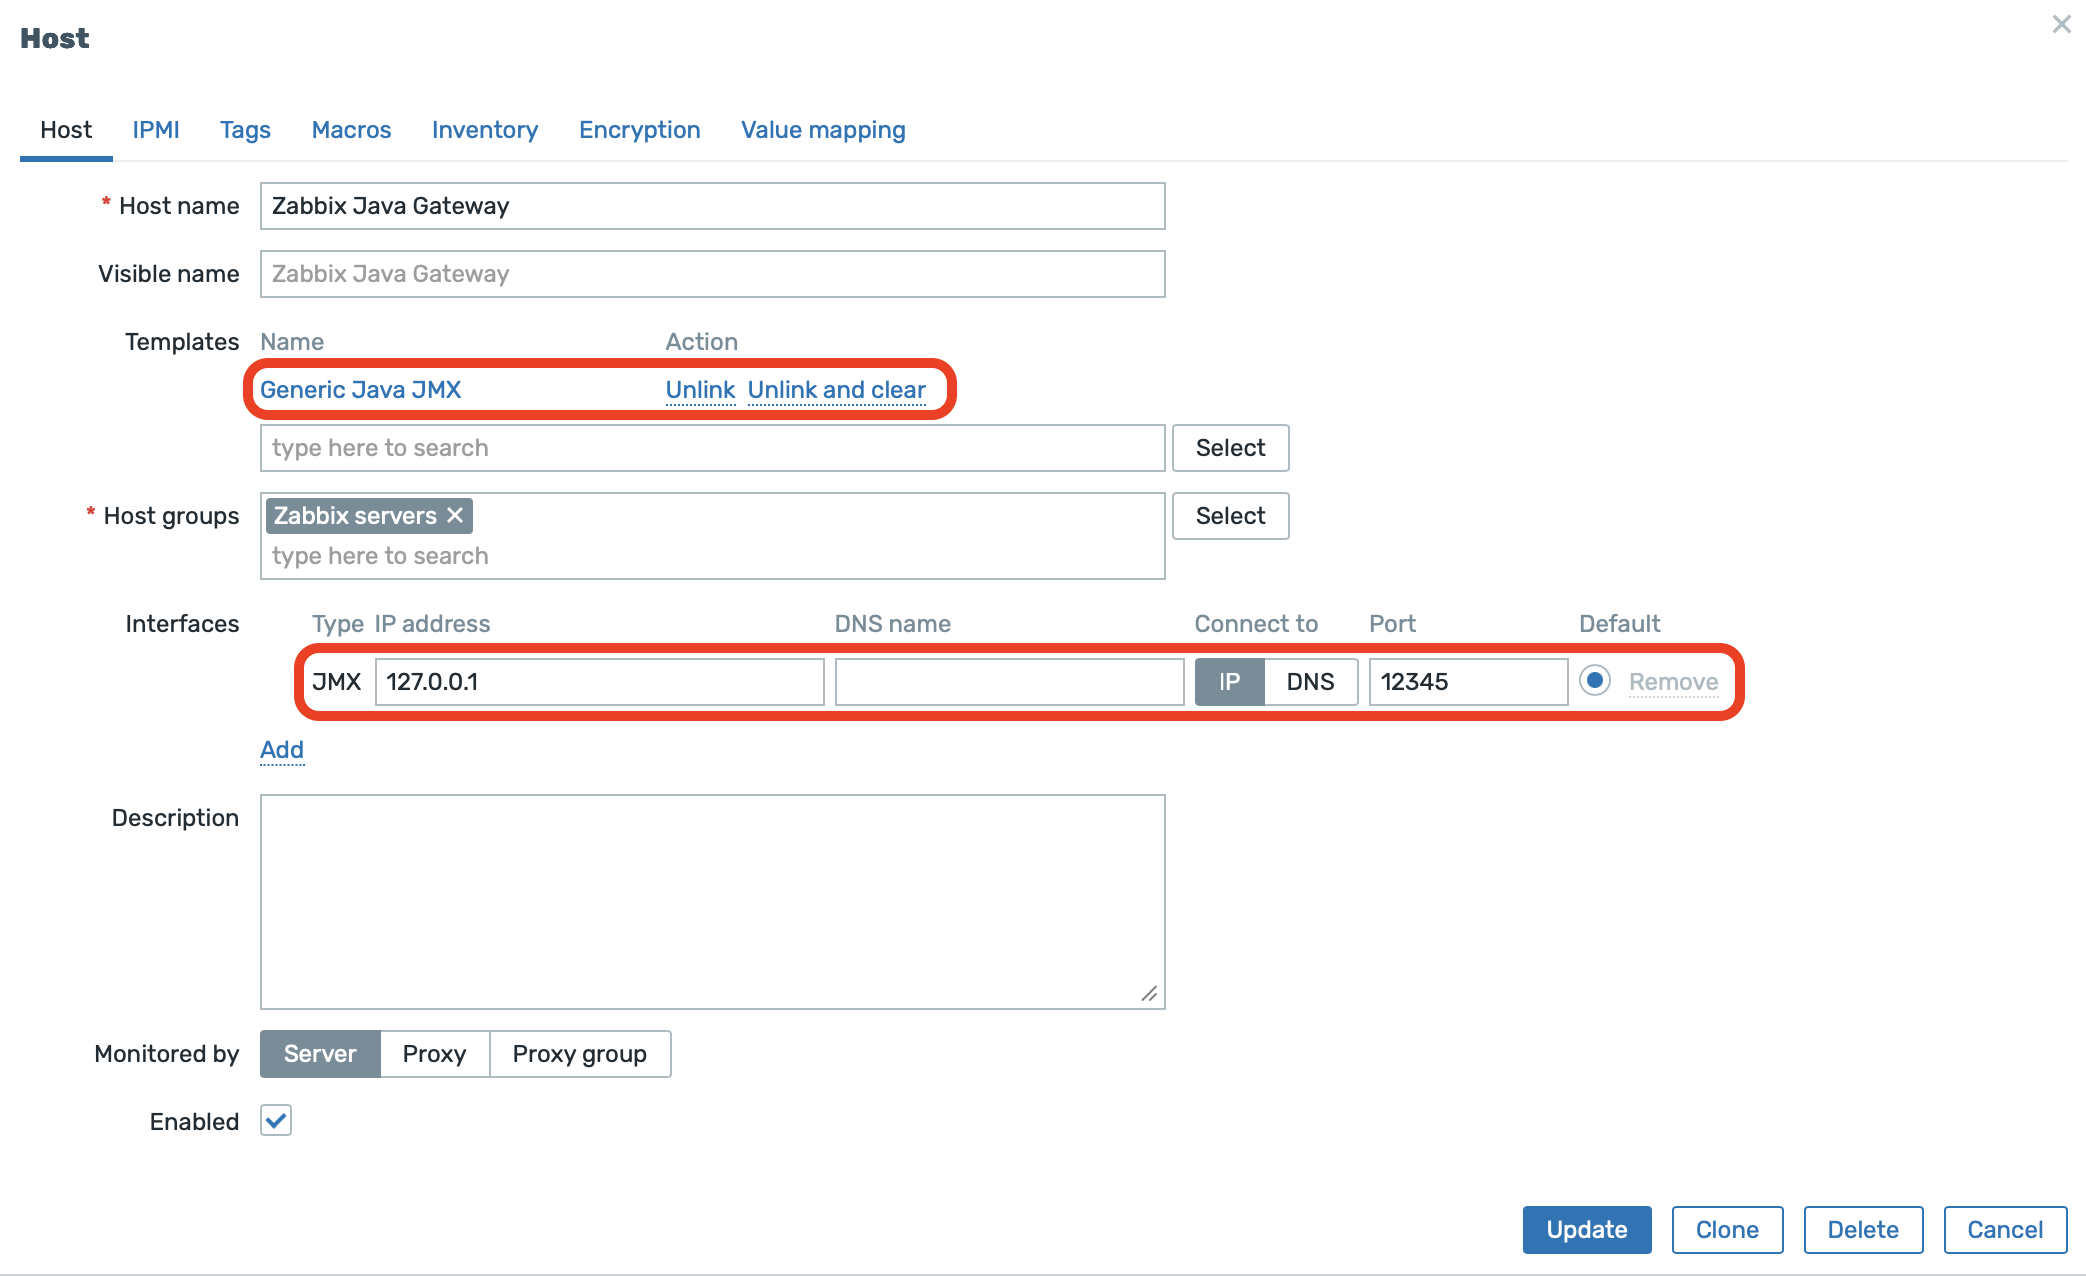
After short delay, JMX icon turns green. Java Gateway is now ready and monitored.
Tomcat Monitoring – Installation & Setup
For this example monitoring setup, we will also install Tomcat and other required packages.
Please note that the following example is performed on Rocky Linux 9. In your environment, Tomcat is most likely already installed (or provided by your existing application setup).
dnf install tomcat tomcat-webapps tomcat-admin-webapps tomcat-docs-webapp
After installing Tomcat, we need to enable JMX monitoring with authentication to ensure Security.
Edit /etc/tomcat/tomcat.conf
nano /etc/tomcat/tomcat.confAdd the following (don’t forget to replace the IP address — it must be the monitored host, not the Zabbix server or the Java Gateway!)
In our case, the parameter -Djavax.sql.DataSource.Factory=org.apache.commons.dbcp.BasicDataSourceFactory was already predefined, so we place the additional parameters immediately after it. Pay attention to the correct quotation marks and line continuation/indentation using \.
# Set default javax.sql.DataSource factory to apache commons one. See rhbz#1214381
JAVA_OPTS="-Djavax.sql.DataSource.Factory=org.apache.commons.dbcp.BasicDataSourceFactory \
-Dcom.sun.management.jmxremote \
-Dcom.sun.management.jmxremote.port=9010 \
-Dcom.sun.management.jmxremote.rmi.port=9010 \
-Dcom.sun.management.jmxremote.ssl=false \
-Dcom.sun.management.jmxremote.authenticate=true \
-Dcom.sun.management.jmxremote.password.file=/etc/tomcat/jmxremote.password \
-Dcom.sun.management.jmxremote.access.file=/etc/tomcat/jmxremote.access \
-Djava.rmi.server.hostname=185.74.63.152 \
-Djava.net.preferIPv4Stack=true"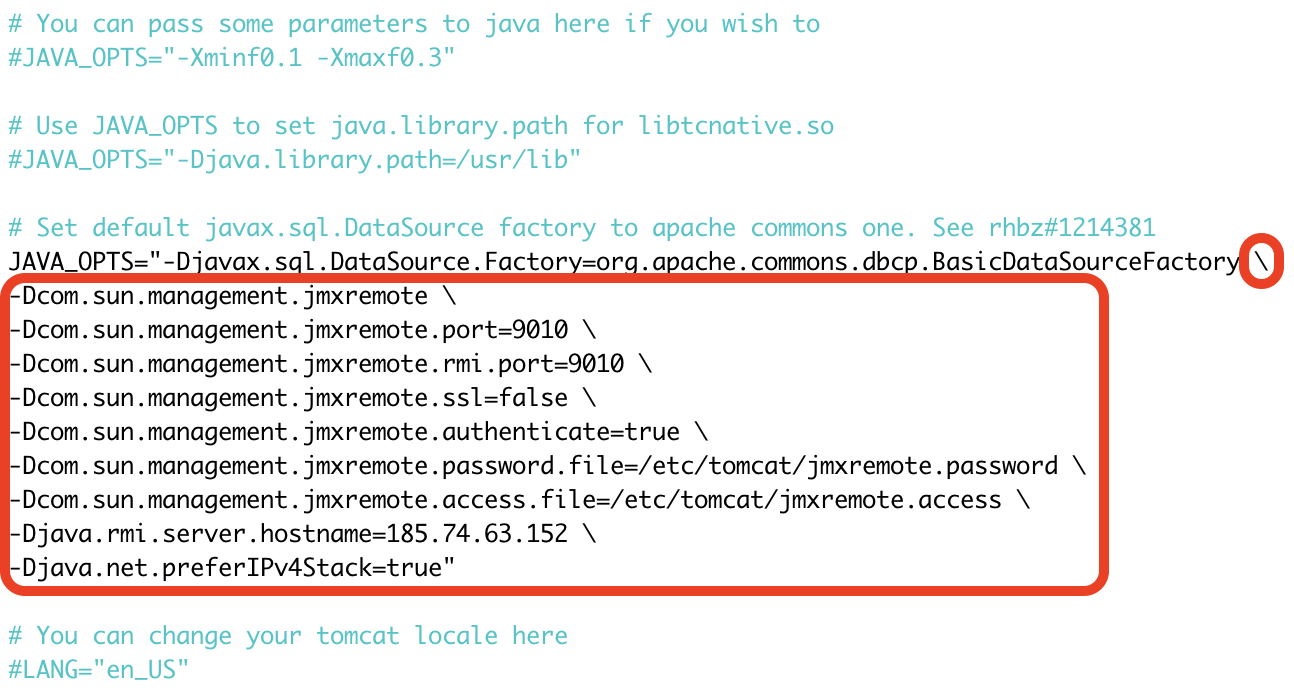
To create JMX access roles and passwords, we need to create or edit following files
Edit or create /etc/tomcat/jmxremote.access:
nano /etc/tomcat/jmxremote.accessIn this file, we will define a user role with the required permissions
monitorRole readonly
controlRole readwrite
Edit or create /etc/tomcat/jmxremote.password:
nano /etc/tomcat/jmxremote.passwordIn this file, we will define passwords for the users configured for JMX access
monitorRole Password1
controlRole Password2
Set the correct permissions for security (the user on your system may be different — we’re using the same user that runs our Tomcat service)
chmod 600 /etc/tomcat/jmxremote.*
chown tomcat:tomcat /etc/tomcat/jmxremote.*
After adjusting all configuration files as recommended, don’t forget to restart the Tomcat service
systemctl restart tomcat.service
And open firewall port (9010/tcp), if required
firewall-cmd --permanent --add-port=9010/tcp
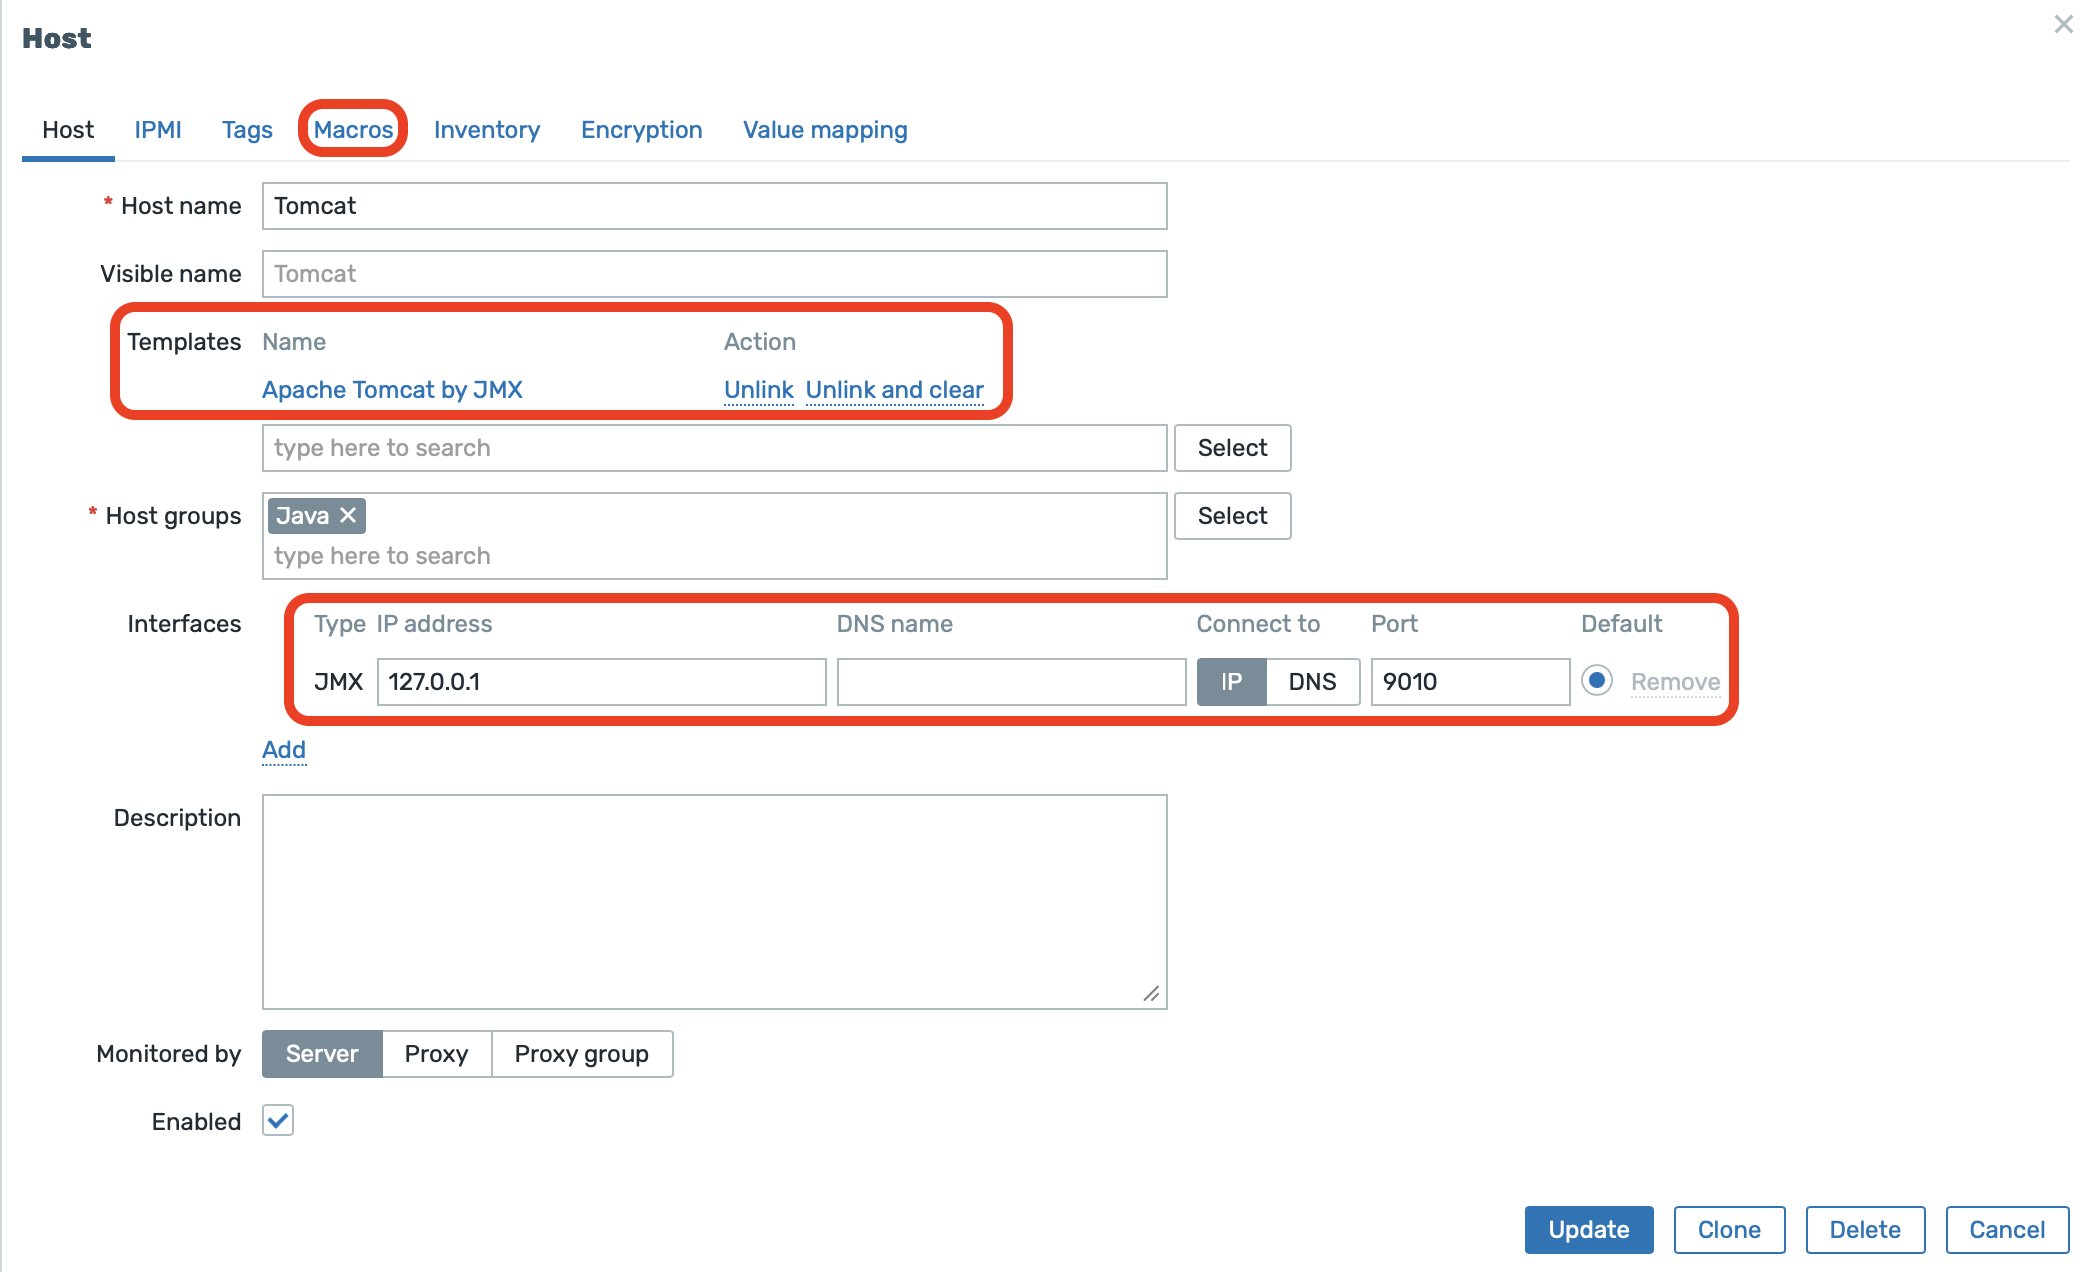
firewall-cmd --reloadCreate a host in Zabbix frontend for Tomcat monitoring.
- Link a template Apache Tomcat by JMX
- Set the correct Tomcat IP or DNS address and port (make sure the firewall allows access from the Zabbix Java Gateway). In our case, Tomcat, the Zabbix Server, and the Zabbix Java Gateway are running on the same host, so we use localhost. In practice, this setup is rather unlikely.
- Set the correct macro (see the next screenshot)
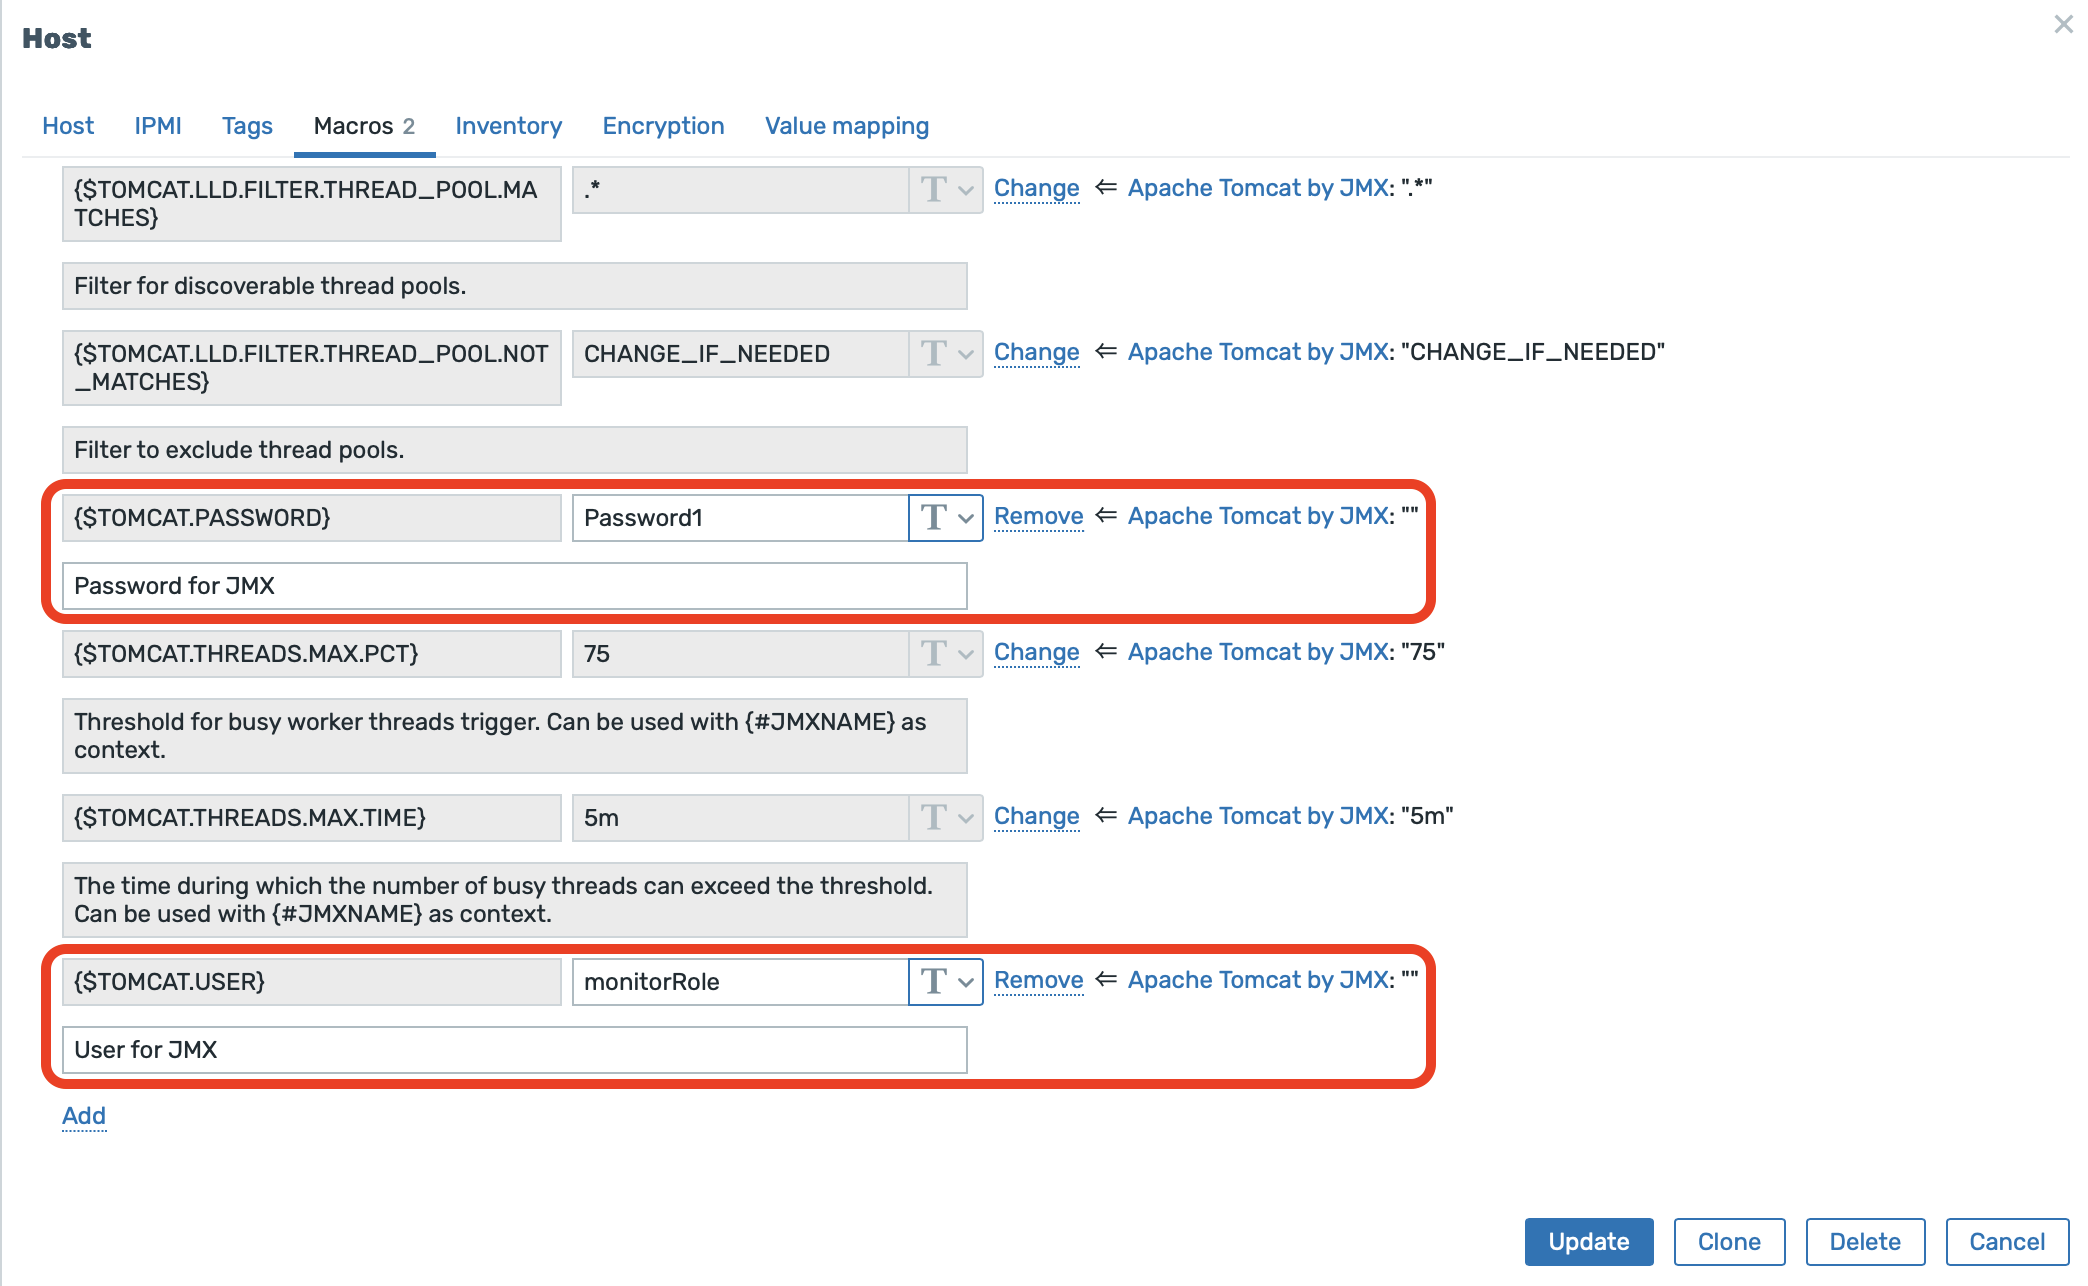
Zabbix templates use user macros for the username and password. Click Macros, then select Inherited and host macros
{$TOMCAT.PASSWORD}— in our case, this isPassword1(best practice: mark this value as Secret text){$TOMCAT.USER}— our user ismonitorRole
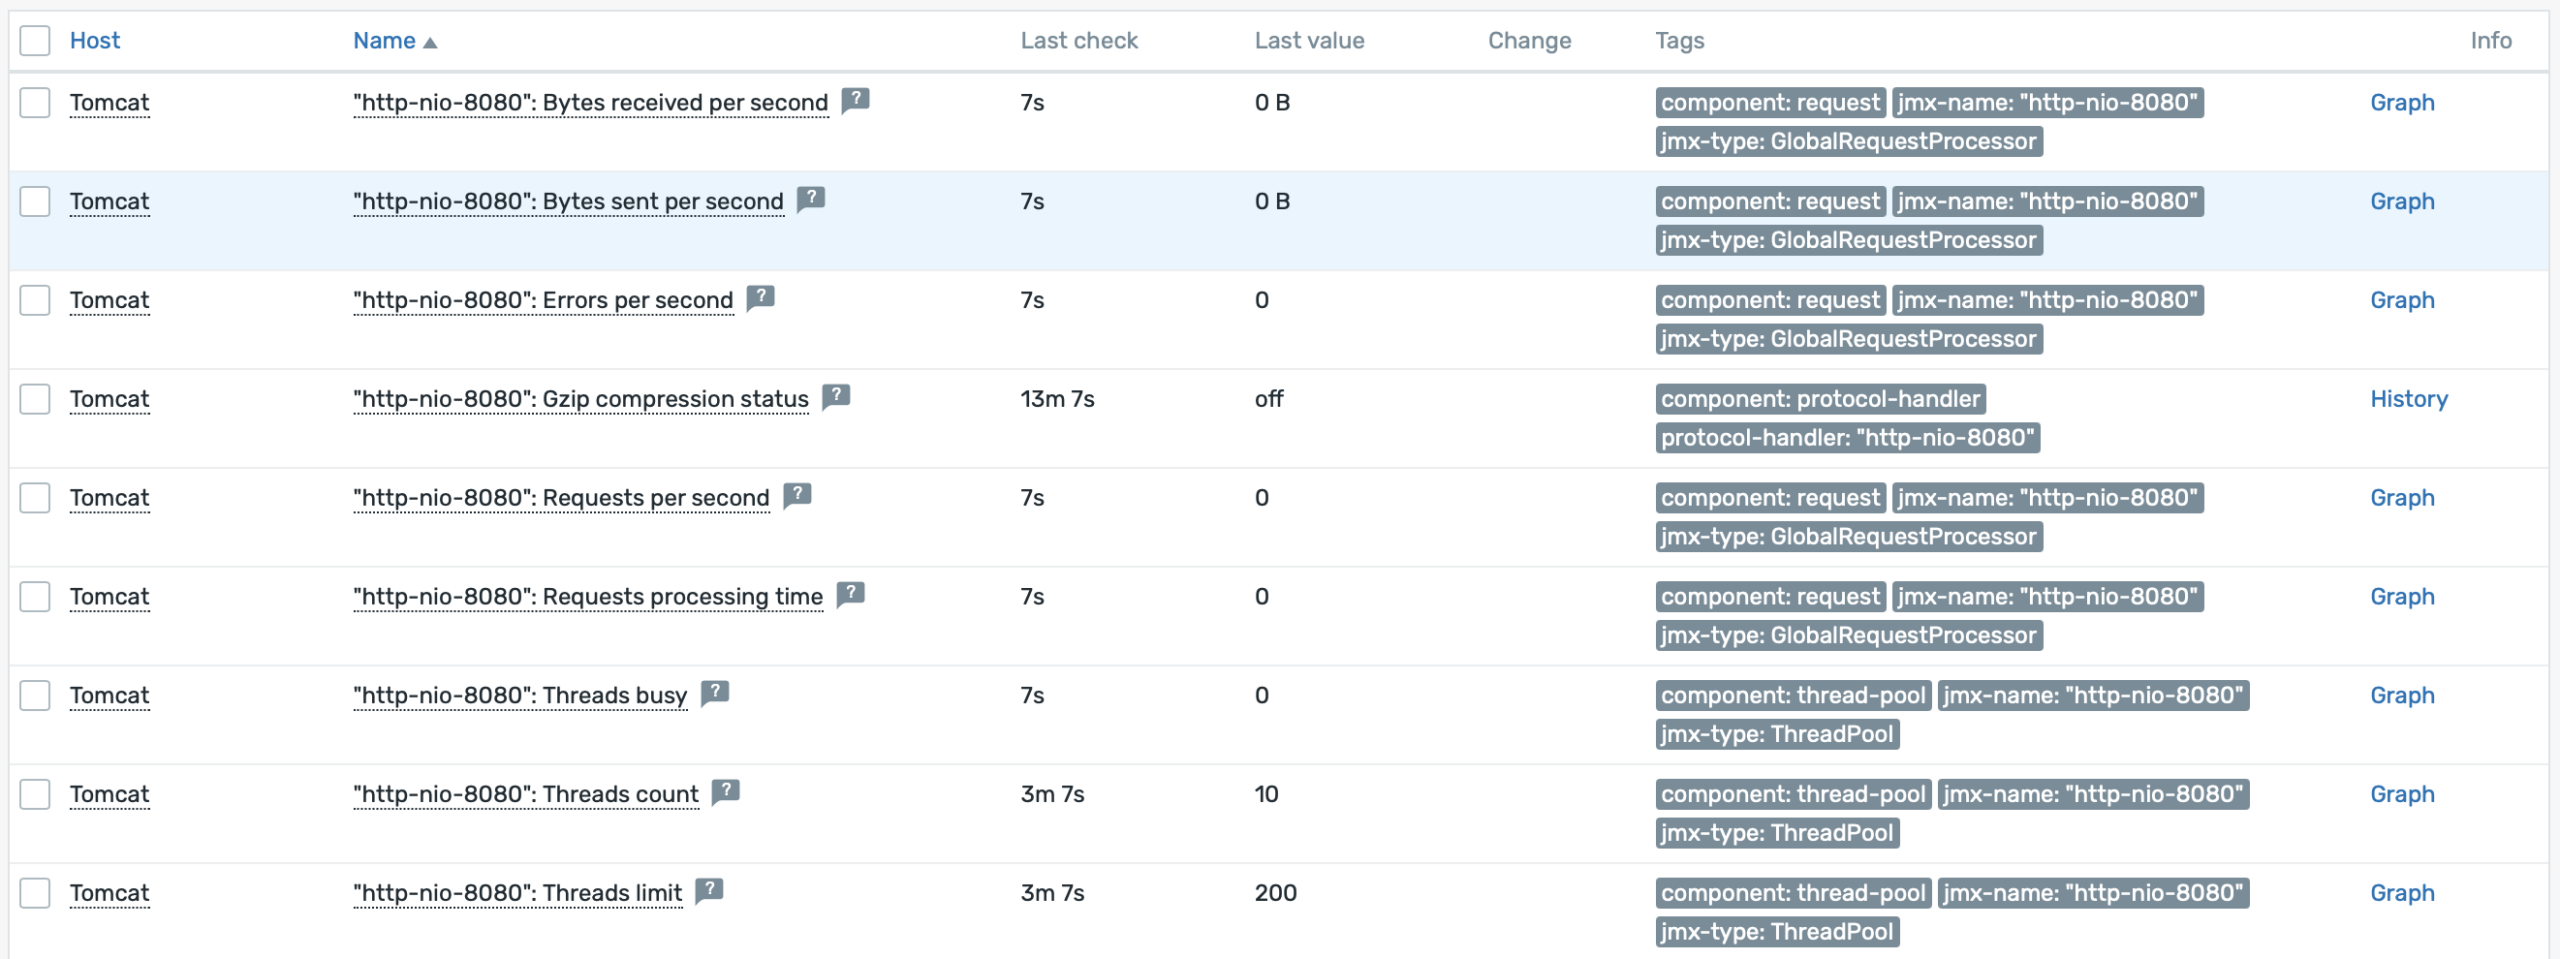
At this point, your monitoring items on the Tomcat host should start receiving data.
The template also contains Low-Level Discovery (LLD).
Closing tips and DB monitoring
- For quick debugging, we recommend using jconsole (part of the JDK package), which you can run from your desktop
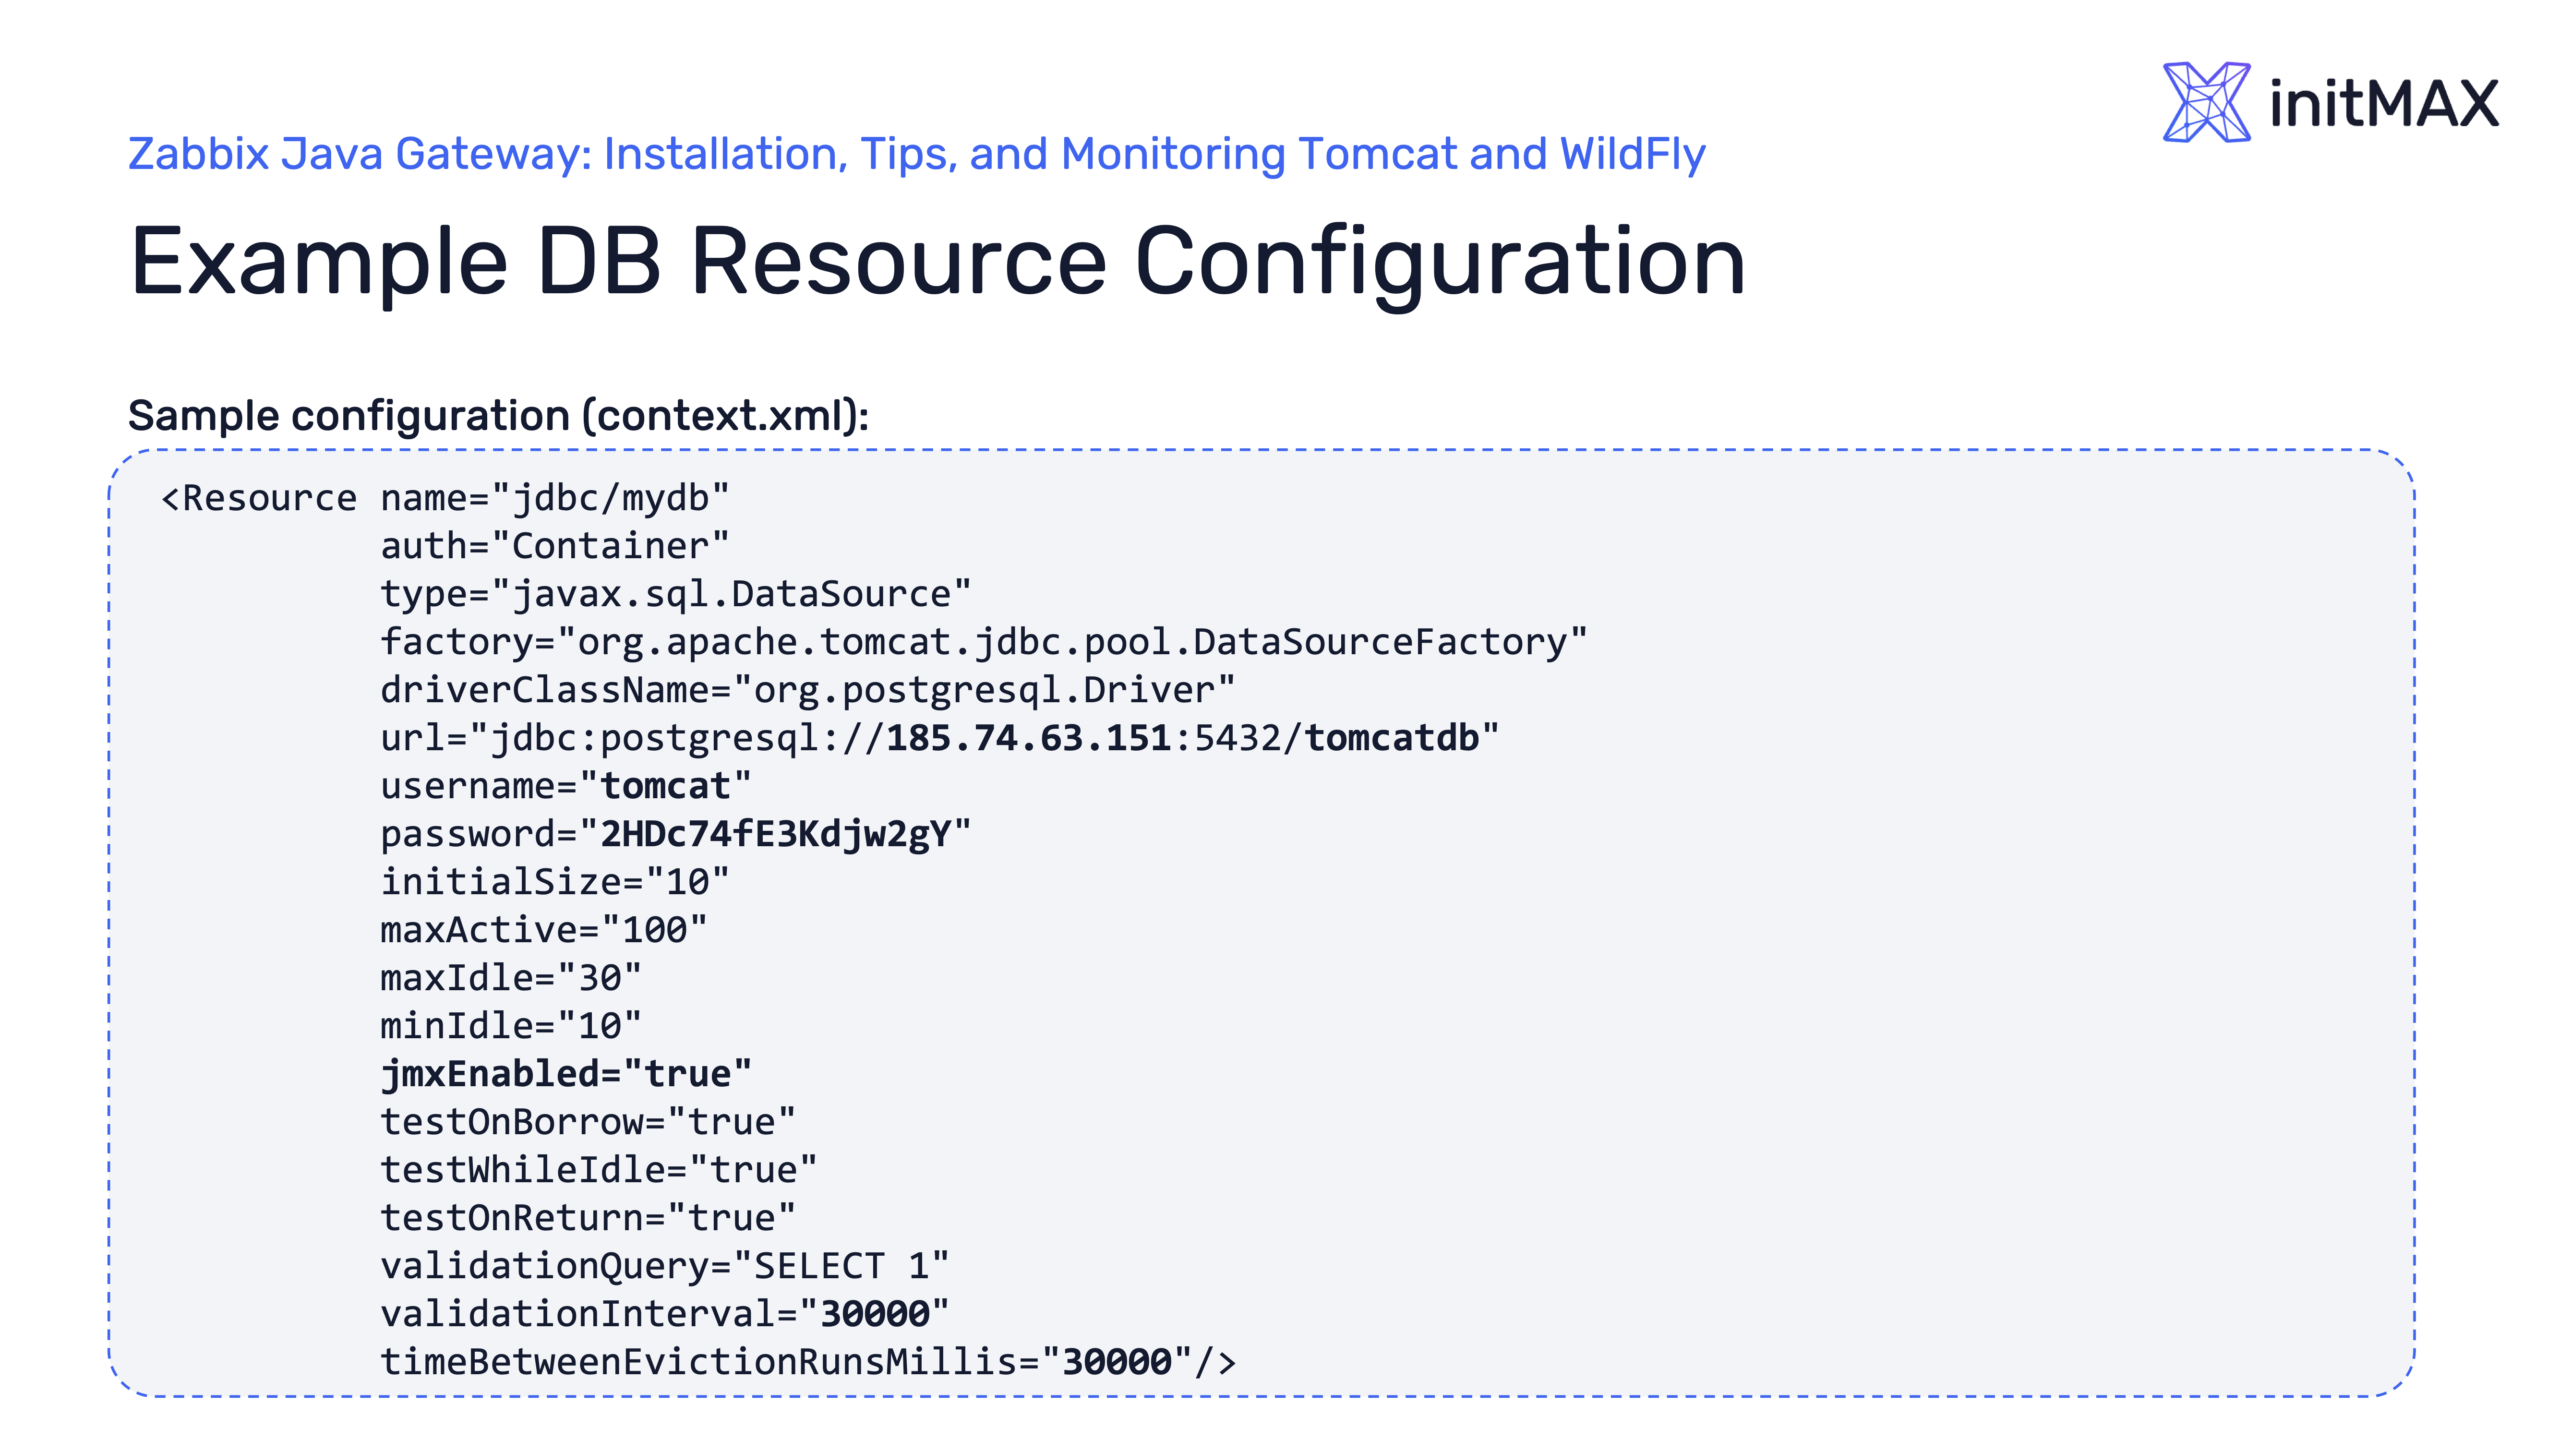
- If you don’t see metrics you’re interested in (for example, DB connection pool statistics), you may need to enable them at the driver/pool level. For instance, you can add a parameter like jmxEnabled=”true” – this is commonly defined in context.xml
- Also check our Webinar PDFs for more informations
Give us a Like, share us, or follow us 😍
So you don’t miss anything: