
Description
This module enables a structured approach to dashboard organization. By applying a naming convention during the dashboard creation process, a top-level dashboard group is automatically created along with its associated dashboards. Associated dashboards can be also organized further via tree structure. The top-level group is visually distinct, allowing for easier and faster navigation within the dashboard overview.
Usage examples
The user adds a Living Room Time dashboard to the Time dashboard group under the room section. To achieve this, they use the following naming convention: Time / room / living room ( mind the gaps ). Here, Time designates the top-level dashboard group, room indicates the section, and living room is the dashboard name itself.
There are already dashboards for kitchen and bedroom within the Time dashboard group, as well as corresponding kitchen and bedroom dashboards under the Problems dashboard group (following the same structure as in the Time group).
Naming convention:
“Top level dashboard group”/”section” “dashboard name”.
In the example bellow this translates to ( mind the gaps ):
Time / room / living room
Installation
Repository setup on the server
- Connect to your Zabbix frontend server (perform on all frontend nodes) via SSH
- Navigate to the
/modulesfolder (typically located at/usr/share/zabbix/or/usr/share/zabbix/ui/)
cd /usr/share/zabbix/modules/Clone repository on your server
git clone https://git.initmax.cz/initMAX-Public/Zabbix-UI-Modules-Structured-dashboards.gitChange the ownership of the directory to the user under which your Zabbix frontend is running using the chown command (cat /etc/passwd to find which user was created during installation), some examples:
chown nginx:nginx ./Zabbix-UI-Modules-Structured-dashboards*chown apache:apache ./Zabbix-UI-Modules-Structured-dashboards*chown www-data:www-data ./Zabbix-UI-Modules-Structured-dashboards*Frontend module initialization
Navigate to the Zabbix frontend menu and select: Administration → General → Modules
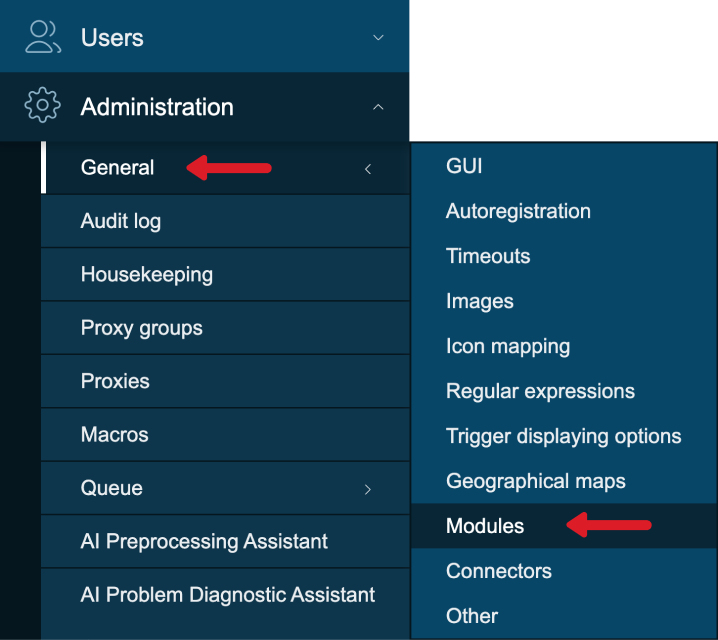
Use the ‘Scan directory’ button at the top
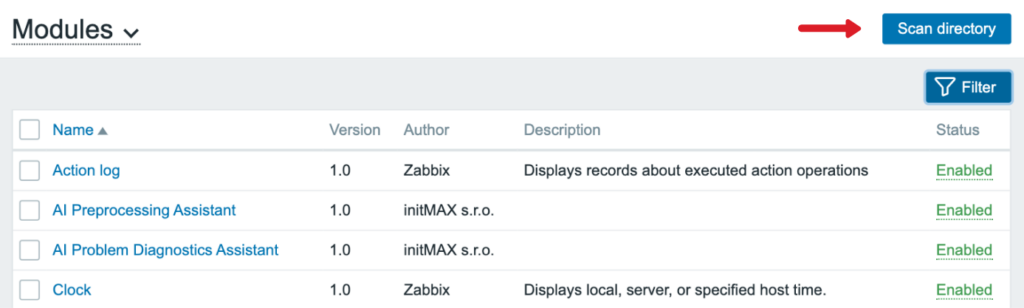
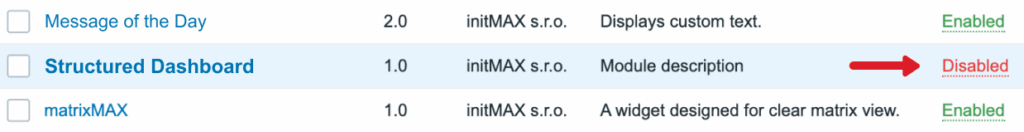
Enable the newly discovered module
The module is available in the menu
Configuration
Enable the module in Administration > Modules section to turn on the functionality. How to organize the dashboards is described in the usage examples section.
Where to get it?
If you’re interested in this module, you can find it in our e-shop. There you’ll learn more about the available versions and how to get the product.