Description
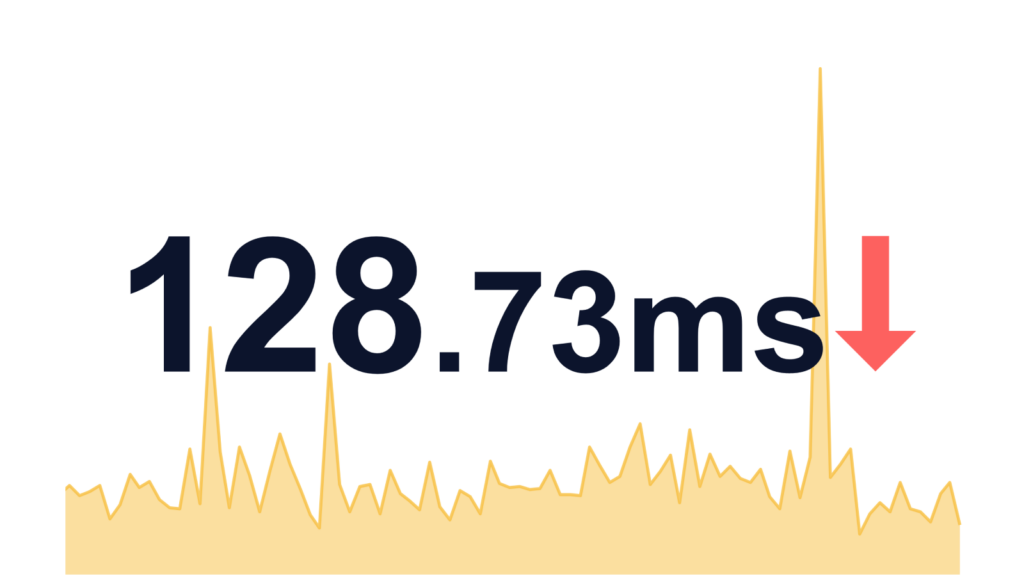
This advanced widget significantly enhances the functionality of the classic Item Value widget by integrating a visualization of historical data directly into the background. The current value is prominently displayed in the foreground, while a compact graph in the background provides valuable context and allows for tracking data evolution over time.
Installation
Repository setup on the server
Connect to your Zabbix frontend server (perform on all frontend nodes) via SSH
Navigate to the /modules folder (typically located at /usr/share/zabbix/ or /usr/share/zabbix/ui/)
cd /usr/share/zabbix/modules/Clone repository on your server:
#FREE:
git clone https://git.initmax.cz/initMAX-Public/Zabbix-UI-Widgets-itemMAX.git
#PRO:
git clone https://git:<<YOUR-TOKEN>>@git.initmax.cz/initMAX-Public/Zabbix-UI-Widgets-itemMAX-PRO.git
Change the ownership of the directory to the user under which your Zabbix frontend is running using the chown command (cat /etc/passwd to find which user was created during installation), some examples:
chown nginx:nginx ./Zabbix-UI-Widget-itemMAX*chown apache:apache ./Zabbix-UI-Widget-itemMAX*chown www-data:www-data ./Zabbix-UI-Widget-itemMAX*Frontend module initialization
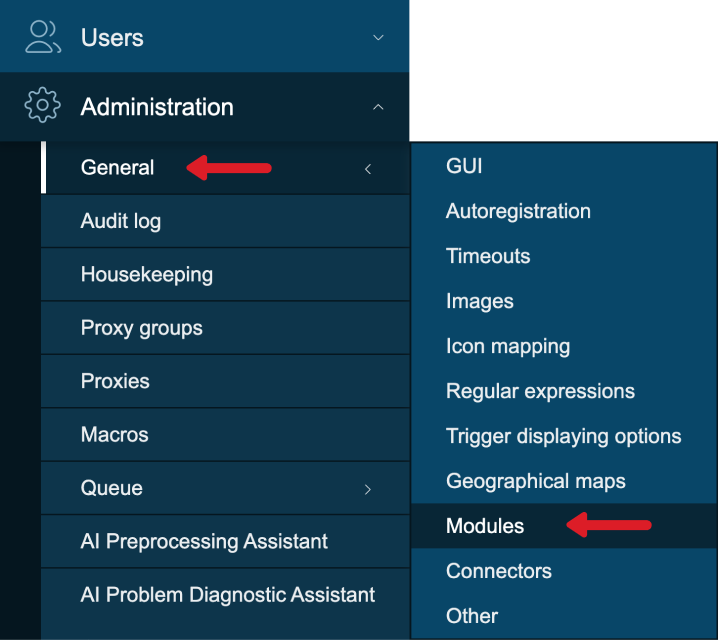
Navigate to the Zabbix frontend menu and select: Administration → General → Modules:

Use the ‘Scan directory’ button on the top:

Enable the newly discovered module/widget:

Module is enabled.

Configuration

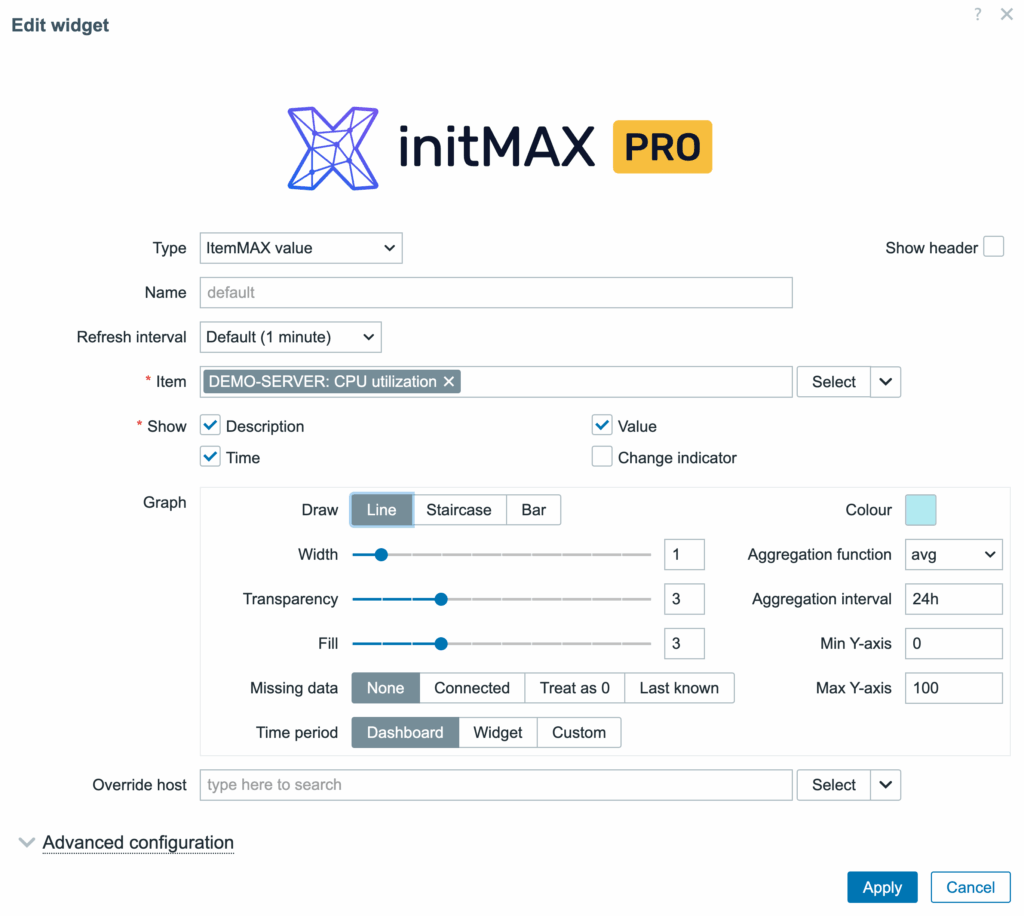
| Field | Description |
| Draw | Select the type of graph: Line, Staircase, or Bar. |
| Width | Adjust the thickness of the graph lines. |
| Transparency | Set the transparency level of the graph to better integrate with the widget’s background. |
| Color | Customize the color of the graph to match your dashboard theme. |
| Aggregation Function | Use different functions (e.g., average) to aggregate data points. |
| Aggregation Interval | Define custom intervals for data aggregation. |
| Missing Data | Choose how to handle missing data points (e.g., none, connected, treat as 0, last known). |
| Time Period | Set specific time periods for data display in the graph (e.g., Dashboard, Widget, Custom). |
| Min Y-axis | Define custom minimum values for the Y-axis. |
| Max Y-axis | Define custom maximum values for the Y-axis. |
| Override host | Allows displaying data from a different host than originally configured |
Usage examples
Where to get it?
If you’re interested in this widget, you can find it in our e-shop. There you’ll learn more about the available versions and how to get the product.
