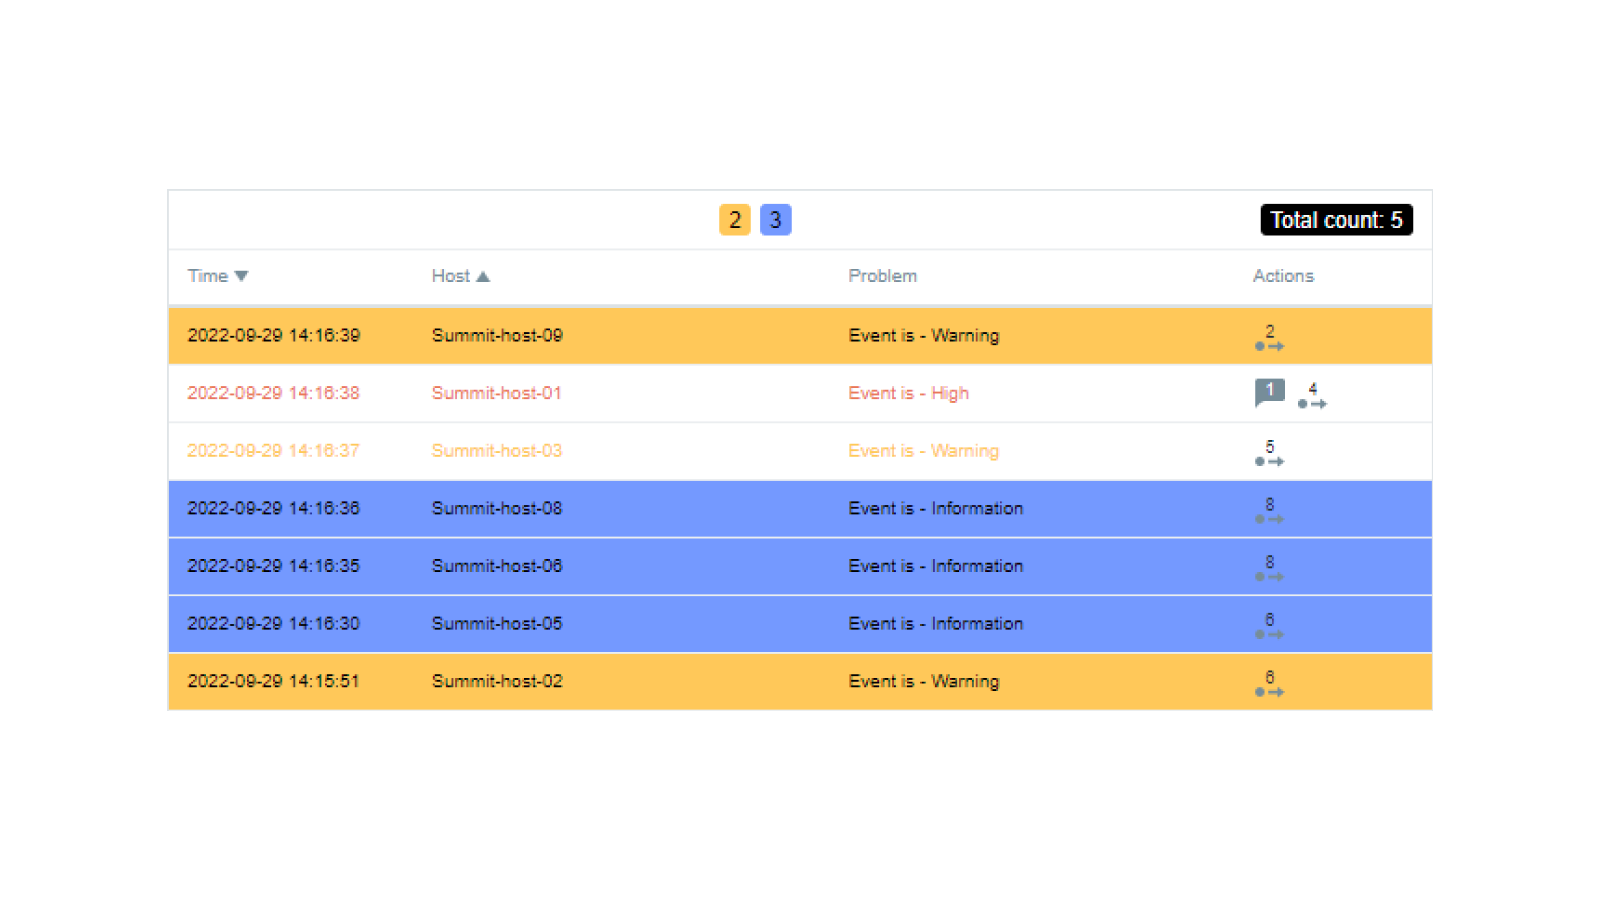
Description
Standard events can be filtered by severity, tags, host, host groups, or problems. Select one or more events using the mouse (CTRL or SHIFT keys) for mass operations like acknowledging, de-acknowledging, or creating trouble tickets. Events can be sorted by time, host, problem, severity, or acknowledgment. Customize columns by changing order, hiding them, or adjusting labels and widths. Style acknowledged events visually. View event counters by severity and raise the Zabbix widget’s limit on displayed events. Fonts and sizes can also be customized (Arial or Georgia).
Installation
Repository setup on the server
Connect to your Zabbix frontend server (perform on all frontend nodes) via SSH
Navigate to the /modules folder (typically located at /usr/share/zabbix/ or /usr/share/zabbix/ui/)
cd /usr/share/zabbix/modules/Clone repository on your server
git clone https://git.initmax.cz/initMAX-Public/Zabbix-UI-Modules-Enhanced-Problems.gitChange the ownership of the directory to the user under which your Zabbix frontend is running using the chown command (cat /etc/passwd to find which user was created during installation), some examples:
chown nginx:nginx ./Zabbix-UI-Modules-Enhanced-Problems*chown apache:apache ./Zabbix-UI-Modules-Enhanced-Problems*chown www-data:www-data ./Zabbix-UI-Modules-Enhanced-Problems*Frontend module initialization
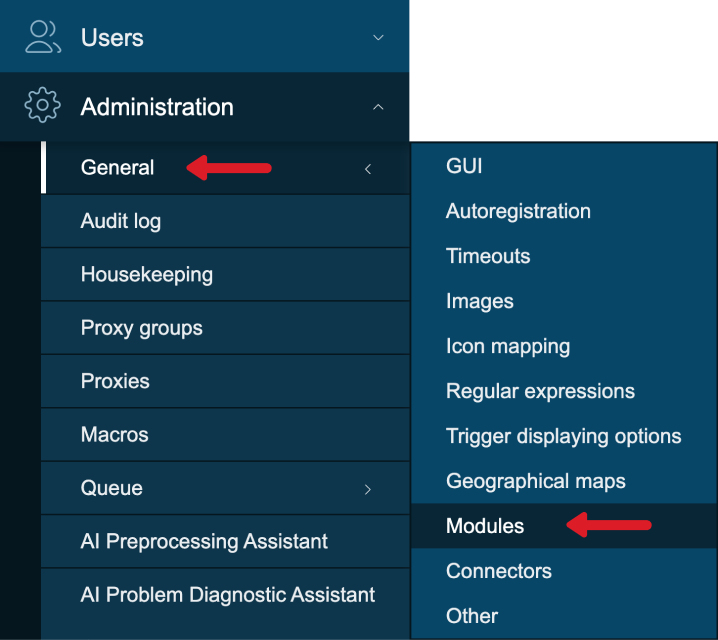
Navigate to the Zabbix frontend menu and select: Administration → General → Modules
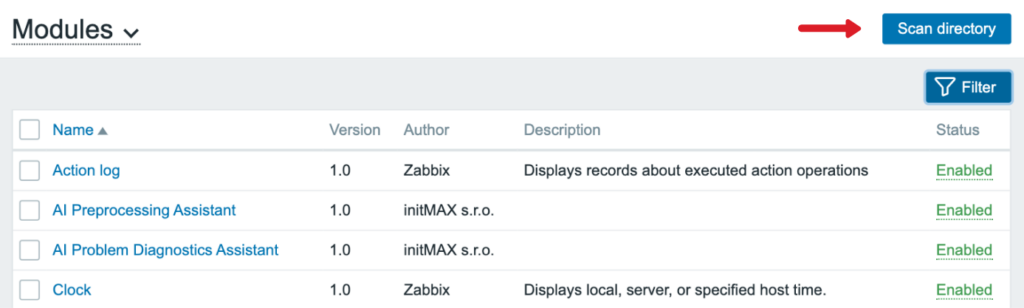
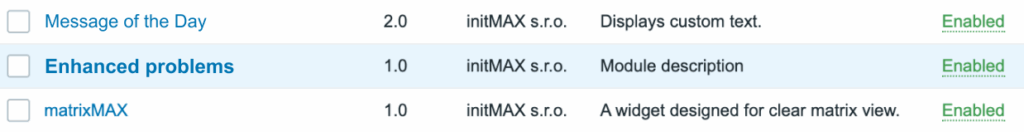
Use the Scan directory button on the top
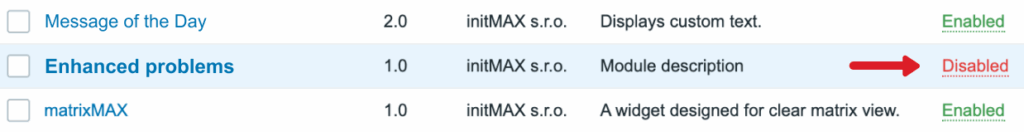
Enable the newly discovered widget
The widget is available in the menu
Where to get it?
If you’re interested in this widget, you can find it in our e-shop. There you’ll learn more about the available versions and how to get the product.