In this guide, we will show you how to create a graphical representation of your data using native Zabbix components and then have this data sent to you regularly by e-mail as a part of scheduled reports.
Installation and configuration
First, you need to install the zabbix-web-service installation package from the official Zabbix repository:
dnf install -y zabbix-web-serviceNext, add the repository for installing Google Chrome.
This is the browser recommended by Zabbix for these purposes, but it can also be replaced with, for example, Chromium or Firefox.
In the first step, create a repository configuration file:
nano /etc/yum.repos.d/google-chrome.repoPut the following lines in this file, save the file and close it.
[google-chrome]
name=google-chrome
baseurl=http://dl.google.com/linux/chrome/rpm/stable/$basearch
enabled=1
gpgcheck=1
gpgkey=https://dl-ssl.google.com/linux/linux_signing_key.pub
Now you can proceed to the actual installation of the Google Chrome browser, with the following command.
Note: The browser installation does not include a graphical user interface as it is neither required, nor recommended.
dnf install -y google-chrome-stableIf you have the zabbix-web-service installed on the same server as the Zabbix server itself, then you don’t need to modify the settings of this service in any way.
However, in both cases, an additional configuration of the Zabbix server is required.
Let’s open the Zabbix server configuration file then.
nano /etc/zabbix/zabbix_server.confAnd here modify the following configuration directives according to this example:
...
StartReportWriters=1
...
WebServiceURL=http://localhost:10053/report
...
If you’ve installed the zabbix-web-service on a different server than the one on which the Zabbix server is also running, then modify the directive WebServiceURL accordingly.
At the same time, it would then be necessary to set this IP address to the enabled ones at the Zabbix Web service configuration level, in the path /etc/zabbix/zabbix_web_service.conf, you can see an example of this setting below:
### Option: AllowedIP
# List of comma delimited IP addresses, optionally in CIDR notation, or DNS names of Zabbix servers and
# Zabbix proxies.
# Example: AllowedIP=127.0.0.1,192.168.1.0/24,::1,2001:db8::/32,zabbix.example.com
#
# Mandatory: yes
# Default:
# AllowedIP=

AllowedIP=127.0.0.1,::1
When the configuration is complete, you can restart the reporting service and enable it to start automatically after startup:
systemctl restart zabbix-server.service
systemctl enable zabbix-web-service.service --now
The last step of the installation process is to set the Frontend URL. This setting can be found in the Zabbix web interface in the menu Administration -> General.
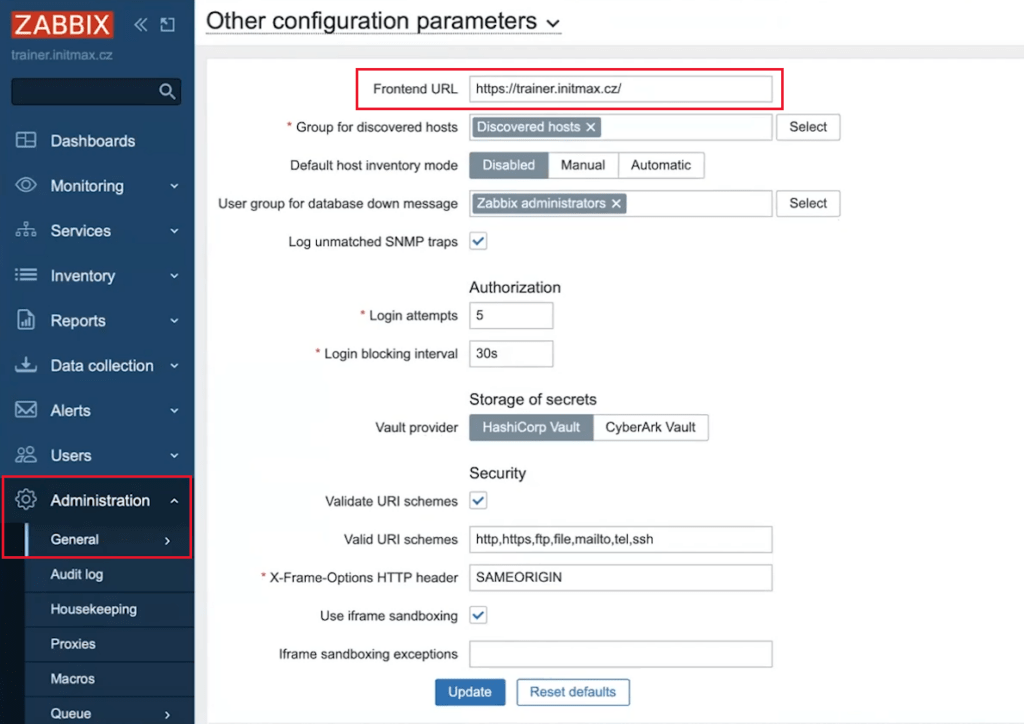
After saving this setting using the Update button, you can move on to creating actual reports.
Reporting setup
Dashboard
Scheduled reports are based on a specific dashboard, which is then sent regularly based on a predefined interval to an e-mail address, set in the media of specific user or group of users.
For the purposes of this demonstration, we will use the default “Zabbix server health” dashboard, which is available as a sample dashboard immediately after a clean installation of Zabbix.
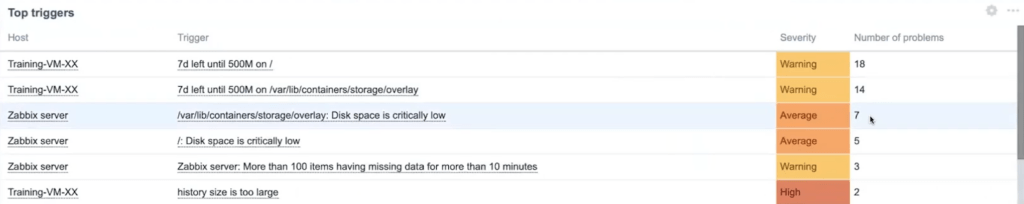
But first, add a widget to this dashboard, which is new in Zabbix version 7.0, the widget is called “Top Triggers”.
This widget can react to a time filter and is therefore very useful especially for needs of reporting where we send data for a certain period.
After saving the dashboard settings, you will also create a scheduled report for this dashboard.
Scheduled reports
You can do this by selecting the Reports -> Scheduled reports menu and clicking the Create report button there.
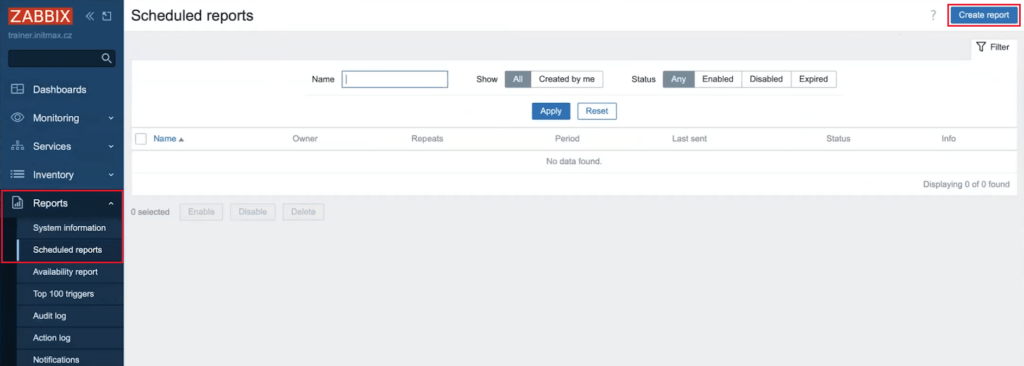
A popup will appear where you select a specific user as the owner of this report and choose its name.
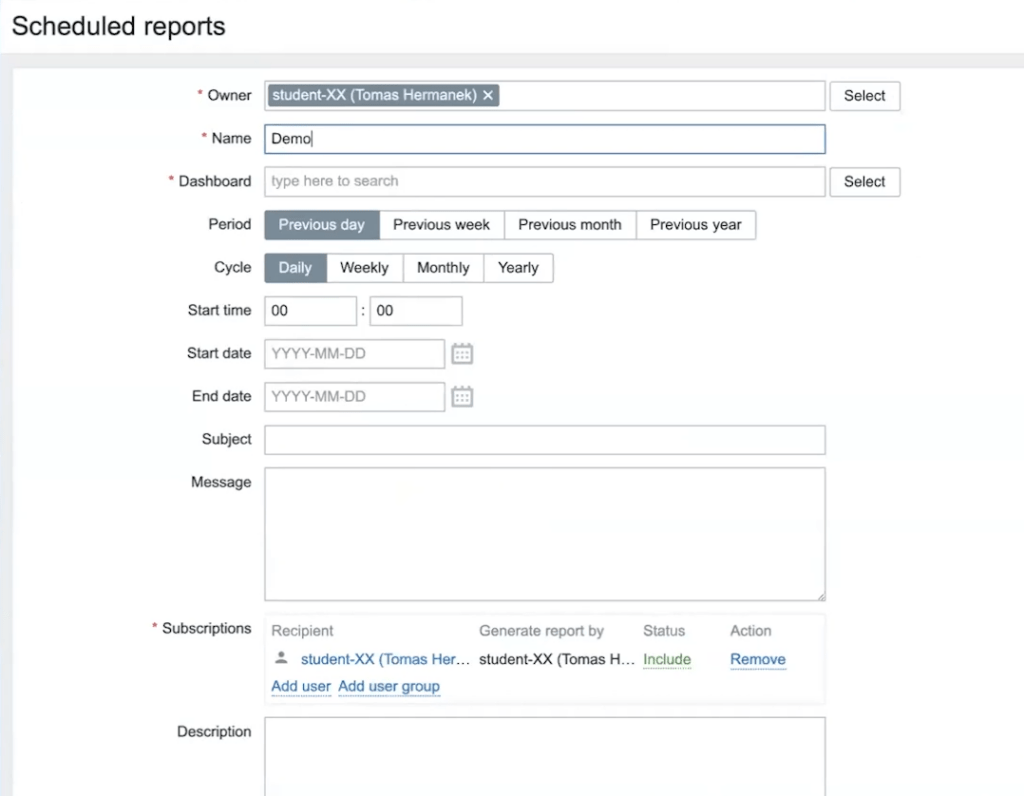
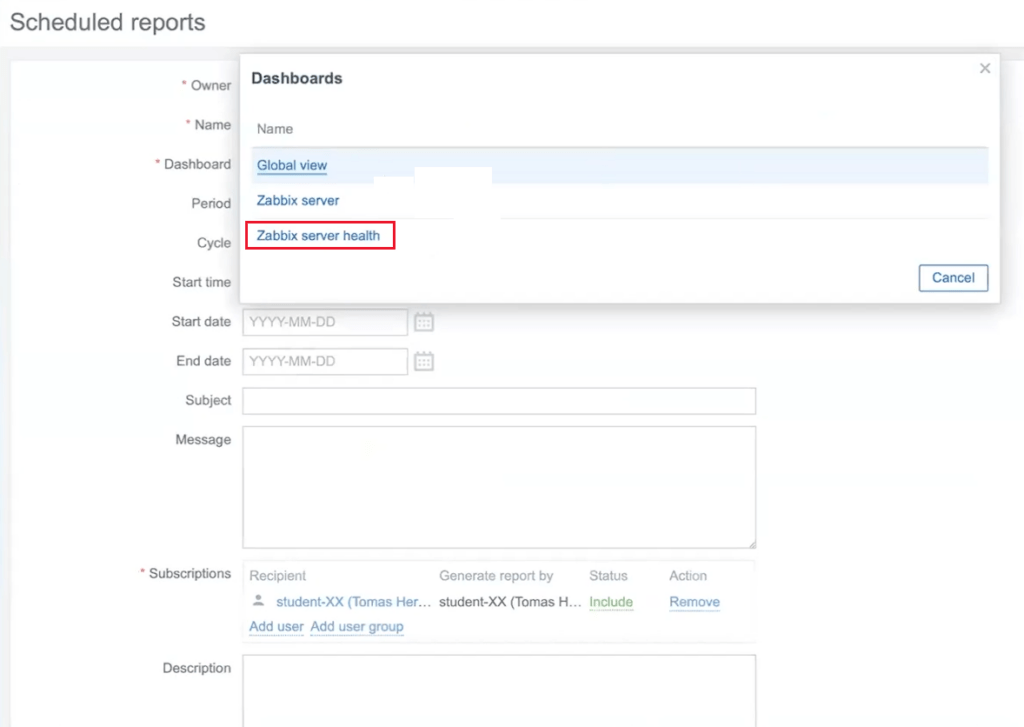
In the Dashboard section of this sample report, use the Select button to choose the dashboard we previously edited called Zabbix server health.
Next, you can choose for which period and how often the report should be sent, and select on which day of the week and at what time (this is server time!).
At the same time, you can also set a specific date from when this scheduled reporting should start and possibly how long it would last.
And finally, choose the subject of the email and the contents of its body. You can use standard HTML syntax as well as global macros here.
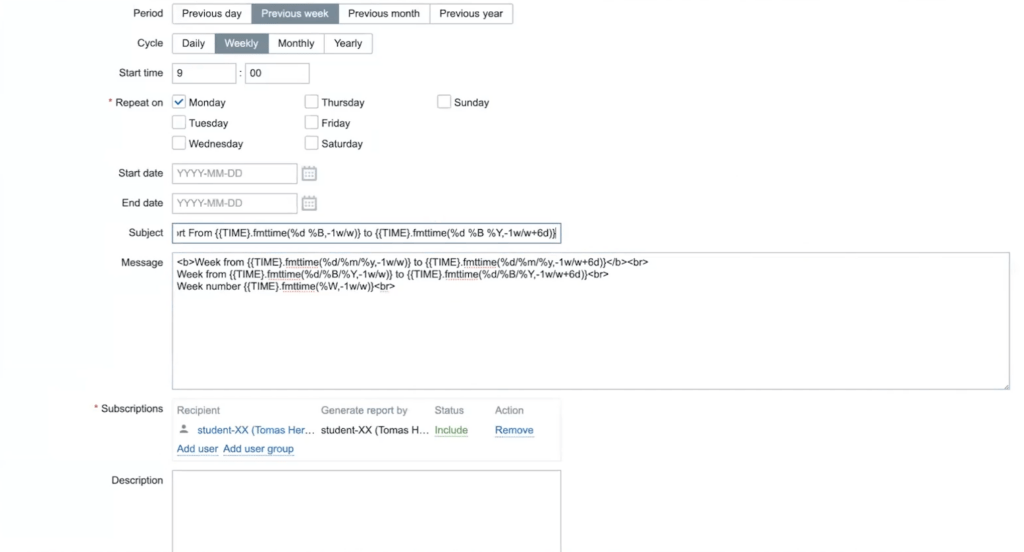
The following text is used in the subject of this example message:
Weekly demo report From {{TIME}.fmttime(%d %B,-1w/w)} to {{TIME}.fmttime(%d %B %Y,-1w/w+6d)}And this in the message’s body:
<b>Week from {{TIME}.fmttime(%d/%m/%y,-1w/w)} to {{TIME}.fmttime(%d/%m/%y,-1w/w+6d)}</b><br>
Week from {{TIME}.fmttime(%d/%B/%Y,-1w/w)} to {{TIME}.fmttime(%d/%B/%Y,-1w/w+6d)}<br>
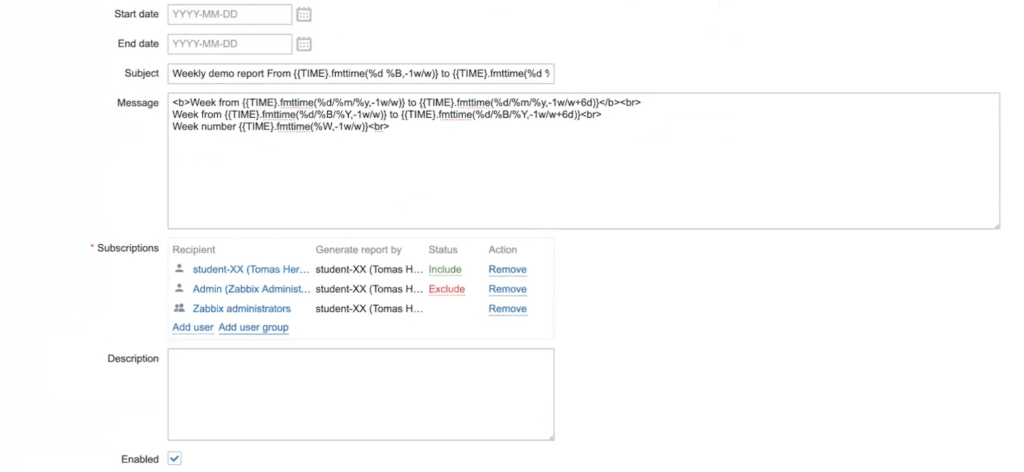
Week number {{TIME}.fmttime(%W,-1w/w)}<br>In the Subscriptions configuration option, specify to which users (or user groups) this scheduled report will be sent.
You can also exclude users here, effectively disabling sending of this report.
For example, it might look like this:
You can test the functionality of the settings and the appearance of your report before saving it using the Test button.
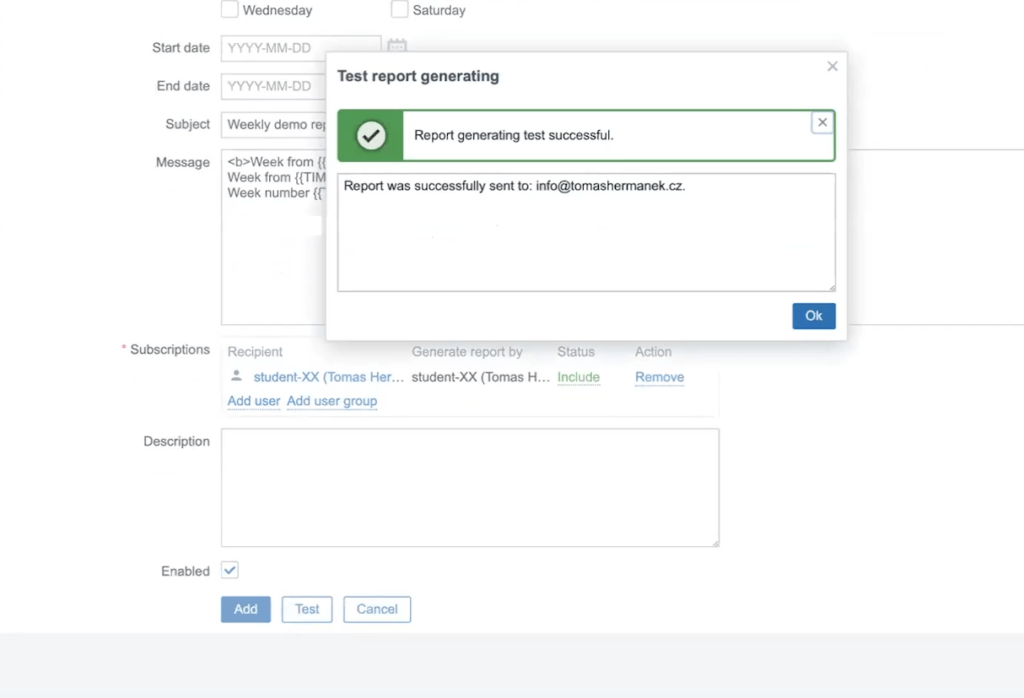
After successful test, you can create this new report by clicking the Add button.
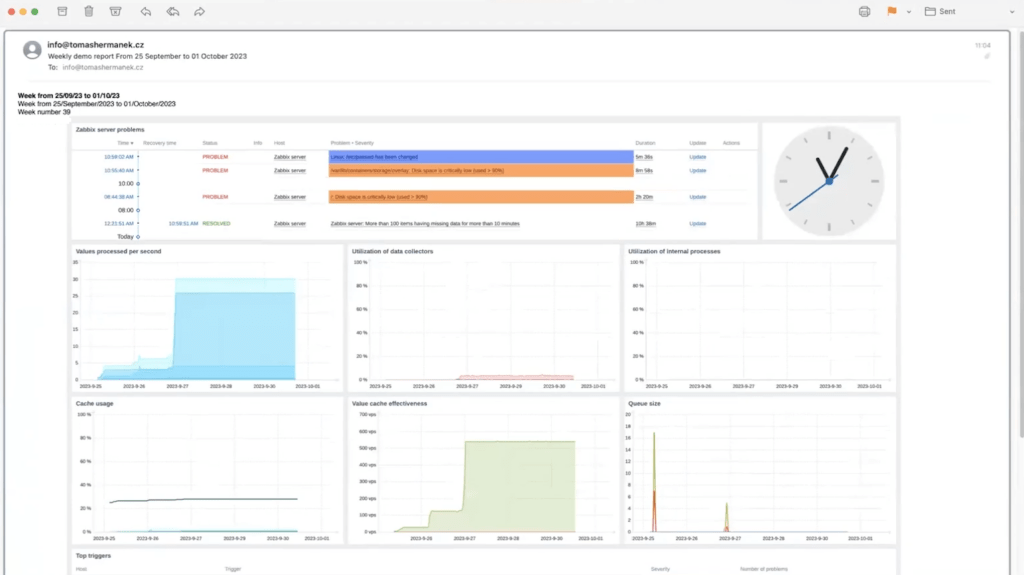
The result of your newly created sample report will then look like this in the e-mail:
The latest version of Zabbix also includes support for multi-paged dashboards.
As a result, the attached PDF document will contain pages, which correspond to each individual page of this multi-paged dashboard.
You can find an example of a multi-paged PDF report HERE.
And that’s it! You now have learned how to create scheduled reports from your dashboard. These reports will inform you of the status of your infrastructure, regularly by an e-mail.
Give us a Like, share us, or follow us 😍
So you don’t miss anything: