Zabbix version 7.2 is here!
The new Zabbix version 7.2 brings a range of exciting new features.
| Contact us for a free consultation | CONTACT US FOR A FREE CONSULTATION AND DEMO |
|
We are preparing thematic webinars for you |
|
| Training for the latest LTS version (Zabbix 7.0) | mORE INFORMATION ABOUT THE TRAINING |
| You can also explore our DEMO Zabbix. Log in using the “sign in as guest” button. | SIGN IN TO DEMO ZABBIX |
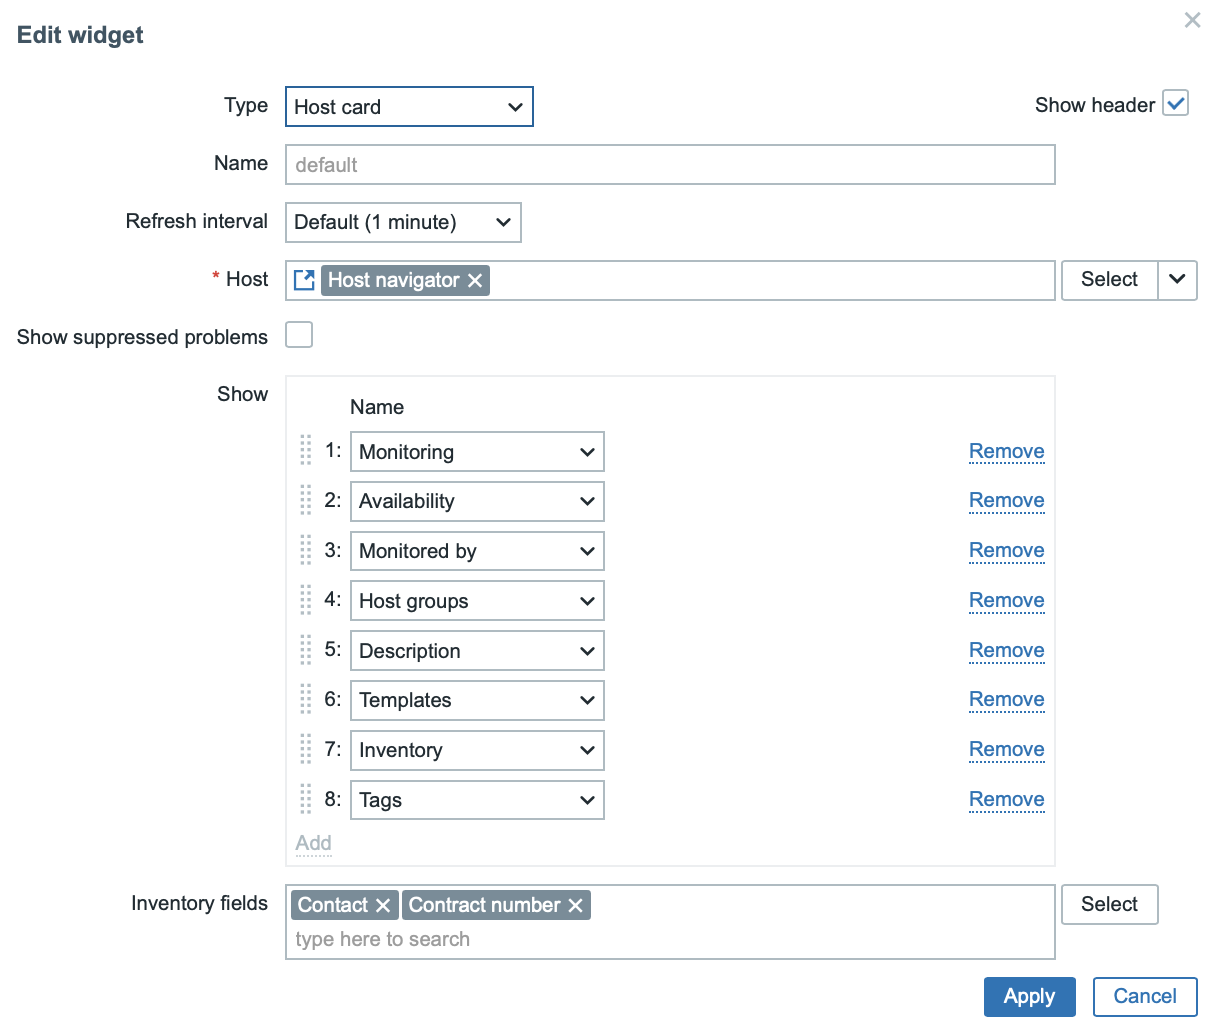
Widget Host card
The new Host card widget in Zabbix allows for the management and display of key host information on the dashboard with the following features:
- Direct host link: The ability to view detailed host information such as monitoring status, availability, templates, inventory, and more.
- External widgets: Integration with widgets like Honeycomb or Host navigator for easy navigation between hosts.
- Inventory and tags: Configurable inventory fields (e.g., contact details) and the display of tags for better organization and clarity.
Users can customize the widget content by selecting different items, adding custom inventory fields, and choosing which information to display. refresh interval.
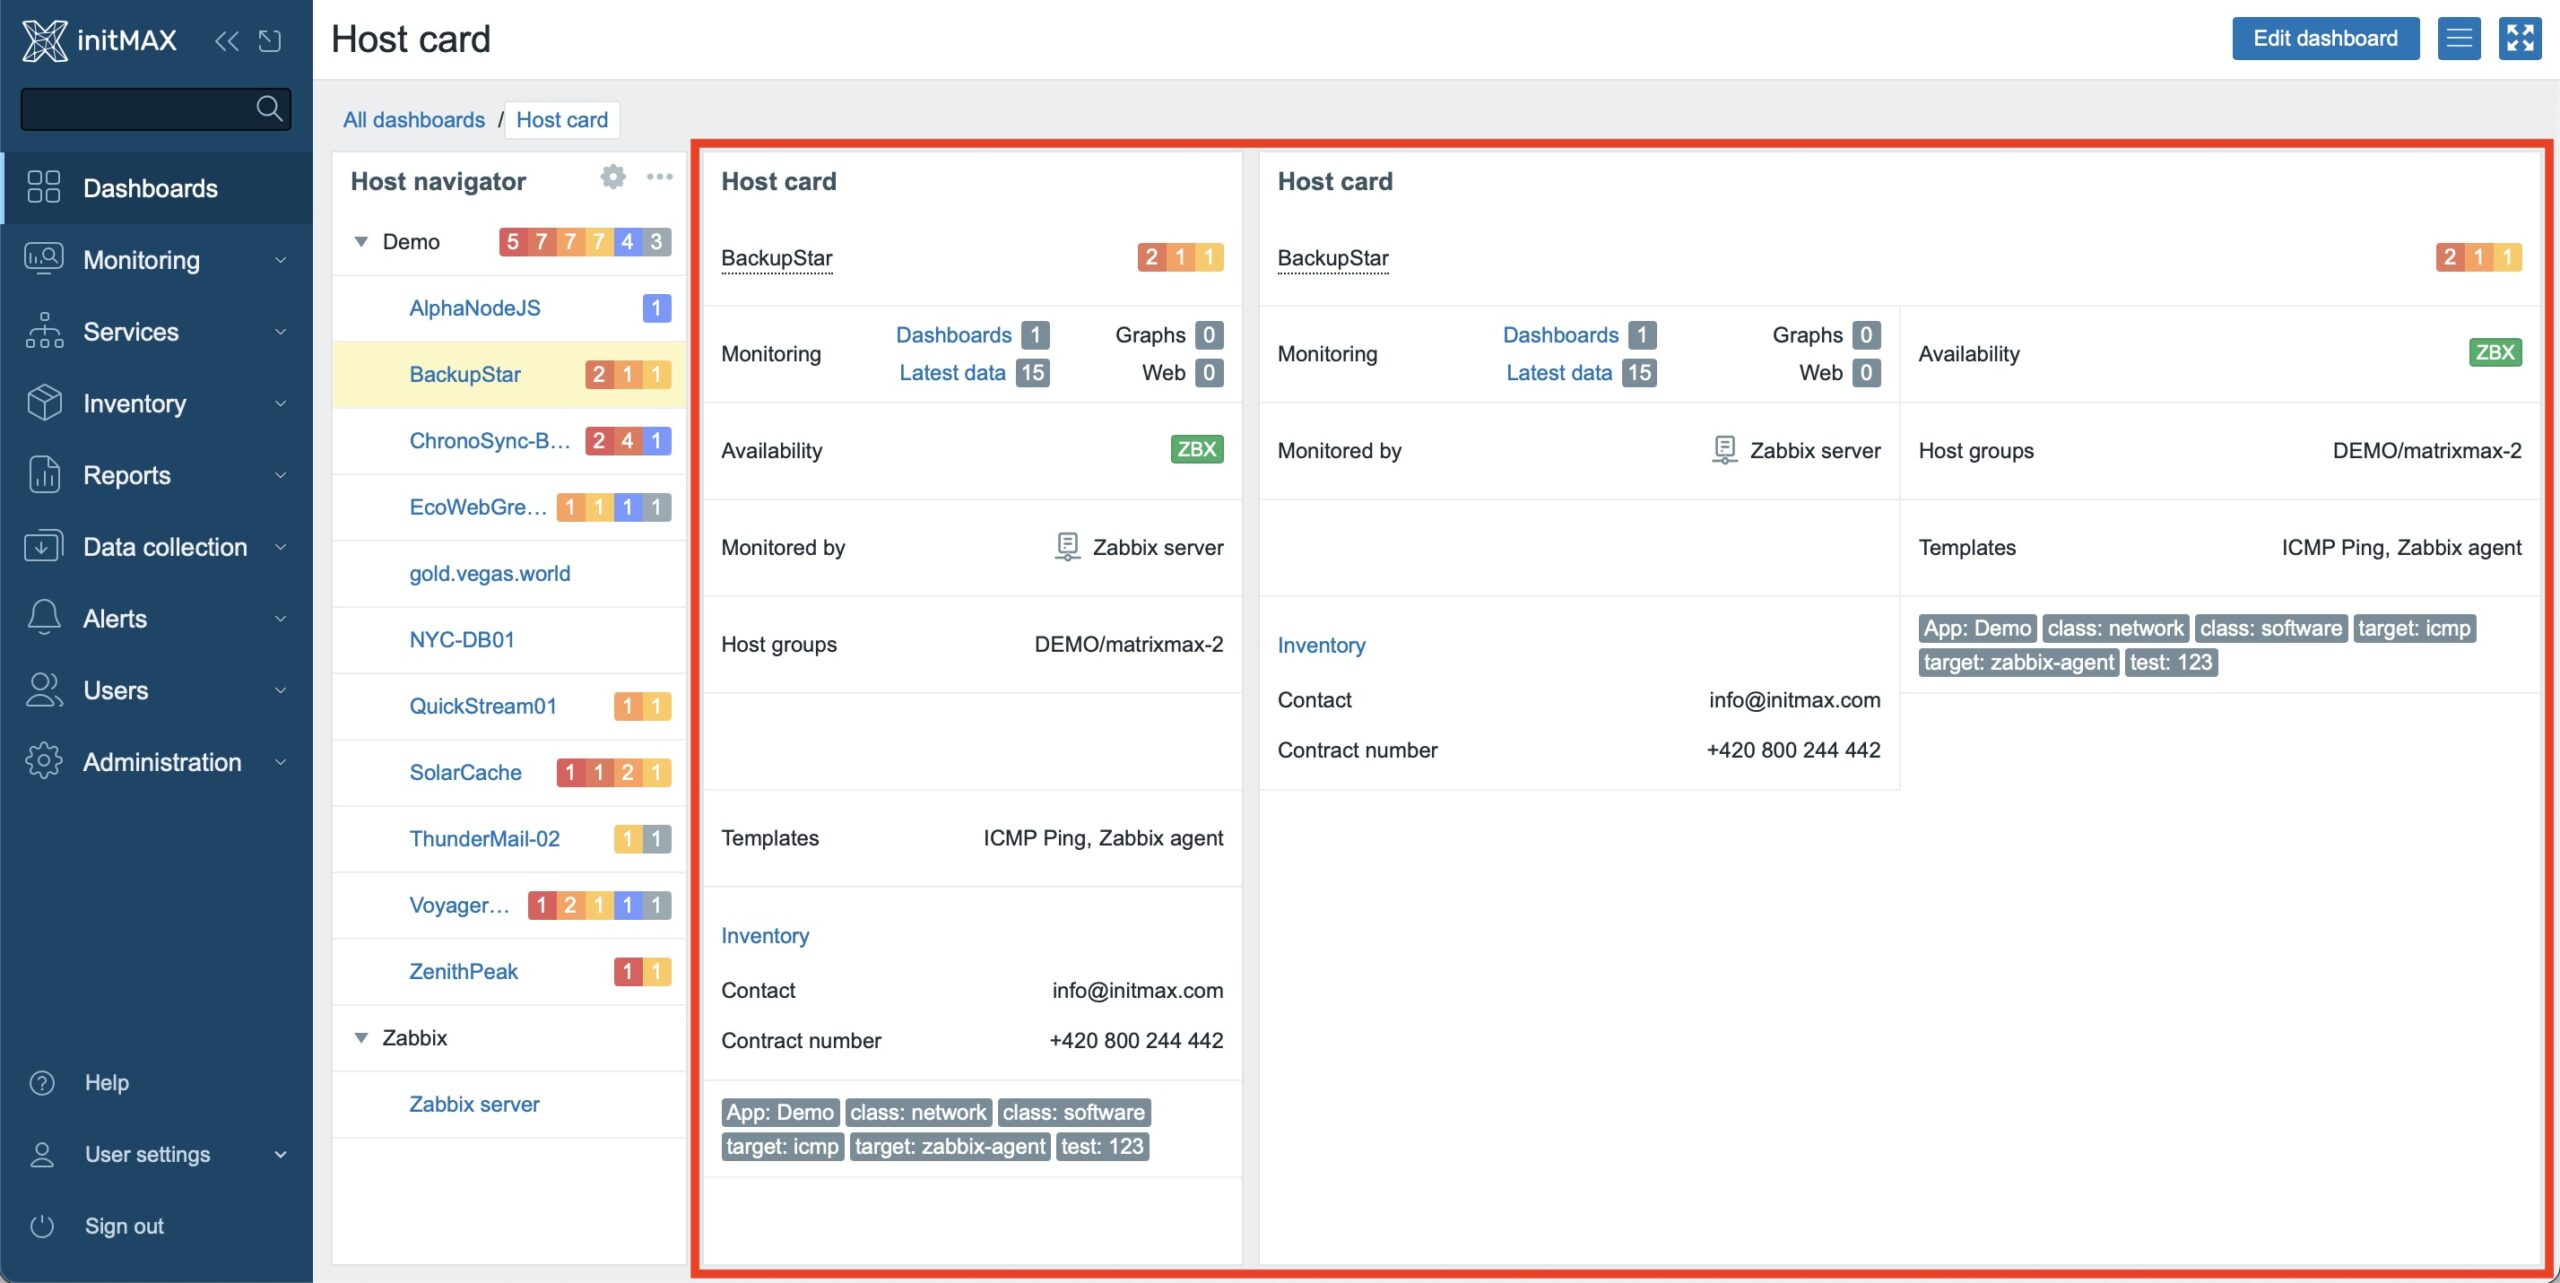
Example configuration for the Host card widget:
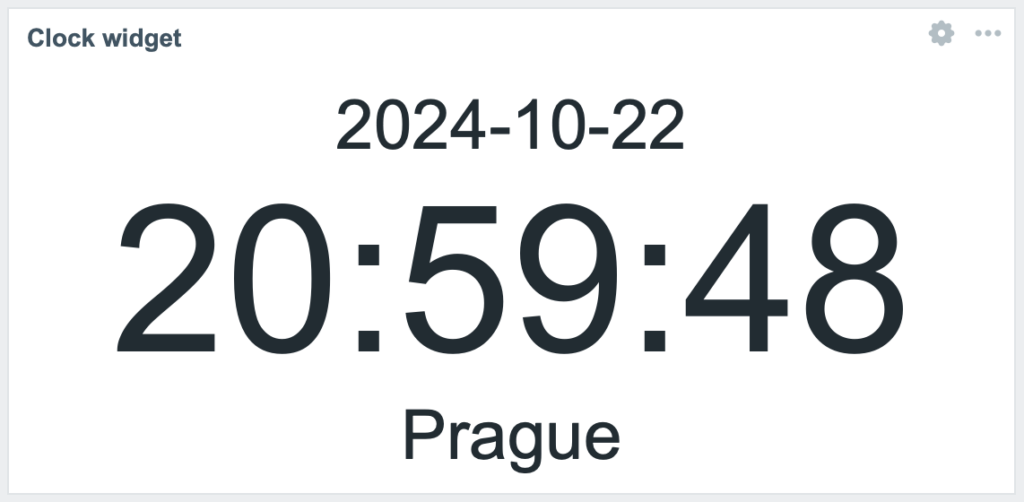
Improvements to the Clock widget
The Clock widget, which displays digital time, has undergone significant improvements. The size of individual elements (date, time, time zone) now dynamically adjusts to the available space based on the widget size, displayed units, and display scale. This ensures that the widget always makes efficient use of space without requiring manual font size adjustments. Configuration parameters for setting size have been removed, simplifying the overall widget setup.
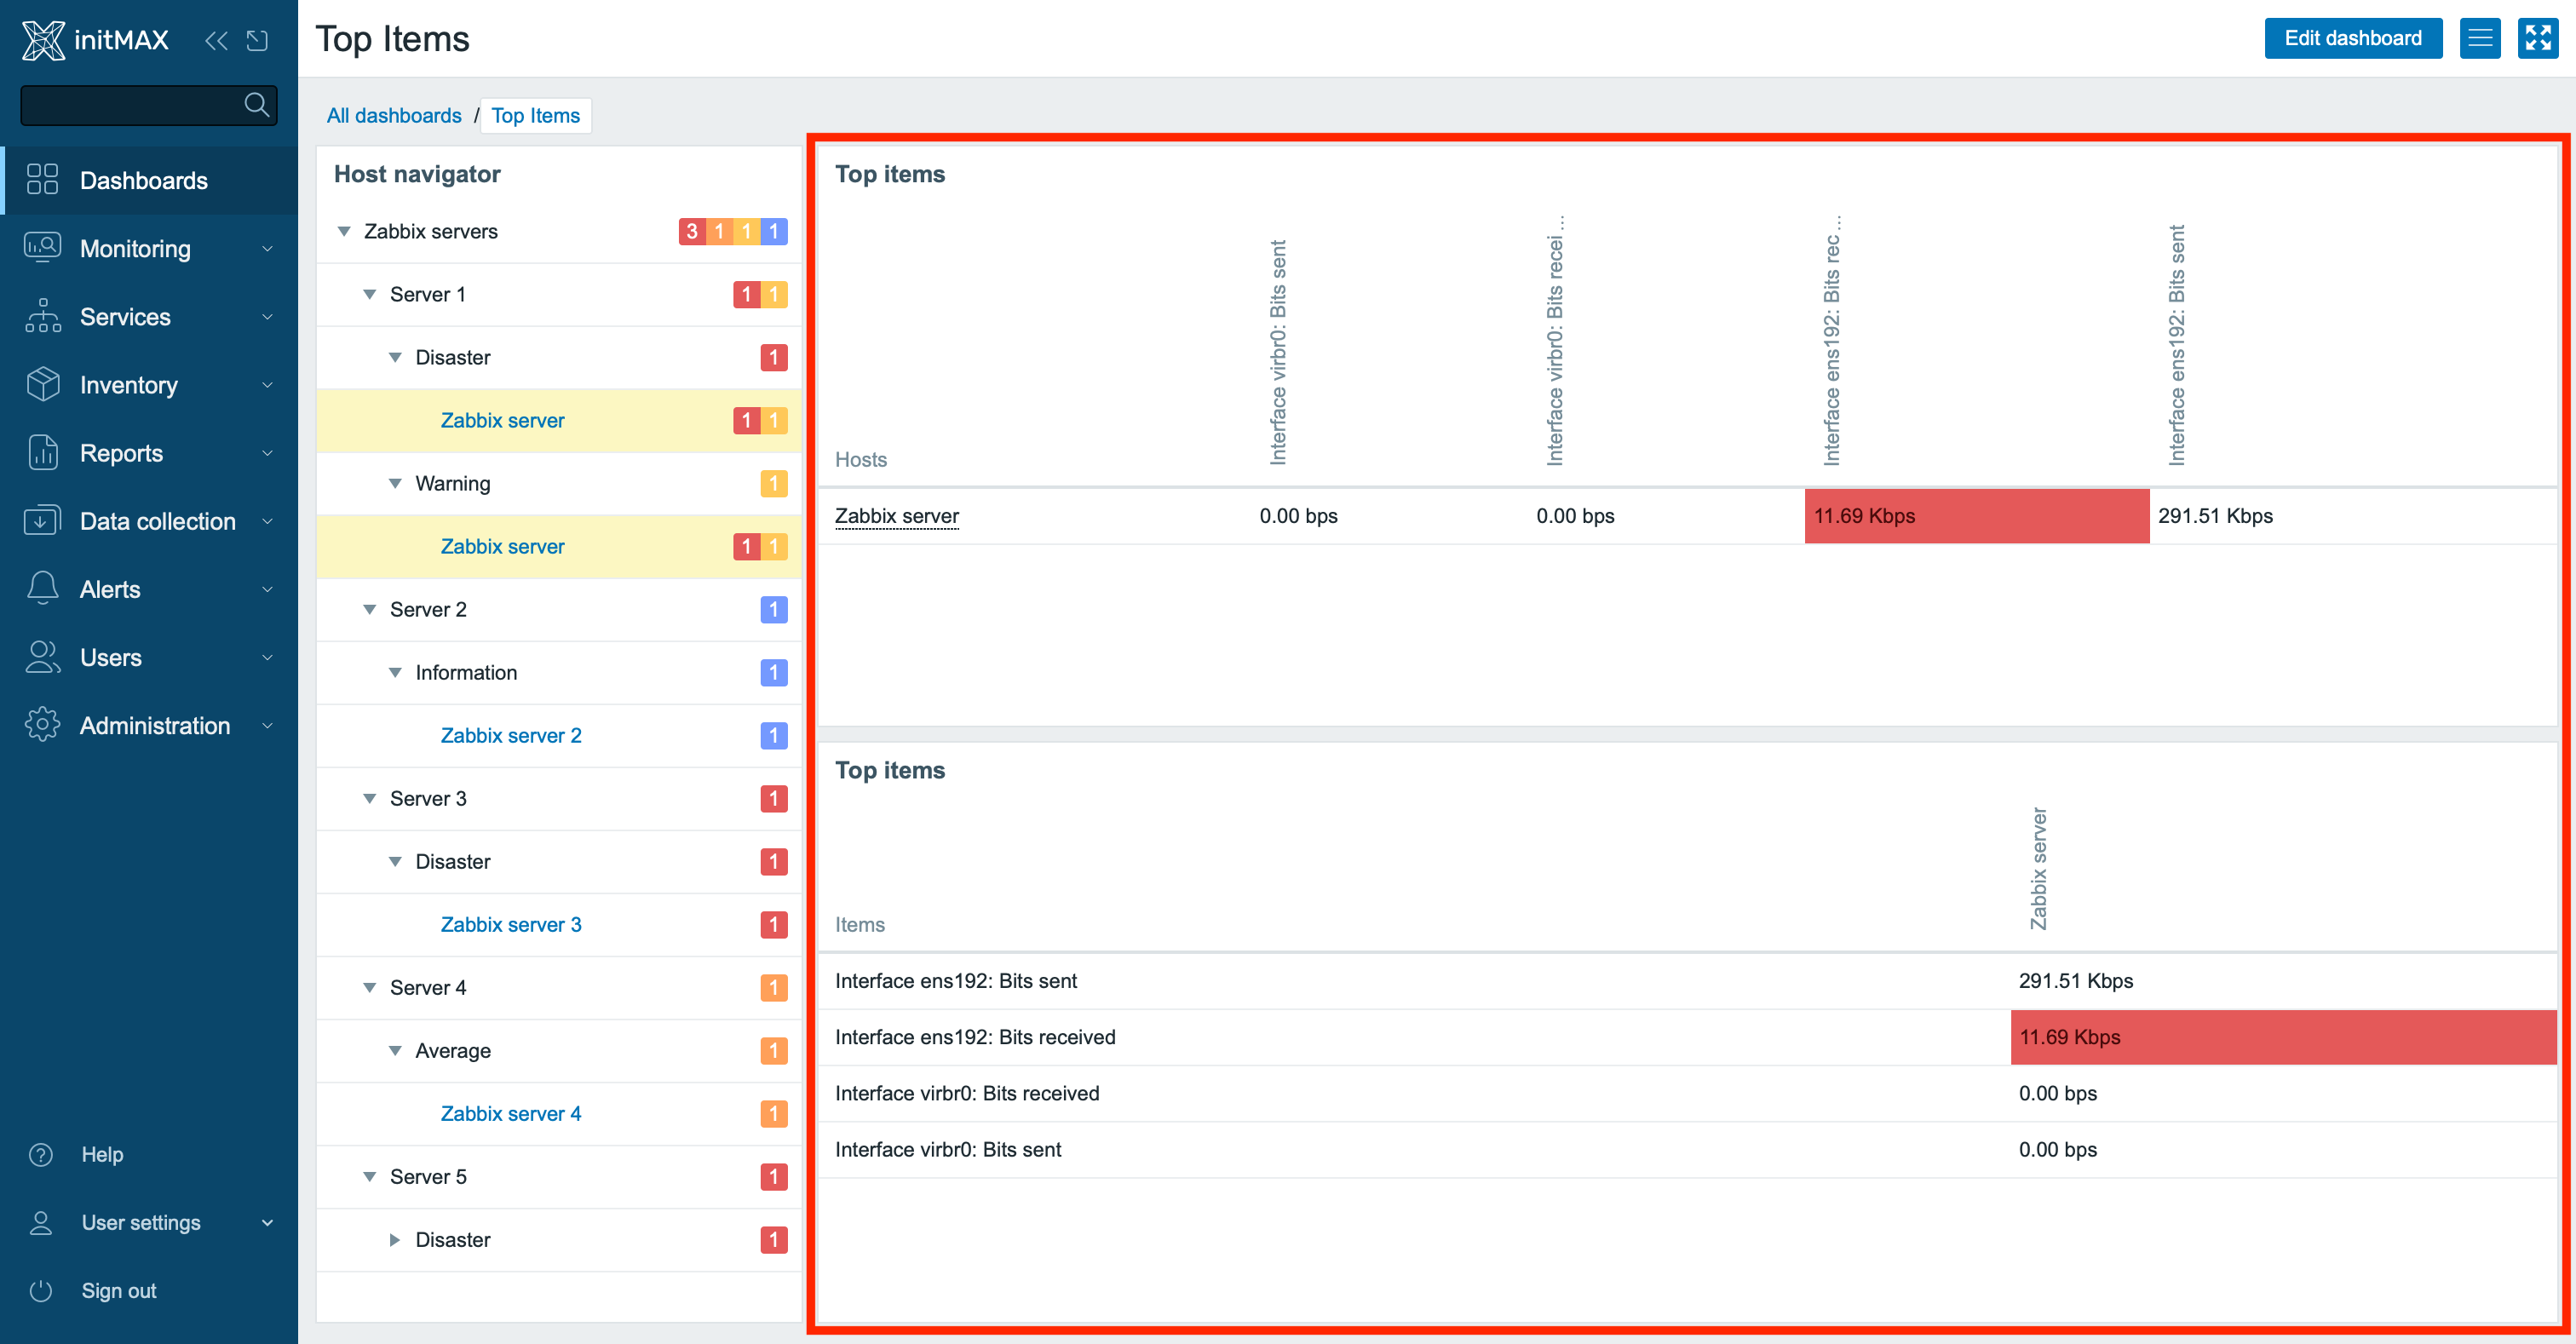
Top items widget
Top Items Widget: This widget is an excellent tool for displaying a list of hosts and their latest measured values based on your configured parameters. It offers the following features:
- Data Sorting: By host name or item name.
- Displaying Active Triggers: Directly at the item level, making it easier to quickly identify issues.
Note: Binary data values are not displayed in this widget.
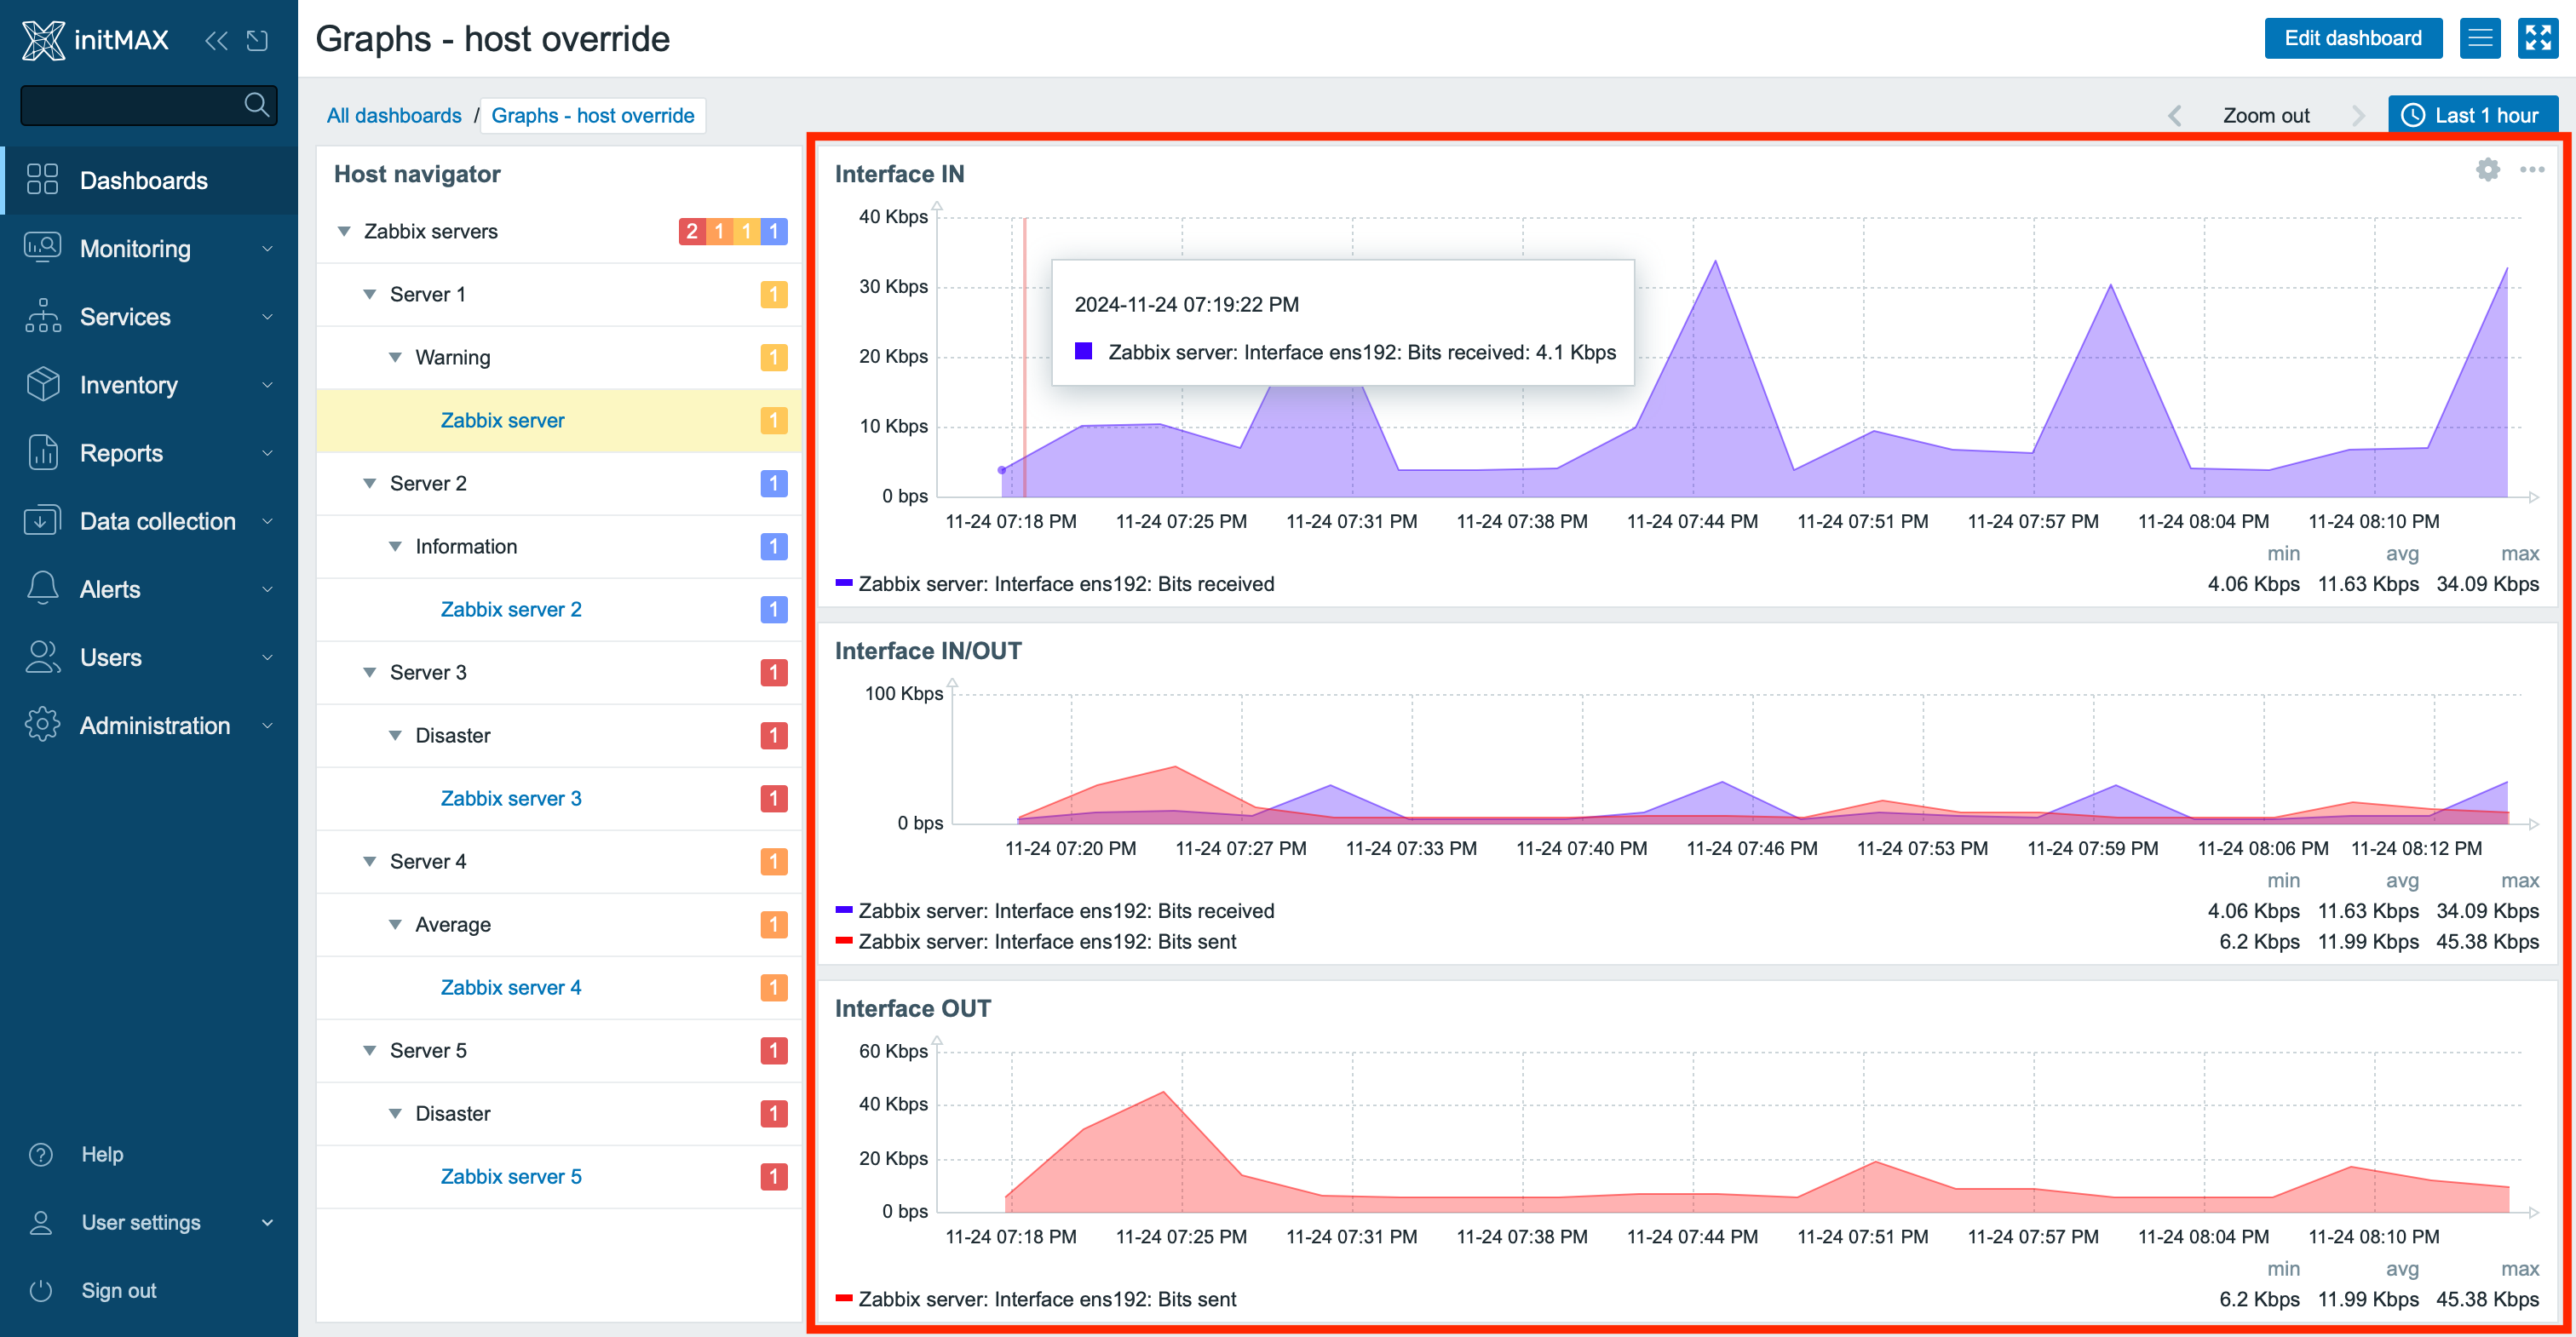
Host Override in the Graph Widget
A new feature in the Graph widget, Host Override, enables dynamic changes to the displayed host value directly through external widgets. This functionality allows you to connect the Graph widget with Host Navigator, Honeycomb Widget, or Item Navigator, opening new possibilities for working with graphs on dashboards.
What does it offer?
- Dynamic Switching Between Hosts:
Using the Host Navigator or Honeycomb Widget, you can easily click on a specific host, and the Graph widget will instantly display the corresponding metrics. This means quick and intuitive operations without needing to modify graph settings manually. - Item List Support Reminder:
Since earlier versions, the Graph widget has supported connections with the Item Navigator when the data source is an item list. This functionality allows you to quickly switch between individual items, which is useful for detailed metric monitoring at the item level. The new Host Override significantly expands this capability by enabling seamless switching at the host level. - Extended Graphs for Multiple Items:
With Host Override, you can display multiple items related to a specific host in a single graph. For instance, metrics like CPU, memory, or network traffic for one host can be shown together, providing a comprehensive overview of the host’s performance.
Why is this useful?
- Simplicity:
No more manual configuration or duplicating graphs. Simply link the graph to a navigator and click on the data you need. - Flexibility:
Combine different widgets—Host Navigator, Honeycomb Widget, and Item Navigator—to meet your needs. - Time-Saving:
Quickly switch between hosts or items without unnecessary complexity.
This new feature enhances dashboard efficiency and makes it easier to monitor and analyze metrics dynamically.
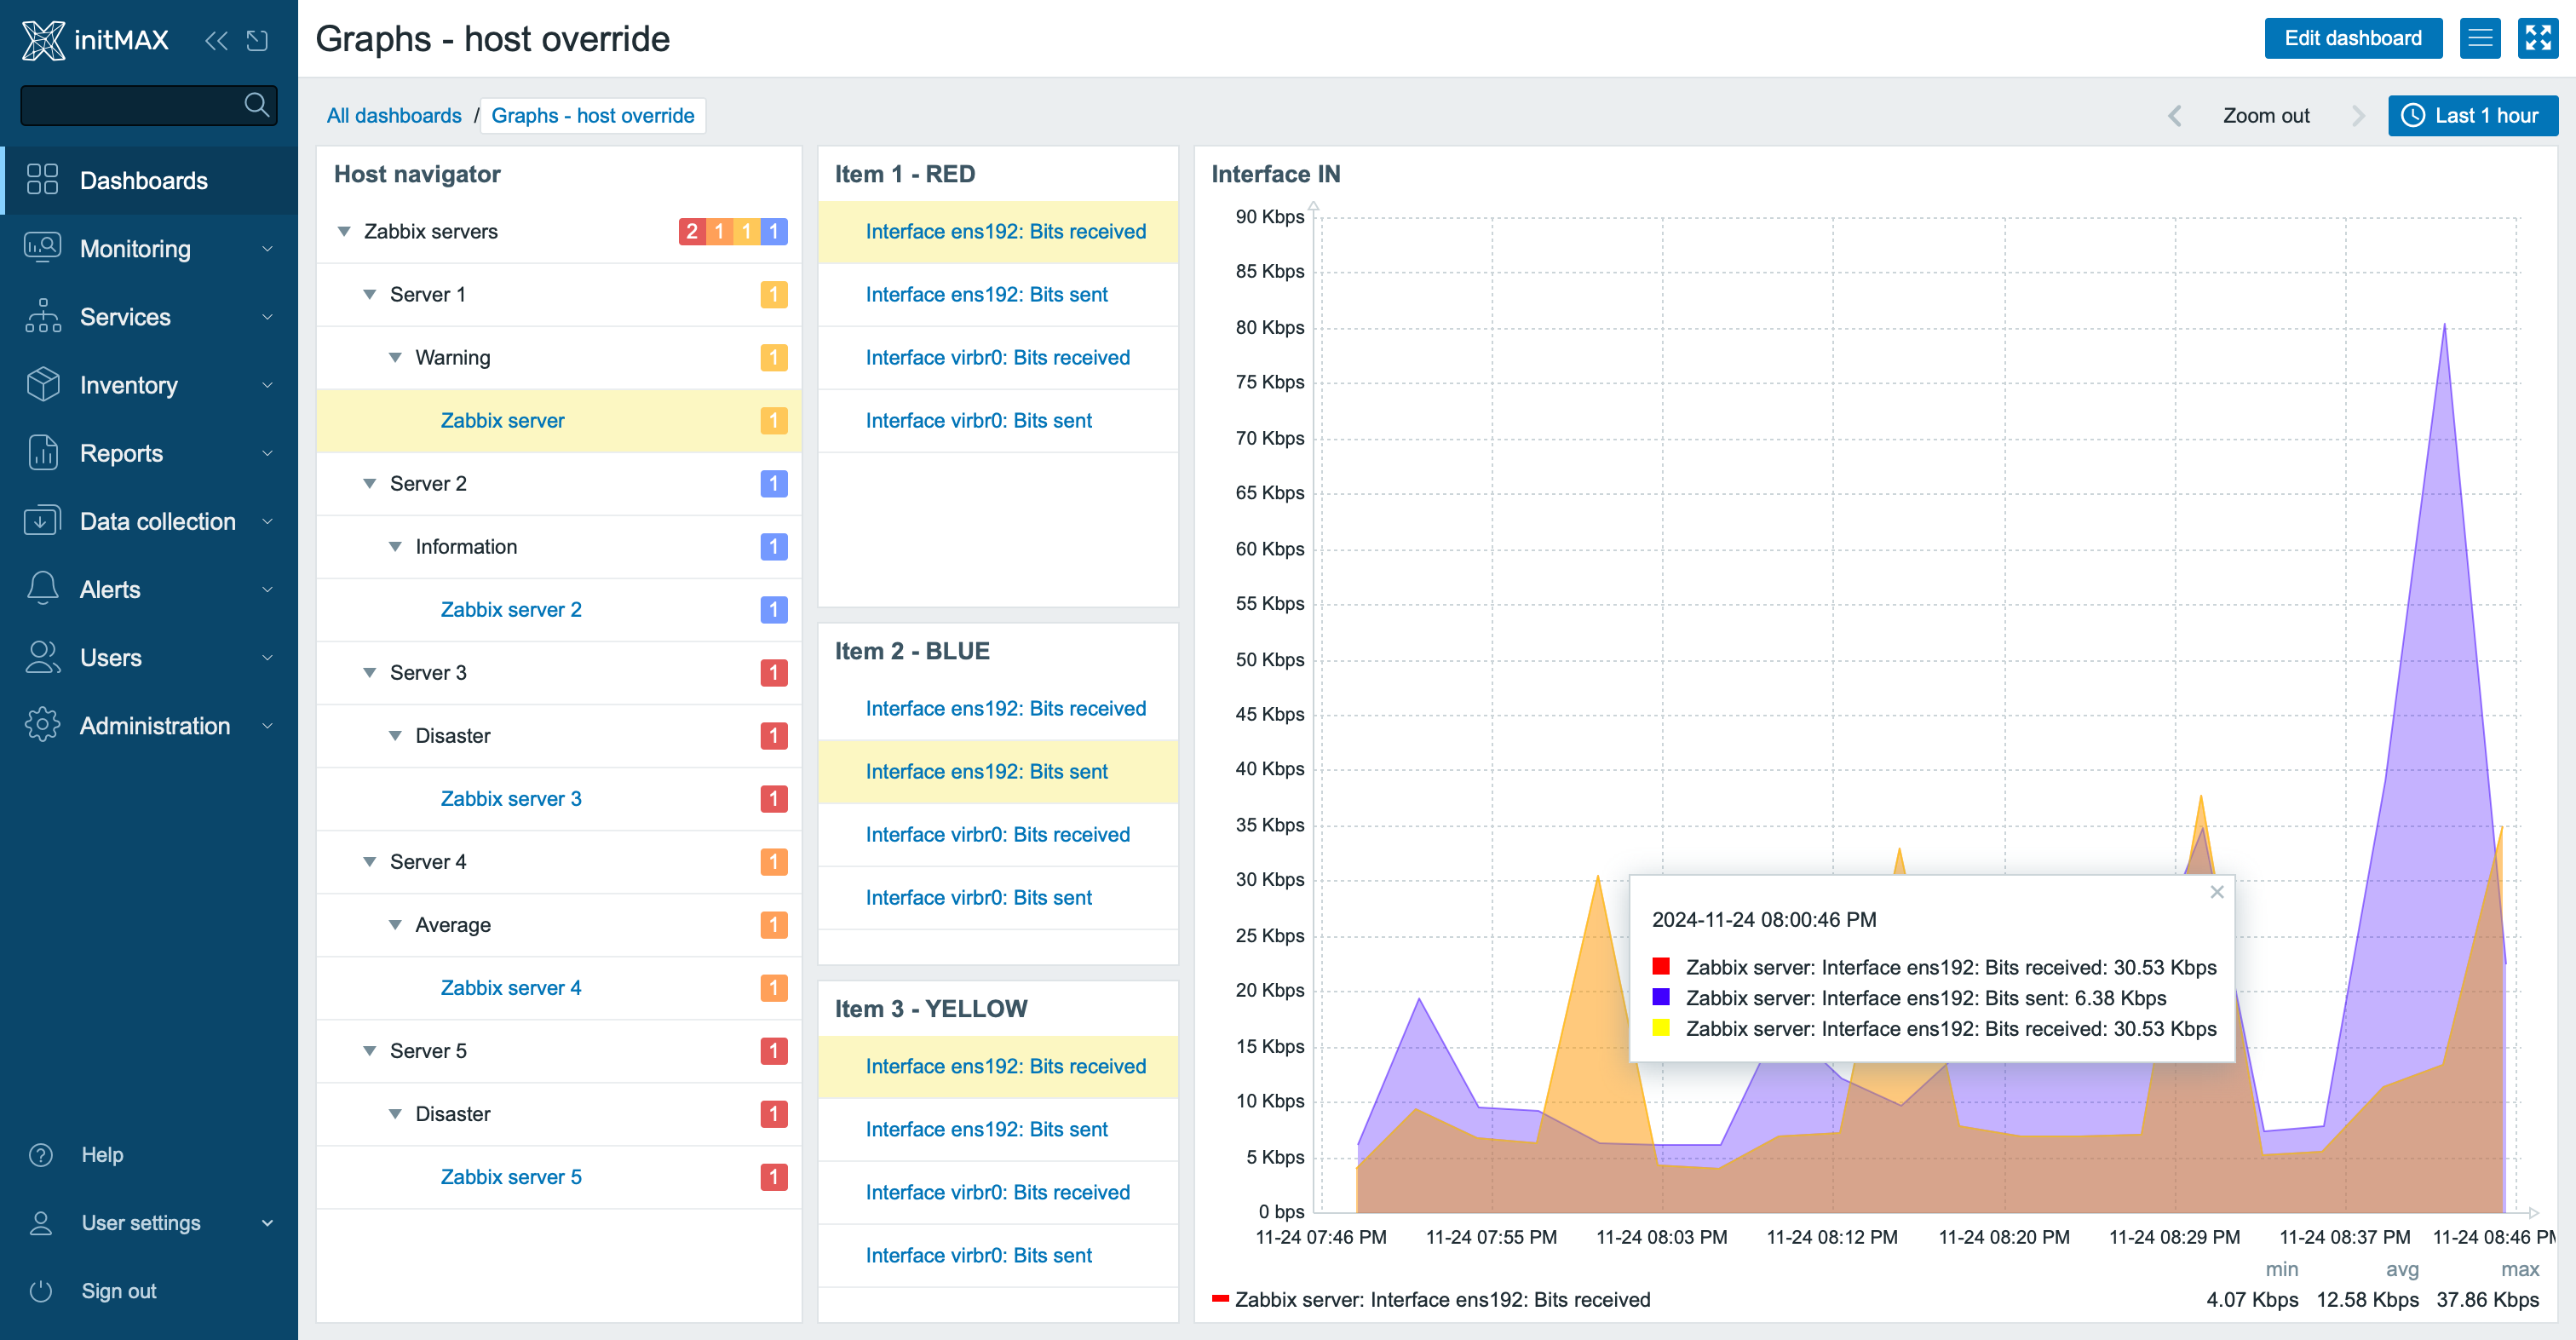
Example Configuration
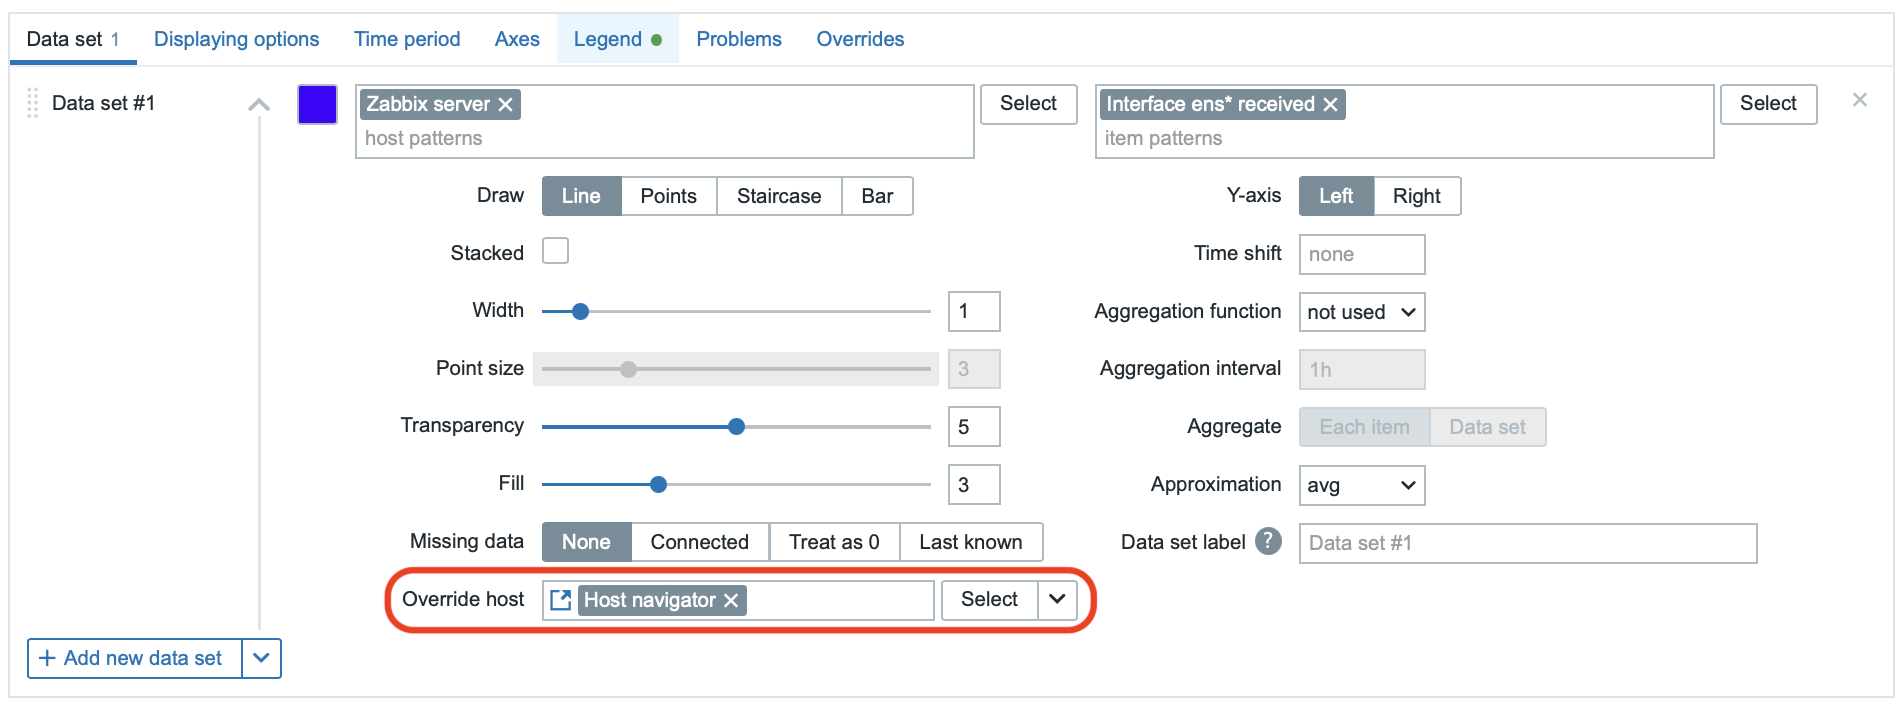
Reminder: You might have already configured the combination of Host Navigator + Item Navigator with a configured item dataset directly through the widget.
Enhanced Features of the Top Hosts Widget
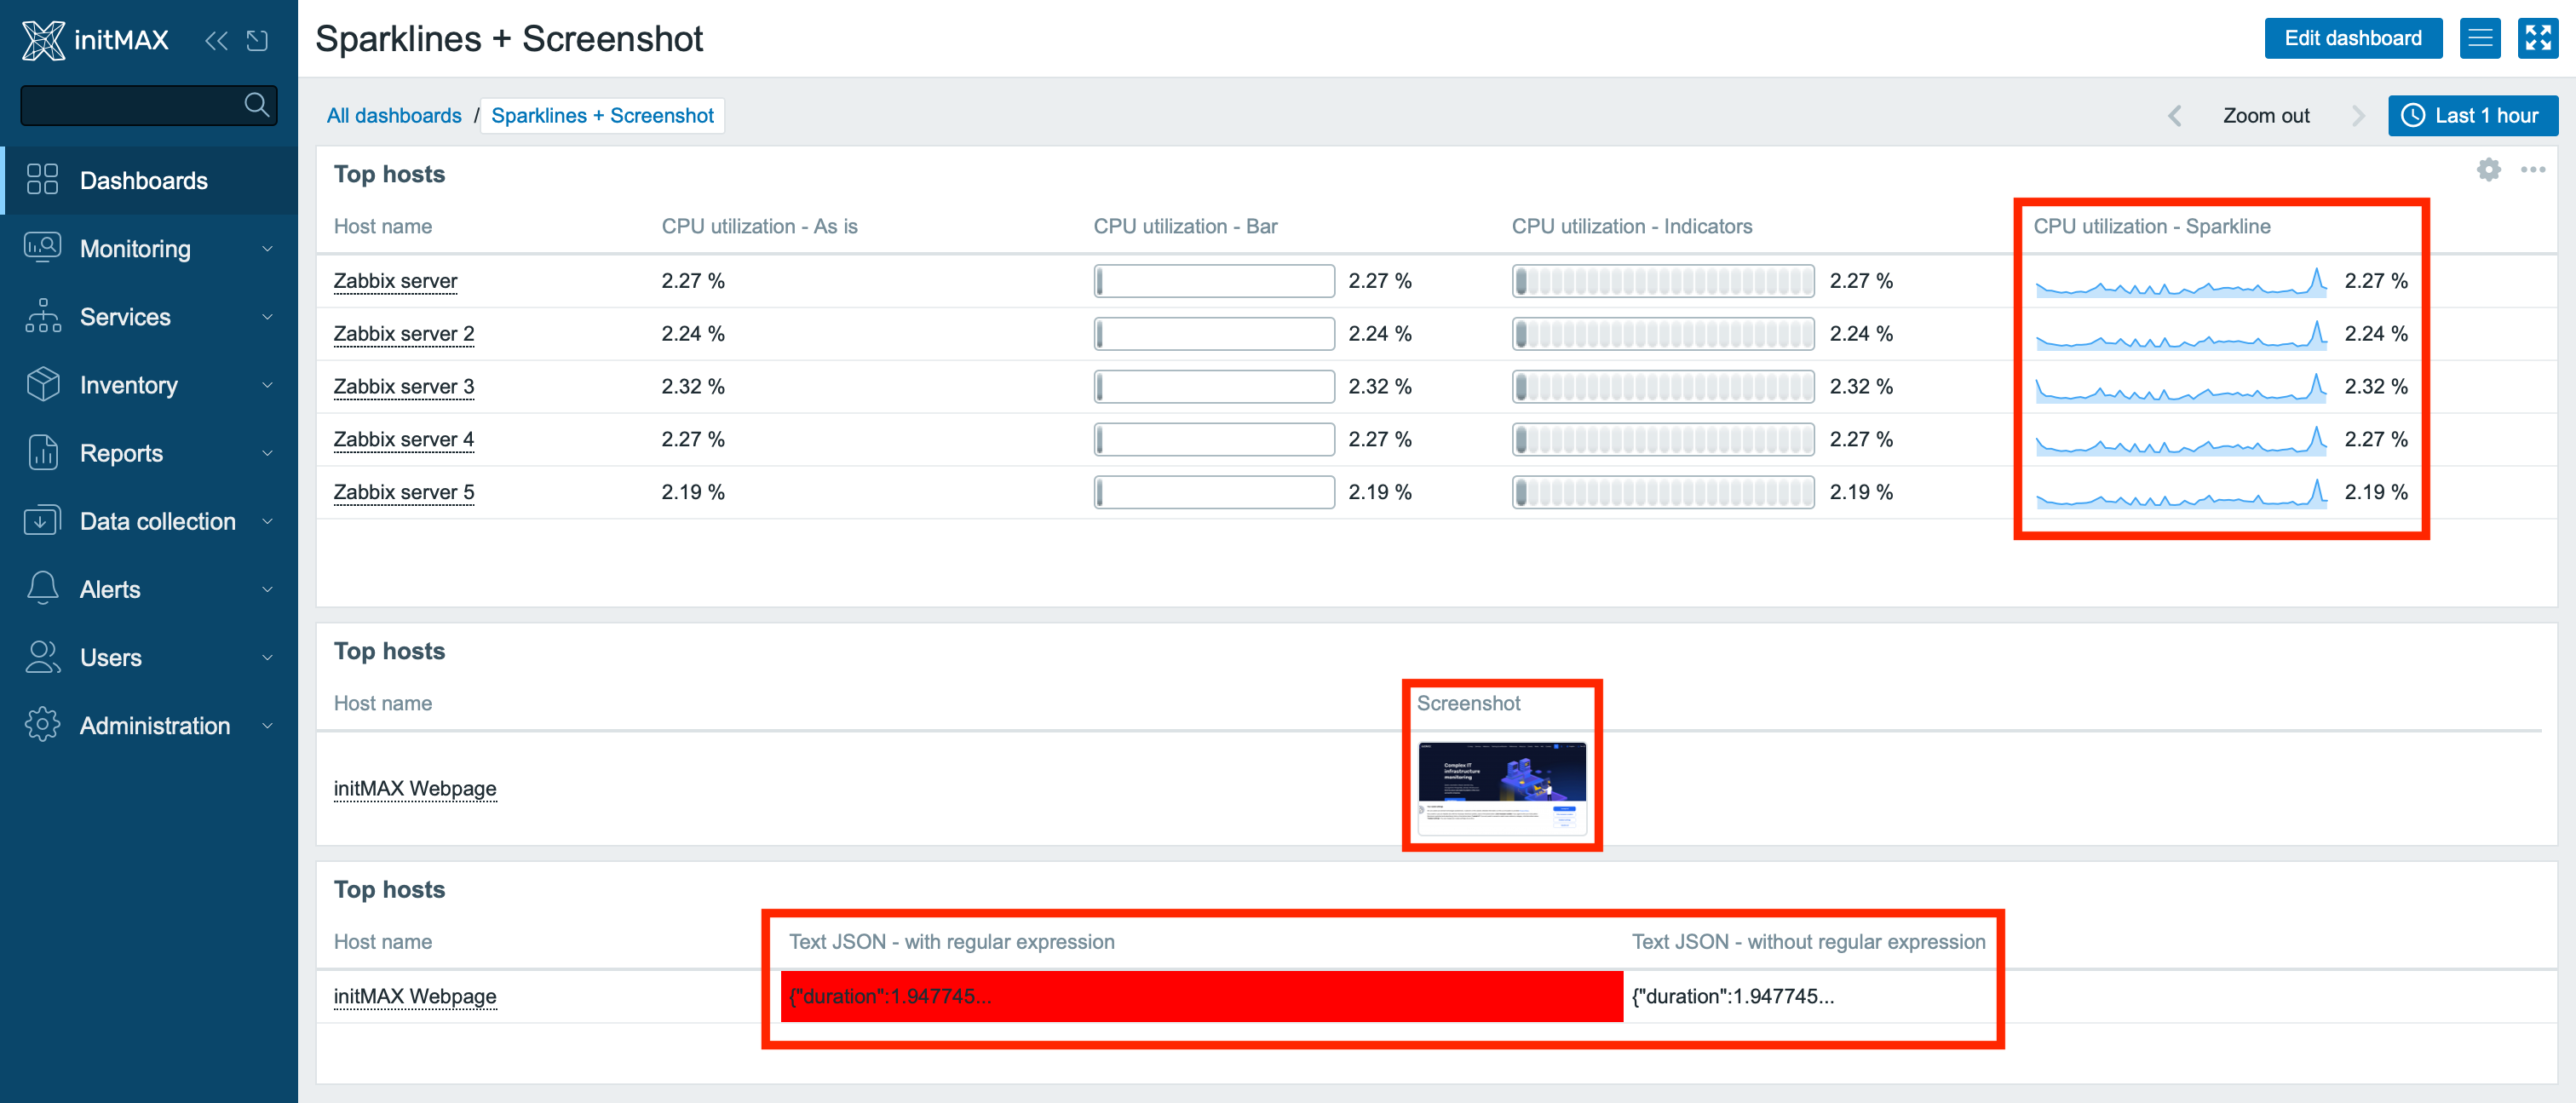
The Top Hosts widget now offers extended configuration options for item value columns, improving visualization and clarity of monitored data:
- Sparkline Graphs:
Columns can now display sparkline graphs, which are small line charts providing a quick visual overview of trends and changes in values over time. This feature makes it easy to identify unusual fluctuations or trends directly within the widget. - Support for Binary Data:
Binary data values can now be displayed as image thumbnails or hyperlinks to full-sized images. This feature is perfect for monitoring visual data such as charts, screenshots, or other image files. - Dynamic Color Highlighting for Text Data:
For text values, you can configure a regular expression that automatically changes the column background color when a condition is met. This makes it easy to identify important values such as alerts, errors, or specific patterns in monitored data.
Logarithmic Scaling in the Graph Widget
The Graph widget now supports logarithmic scaling on the Y-axis. This feature is ideal for:
- Data with Rapid Changes: Such as exponential growth or decline.
- Wide Range of Values: It allows both small and large values to be visualized on a single graph without smaller values being overshadowed.
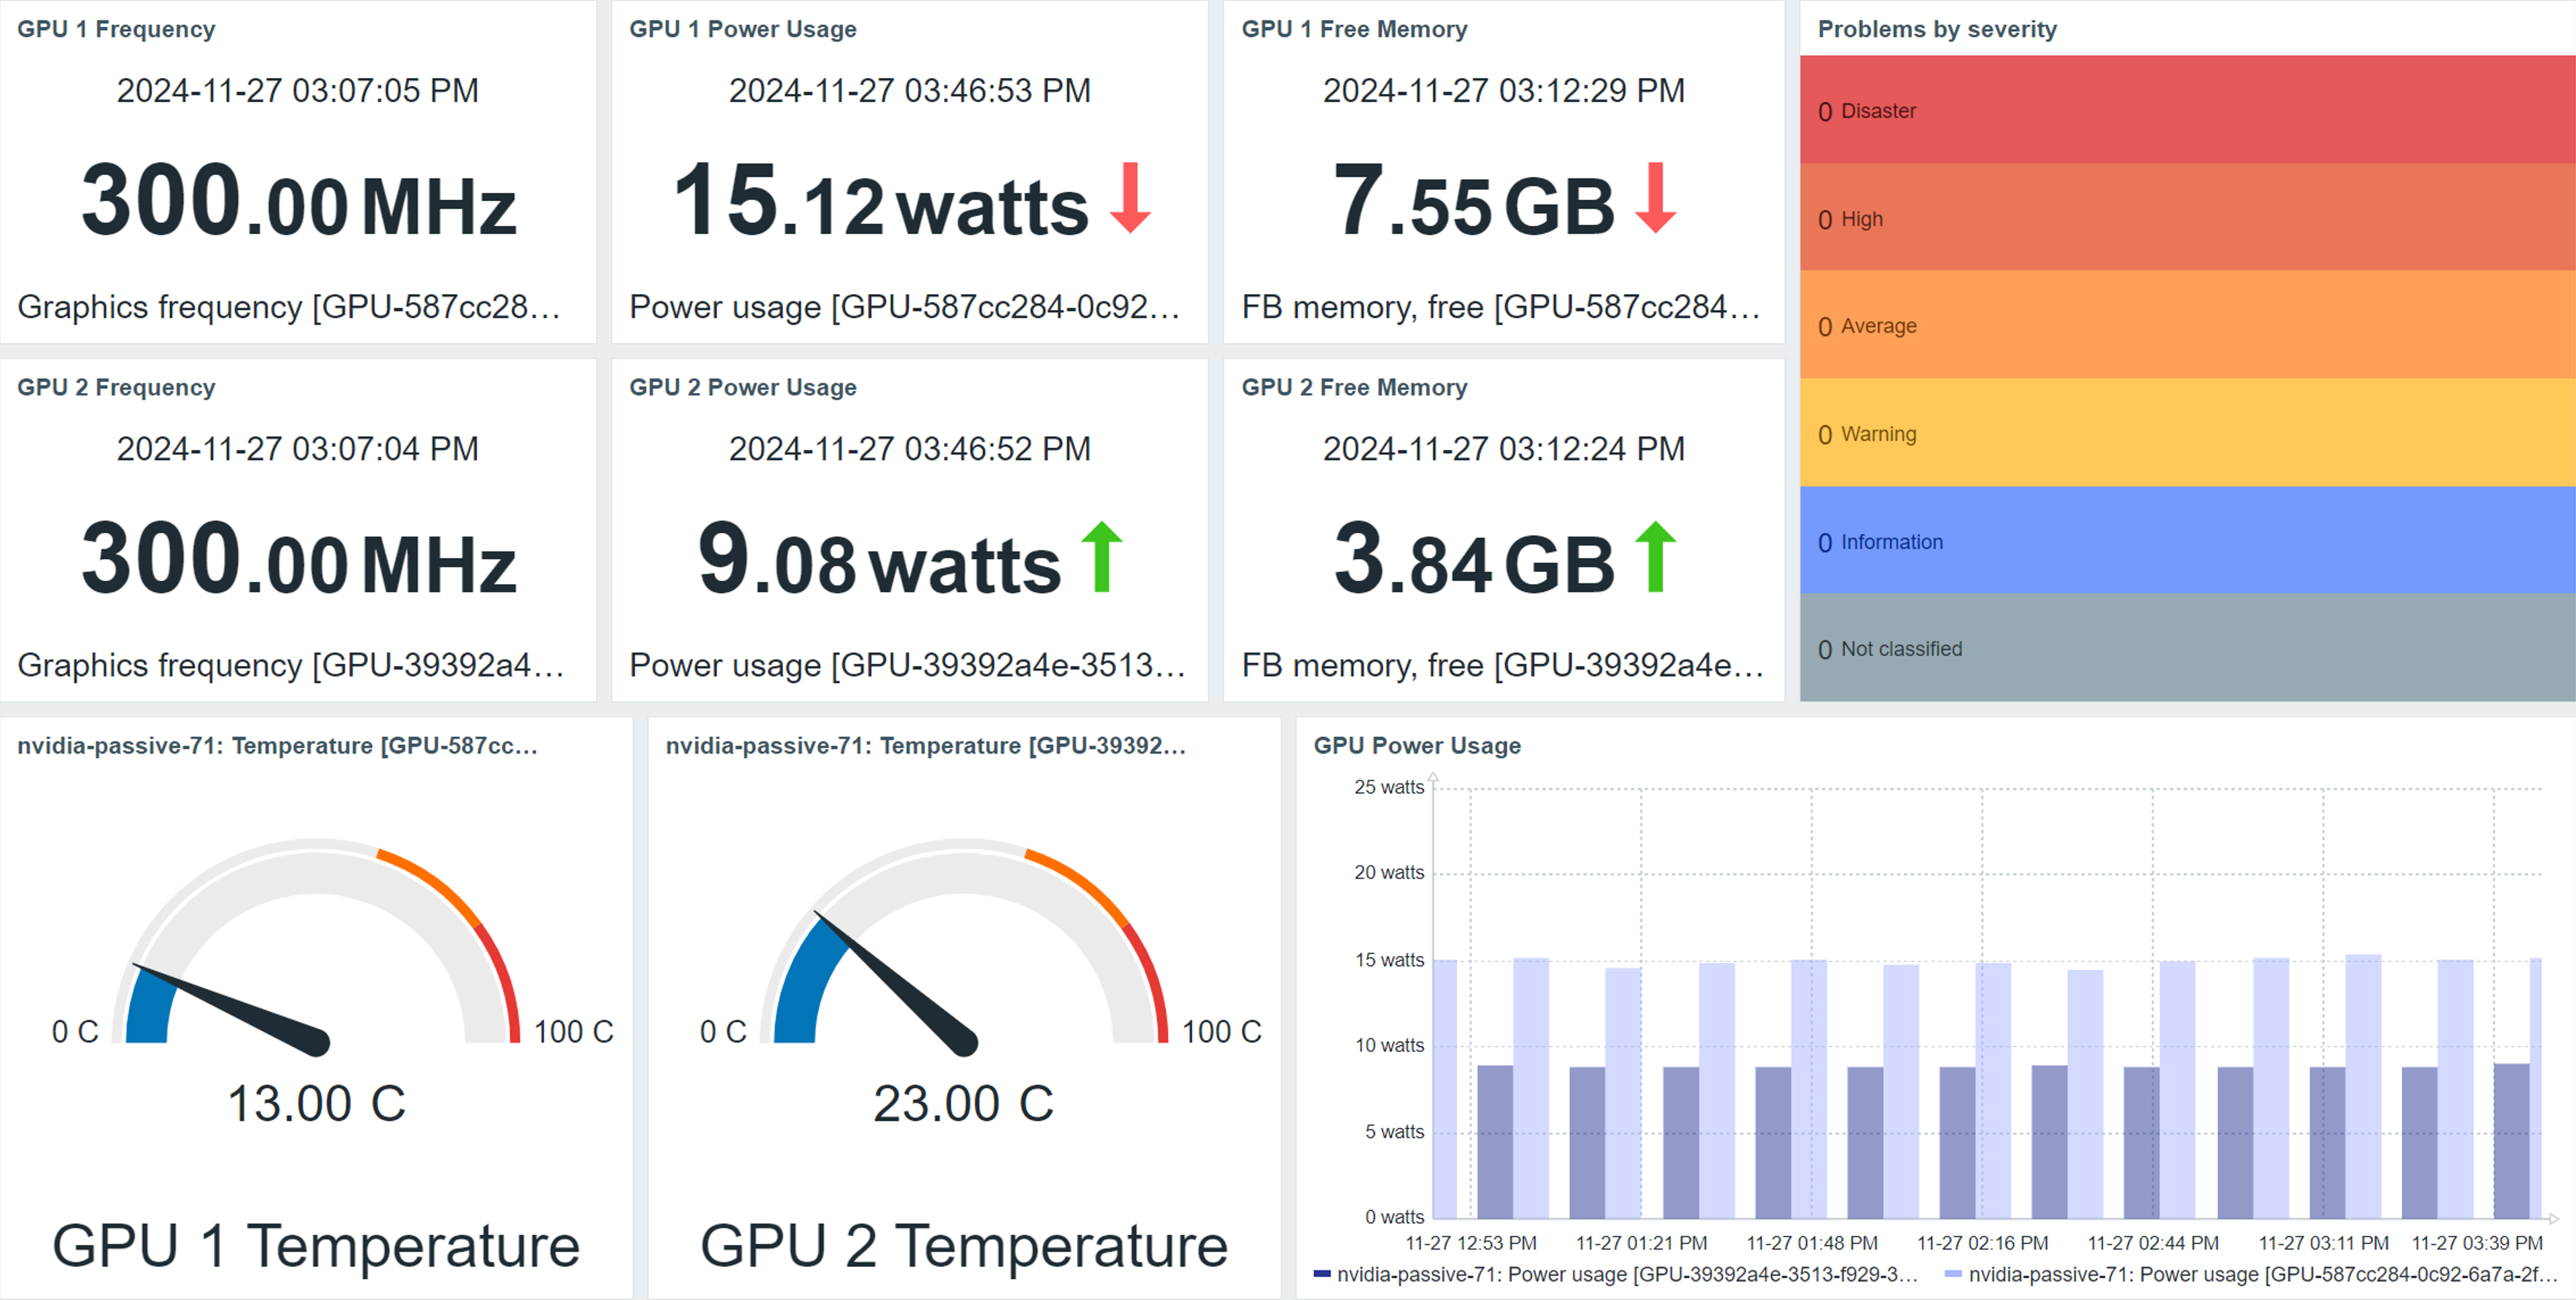
NVIDIA GPU Monitoring for Zabbix Agent 2
Zabbix 7.2 introduces a new official plugin for Zabbix Agent 2, enabling easy monitoring of NVIDIA GPUs. This plugin is fully integrated with the template “NVIDIA by Zabbix agent 2”, offering extensive monitoring capabilities without the need for external scripts.
Key Features:
- Automatic GPU Discovery: The template automatically detects all available GPU devices and their parameters.
- Support for Key Metrics: Monitor GPU utilization, memory usage, temperature, power consumption, performance, and other critical parameters.
- Preconfigured Dashboard: Includes clear graphs and statistics for easy tracking of GPU performance.
- Multi-platform Support: Compatible with both Linux and Windows.
Types of Monitored Data:
- Number of devices (GPU detection in the system).
- Driver and NVML library versions.
- Encoder, decoder, GPU, and memory utilization.
- Memory status (free, used, total).
- GPU temperature and power consumption.
- ECC memory errors.
This new plugin and template are the ideal solution for real-time monitoring of NVIDIA GPUs. They help maintain optimal performance, identify issues, and easily monitor hardware status.
Maximum Number of Rows in Widgets
The maximum number of rows that can be displayed in widgets on a dashboard has been increased from 100 to 1000. This change applies to the following widgets:
- Action Log
- Item History
- Problems
- Top Hosts
- Top Triggers
The new limit of 1000 rows corresponds to the ZBX_MAX_WIDGET_LINES parameter in frontend definitions. This increase provides users with access to a larger dataset directly on the dashboard, making data analysis more convenient and allowing for monitoring and analysis of larger datasets.
Removal of Dependent Item Limits
Zabbix introduces a significant improvement in the area of dependent items. The previous limitation of a maximum of 29,999 dependent items per master item and only 3 dependency levels (Master > Dependent > Dependent > Dependent) has been completely removed.
What this means:
- Unlimited Dependent Items: You can now monitor an unlimited number of metrics derived from a single master item, regardless of infrastructure complexity.
- Unlimited Dependency Levels: You can create more complex dependent item structures, enabling deeper and more detailed monitoring.
Benefits:
- More Flexible Monitoring: Create advanced monitoring scenarios without technical restrictions.
- Improved Scalability: Ideal for large environments that require monitoring of vast amounts of data with complex relationships between items.
- Simplified Configuration: Managing items is easier due to the removal of these limitations.
Improved Support for Environment Variables
The new support for environment variables simplifies configuration and deployment. Zabbix configuration parameters can now be specified directly through environment variables, making it significantly easier to work with containers and automated CI/CD processes.
Example: Configuring Zabbix Agent for a Container
When creating and configuring a custom image for Zabbix components (e.g., Zabbix Agent), you can define configuration parameters using environment variables and then start the container with these variables.
Preparing the Image: Set environment variables in the Zabbix Agent configuration file.
Hostname=${ZBX_HOSTNAME}
BufferSize=${BUFSZ}
ListenPort=${LISTENPORT}
UserParameter=${_UsrPar01}
UserParameter=${_UsrPar02}
Starting the Container: After building the image, run the Zabbix Agent container (e.g., in Docker) with the defined variables.
docker run --name initMAX-agent \
-e ZBX_HOSTNAME="initMAX-agent" \
-e BUFSZ=1000 \
-e LISTENPORT=20050 \
-e _UsrPar01="key1,ls" \
-e _UsrPar02="key2,pwd" \
--init -d zabbix/zabbix-agent:alpine-trunk
This approach enables easy configuration and flexible deployment of Zabbix components in containerized environments.
Complete removal of Oracle database support
Zabbix no longer supports Oracle as a backend database. This change reflects a shift towards more modern and open database solutions, which are more commonly used in today’s IT environments. For Oracle users, this means they will need to migrate to other database systems, such as PostgreSQL or MySQL.
Improved Data Collection in VMware Monitoring
Zabbix 7.2 introduces the memory pagination feature, which enhances the way data is collected from VMware environments. This makes monitoring more efficient and better suited for large-scale infrastructures.
Key Benefits:
- Improved Performance: Data is retrieved in smaller chunks, reducing the load on both the server and the VMware environment.
- Faster Updates: Optimized data collection methods result in quicker display of current values.
- Support for Large Environments: This feature simplifies monitoring in environments with many virtual machines and hypervisors.
This improvement ensures more stable and faster monitoring of VMware resources, even in very extensive systems.
New item for VMware templates
The new version adds a new item for the VMware Guest template, allowing monitoring of the hypervisor’s maintenance mode. If the hypervisor is in maintenance mode, issues are automatically suppressed. To disable issue suppression, you can set the macro value {$VMWARE.HYPERVISOR.MAINTENANCE} to 0. This enhancement is particularly useful for administrators who need an overview of the maintenance status and availability of virtual machines.
Configuration of SSH Public Keys
SSH communication security has been enhanced with new options for configuring public key algorithms. Zabbix users can now more easily and flexibly set security parameters for remote access via SSH, improving the overall security of the monitoring solution.
Support for SSH Subsystems
Zabbix now supports using the -s switch for SSH items, enabling connections to devices utilizing subsystems like NETCONF or SFTP. This enhancement expands monitoring capabilities for devices that allow access only through a single subsystem configured at the SSH level.
Example Configuration of an SSH Item with a Subsystem in Zabbix
To use a subsystem when configuring an SSH item, use the following key format:
ssh.run[unique short description,<ip>,<port>,<encoding>,<ssh options>,<subsystem>]Example Usage for the NETCONF Subsystem:
ssh.run[netconf-monitoring,192.168.1.100,22,utf-8,,netconf]Explanation of Individual Parameters:
unique short description
Item description, for example, “netconf-monitoring”.
<ip>
IP address of the device, for example, 192.168.1.100.
<port>
SSH port, default is 22.
<encoding>
Encoding, for example, utf-8.
<ssh options>
Additional SSH options, leave empty (“”) if not needed.
<subsystem>
Subsystem name, for example, netconf.
How it works:
This key establishes a connection to the device via SSH on the specified subsystem (e.g., NETCONF).
Zabbix sends a request over SSH using the -s switch and starts the subsystem defined in <subsystem>.
Support for Macros {FUNCTION.VALUE<1-9>} and {FUNCTION.RECOVERY.VALUE<1-9>}
Zabbix now supports the macros {FUNCTION.VALUE<1-9>} and {FUNCTION.RECOVERY.VALUE<1-9>}, which enable working with function results in triggers and their recovery expressions. These macros are highly useful in various contexts, such as notifications, event names, or scripts.
Example of Usage in Expression Macros: Difference Between Two Network Interfaces
If you want to calculate the difference between the data transferred on two network interfaces, you can use the macros {FUNCTION.VALUE1} and {FUNCTION.VALUE2} in expression macros.
The trigger monitors the data transferred on two interfaces, and you want to display the difference between their values.
Configuration at the trigger level in the event name (Event name):
Difference in traffic: {?{FUNCTION.VALUE1} - {FUNCTION.VALUE2}} bytesWhat happens:
{FUNCTION.VALUE1} refers to the first function in the trigger, for example:
last(/host/net.if.in[interface1]){FUNCTION.VALUE2} refers to the second function in the trigger, for example:
last(/host/net.if.in[interface2])If the values for interface1 and interface2 are, for example:
{FUNCTION.VALUE1} = 5000
{FUNCTION.VALUE2} = 3000
The result in the event name will be:
Difference in traffic: 2000 bytesUsage in problem recovery:
To display values during problem recovery, use the macro {FUNCTION.RECOVERY.VALUE<1-9>}. For example:
Recovered traffic difference: {?{FUNCTION.RECOVERY.VALUE1} - {FUNCTION.RECOVERY.VALUE2}} bytesMore Efficient Monitoring of Oracle Databases
Zabbix now supports the use of bind variables when monitoring Oracle databases. This technique separates the structure of the SQL query from its parameters, which:
- Improves query performance through optimized processing.
- Reduces the load on the database server.
This change accelerates and streamlines operations such as retrieving statistics about tablespaces.
New Macros in Zabbix
The following new macros have been added to Zabbix, expanding the possibilities for automation and working with events and services:
Timestamps (Unix timestamp):
{TIMESTAMP}– Current time.{EVENT.TIMESTAMP}– Time when the event occurred.{EVENT.RECOVERY.TIMESTAMP}– Time when the event was resolved.{EVENT.UPDATE.TIMESTAMP}– Time of the last event update.{EVENT.CAUSE.TIMESTAMP}– Time related to the root cause of the problem.{ITEM.LOG.TIMESTAMP}– Timestamp from a log item.
Details of actions during event updates:
{EVENT.UPDATE.ACTIONJSON}– Returns a JSON array containing details of actions performed during the issue update.
Service ID:
{SERVICE.ID}– Returns the numeric ID of the service that triggered the action.
New Macro Functions in Zabbix
Zabbix has introduced new macro functions that enable text manipulation and data encoding. These functions simplify handling values directly in Zabbix without requiring external scripts.
List of New Functions:
- regrepl: Replaces all occurrences of a value, starting with the first one.
- tr: Performs complete string transliteration (e.g., changes characters in a string according to defined rules).
- btoa: Encodes data into Base64 format using the PHP method
base64_encode(). - urlencode: Encodes text for URLs using the PHP method
rawurlencode(). - htmlencode: Converts special HTML characters into entities using the PHP method
htmlspecialchars. - urldecode: Decodes URL-encoded text using the PHP method
urldecode(). - htmldecode: Converts HTML entities back to their original characters.
- lowercase: Converts all letters to lowercase.
- uppercase: Converts all letters to uppercase.
Practical Uses:
- Value Manipulation: Modify data before using it in triggers or visualizations.
- Simplifying Templates: Process text data directly without additional scripts.
- Better Integration: Easily adjust data for various outputs, such as URLs or HTML.
These extensions make it easier to adapt monitoring to complex scenarios.
Overview of Minor Improvements
- Extended API for Users with Limited Roles
Users with the “User” role can now utilize themediatype.getmethod in the API. The displayed data is limited to essential fields (mediatypeid,name,status,description) to prevent sensitive information leaks. This enhancement increases media management flexibility for users with restricted rights. - Support for LLD Macros in Monitoring systemd Services
Thesystemd.unit.discovery[]item now returns the macro{#UNIT.SERVICETYPE}, indicating the service unit’s behavior (e.g.,simple,forking,oneshot,idle, etc.). This feature enables more precise monitoring and process automation for systemd services. - URL Links in Modal Configuration Forms
Modal configuration forms now support URL links, allowing forms to be opened in a new tab or URLs to be copied for sharing. This functionality enhances collaboration and improves workflow efficiency. - Configuration via Environment Variables
Configuration parameters can now be specified using environment variables, making it ideal for deploying Zabbix in containers and cloud environments. These variables allow overriding values in configuration files, simplifying configuration management. - Action Filtering by Media Types
A new option allows filtering actions by the media types used in their operations:- All: Displays all actions regardless of the media type.
- All Available: Displays actions that use all available media types.
- Specific: Displays only actions that use a specific media type.
- Automatic Dashboard Widget Updates
Dashboard widgets now support automatic updates. For example, selecting a specific element in one widget (e.g., a map or list) automatically updates other connected widgets (e.g., a problems list) based on the new context.
These enhancements bring greater flexibility, usability, and improve deployment and monitoring capabilities in Zabbix.
New and Updated Templates
New Templates:
- LAMP Stack Monitoring: Enables monitoring of Linux, Apache, MySQL, and PHP using active Zabbix agents.
- Juniper MX Series: Template for monitoring Juniper MX network devices.
- Huawei OceanStor V6 Dorado: Designed for monitoring Huawei OceanStor storage systems.
- Nutanix Prism Element: Facilitates monitoring of Nutanix hyper-converged infrastructure.
- NVIDIA GPU: Enables tracking of GPU utilization, memory, temperature, and power with automatic discovery and a prebuilt dashboard.
Updated Templates:
- Dell iDRAC and PowerEdge: Now utilize SNMP walk items for more efficient data collection.
- Proxmox VE by HTTP: Includes new items and triggers for monitoring disk space usage.
- MSSQL by ODBC: Performance counter queries have been refined for more accurate monitoring.
- Linux and Nextcloud: Unnecessary preprocessing steps removed from LLD rules to improve performance.
- Microsoft 365 Reports by HTTP: Description fixes for improved clarity.
These new and improved templates expand Zabbix’s monitoring capabilities, providing more comprehensive and efficient support for diverse environments.
Zabbix downloads and other useful links
- Zabbix 7.2 is available for download here: www.zabbix.com/download
- You can find the complete documentation for the new version here: https://www.zabbix.com/documentation/7.2/en/manual/introduction/whatsnew720
As official partners and big fans of the Zabbix platform, we are able to provide you with services in all areas of Zabbix monitoring at the highest level. If you’re interested in a live demonstration of Zabbix installations for our clients, we’d be happy to show you Zabbix in action.

Give us a Like, share us, or follow us 😍
So you don’t miss anything: