Zabbix 8.0 LTS is almost here!
The new Zabbix 8.0 LTS release brings a number of exciting new features.
| Contact us for a free consultation | CONTACT US FOR A FREE CONSULTATION AND DEMO |
|
We’ve prepared topic-focused webinars for you |
|
| Training for the latest LTS version (Zabbix 7.0) | MORE INFORMATION ABOUT THE TRAINING |
| You can also explore our DEMO Zabbix. Log in using the “sign in as guest” button. | SIGN IN TO DEMO ZABBIX |
New CEP correlation engine (Complex Event Processing)
One of the major new features in Zabbix 8.0 is the new CEP correlation engine, or Complex Event Processing. It builds on the existing event handling model, but takes it a level further: instead of evaluating individual problems in isolation, it allows Zabbix to evaluate relationships between multiple events, work with time windows, tags, host groups, and follow-up operations.
In practice, this addresses one of the most common monitoring problems. One real incident often generates tens or hundreds of events. A network, database, storage, or central service outage can affect many hosts and applications at once. Without additional logic, the administrator is not dealing with one incident, but with a long list of related problems. CEP helps turn those events into a more understandable picture.
The purpose of CEP is not just to show that a problem occurred. The goal is to apply more advanced logic to the event stream: group related problems, evaluate them within a time window, add tags, change severity, suppress less important events, or distinguish between a cause and its symptoms.
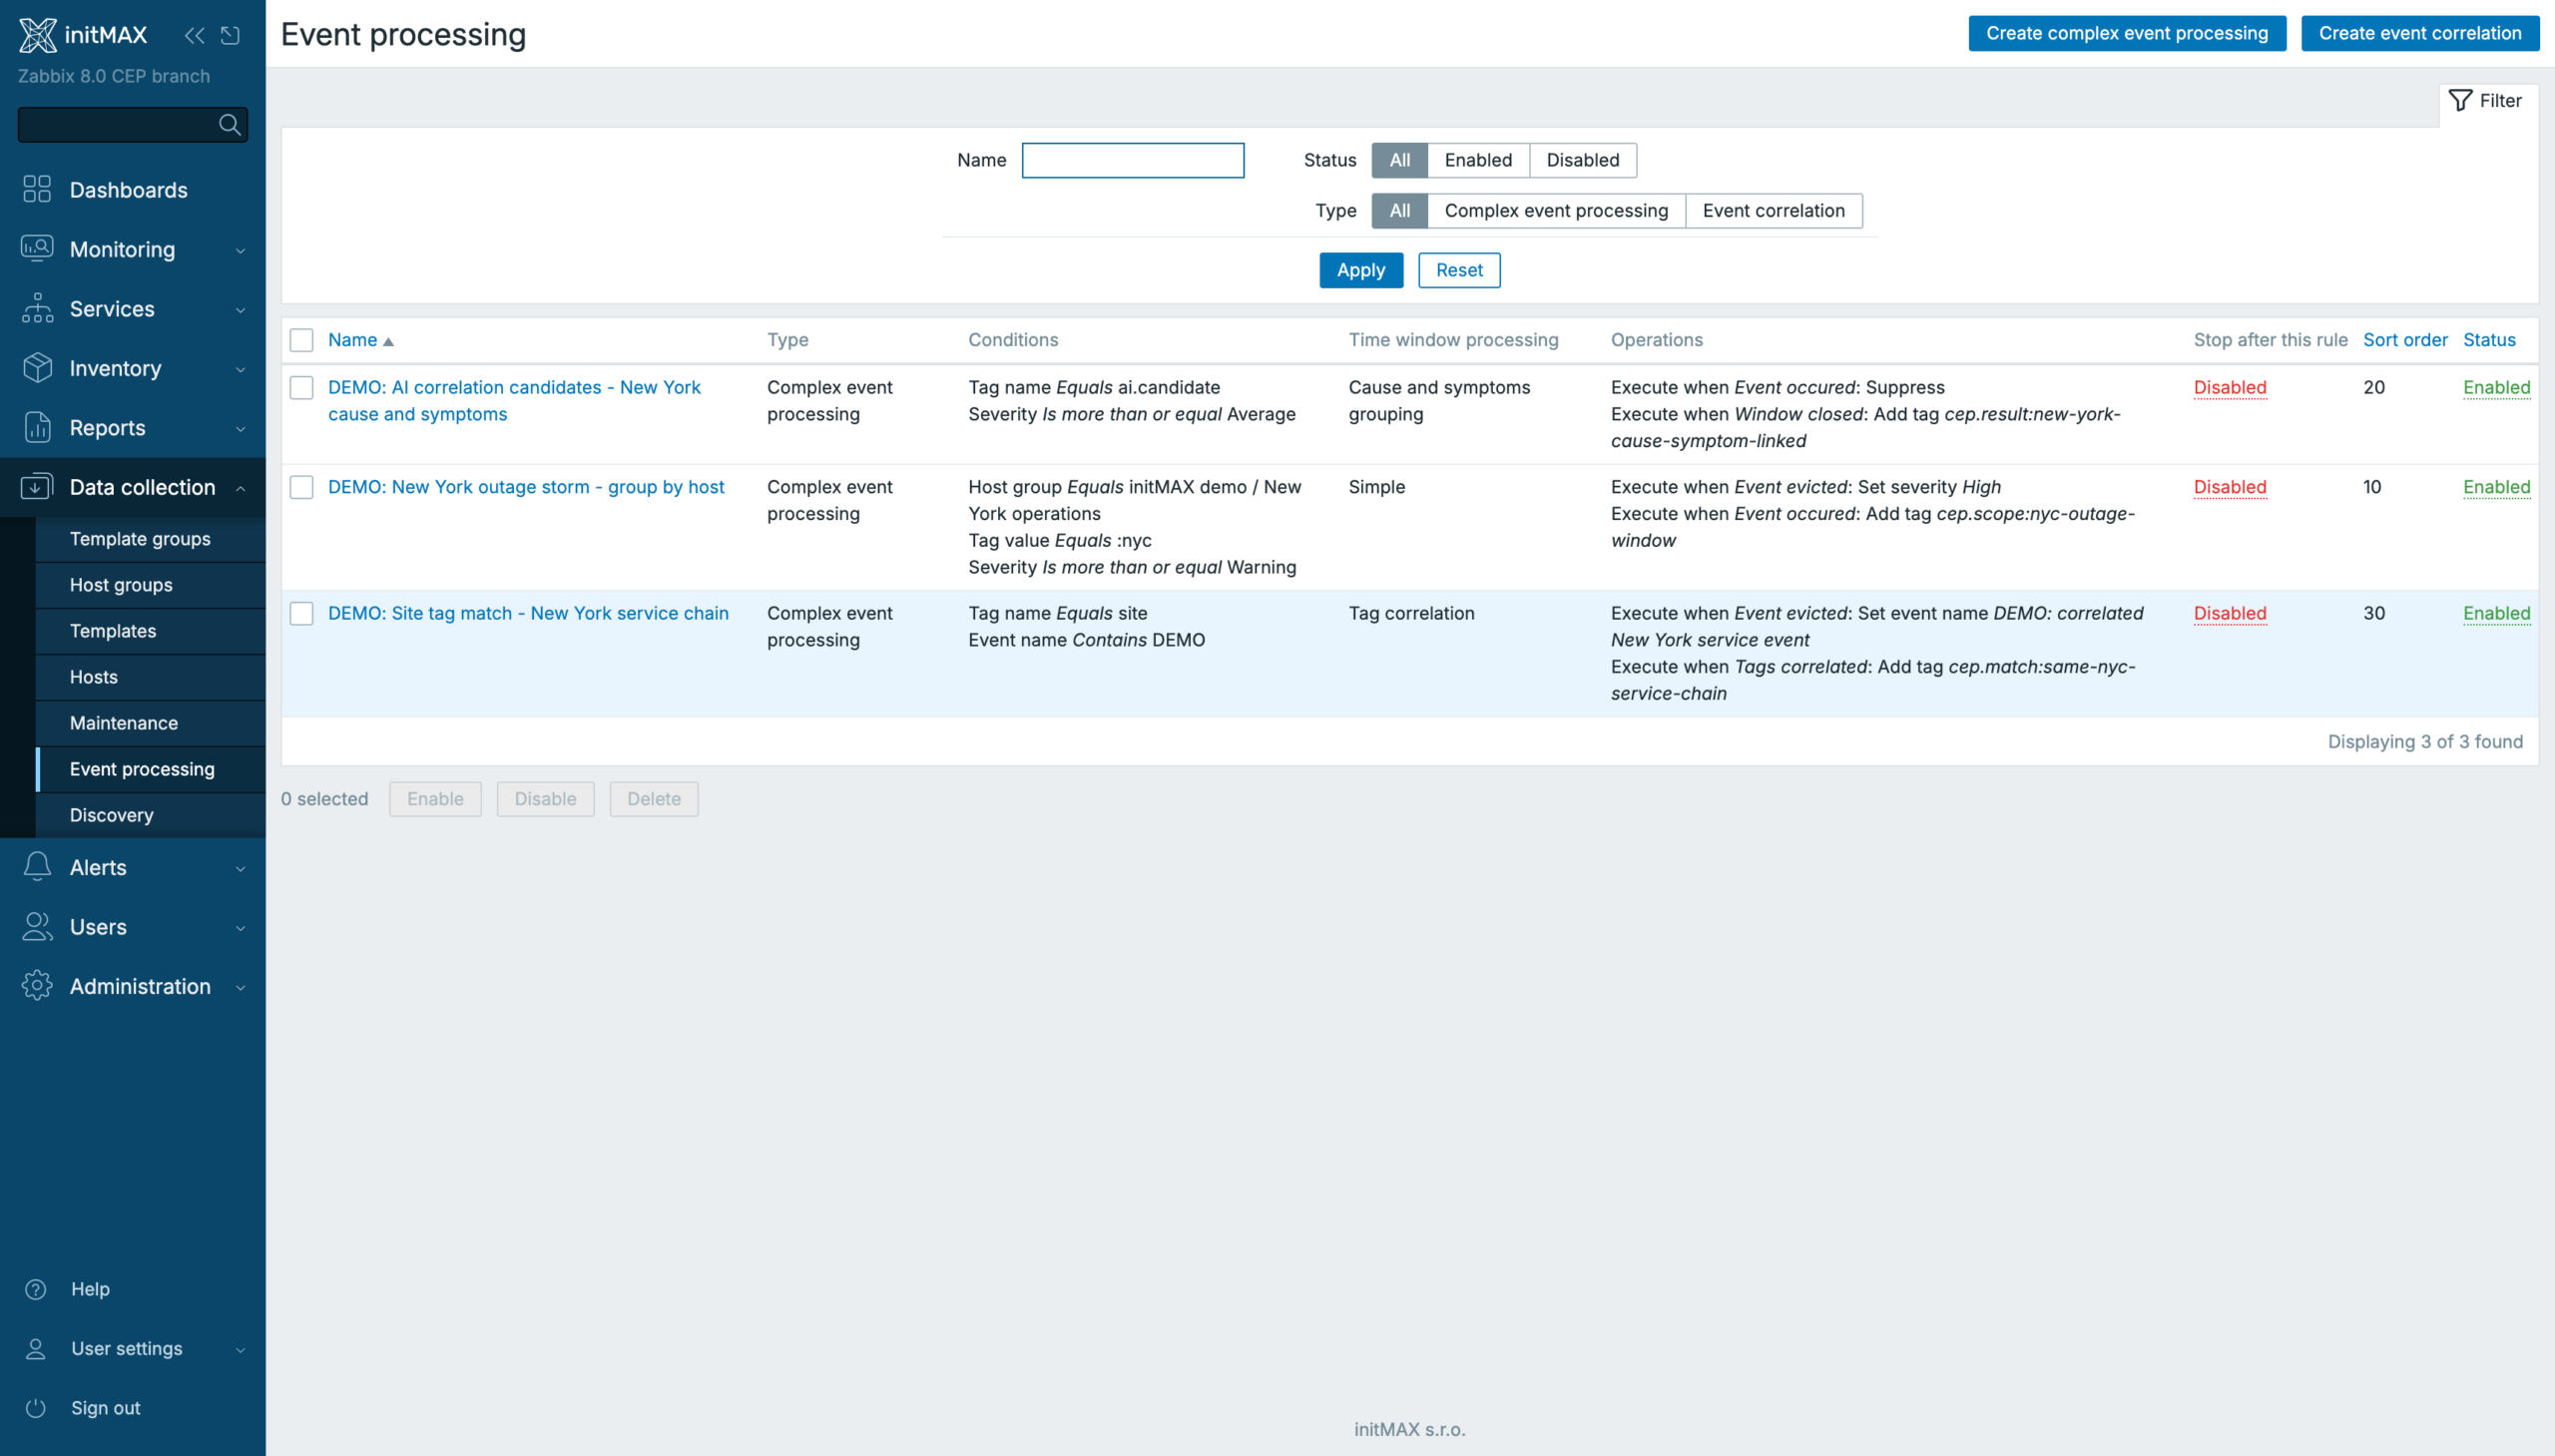
The configuration is available under Data collection > Event processing.
Rule detail
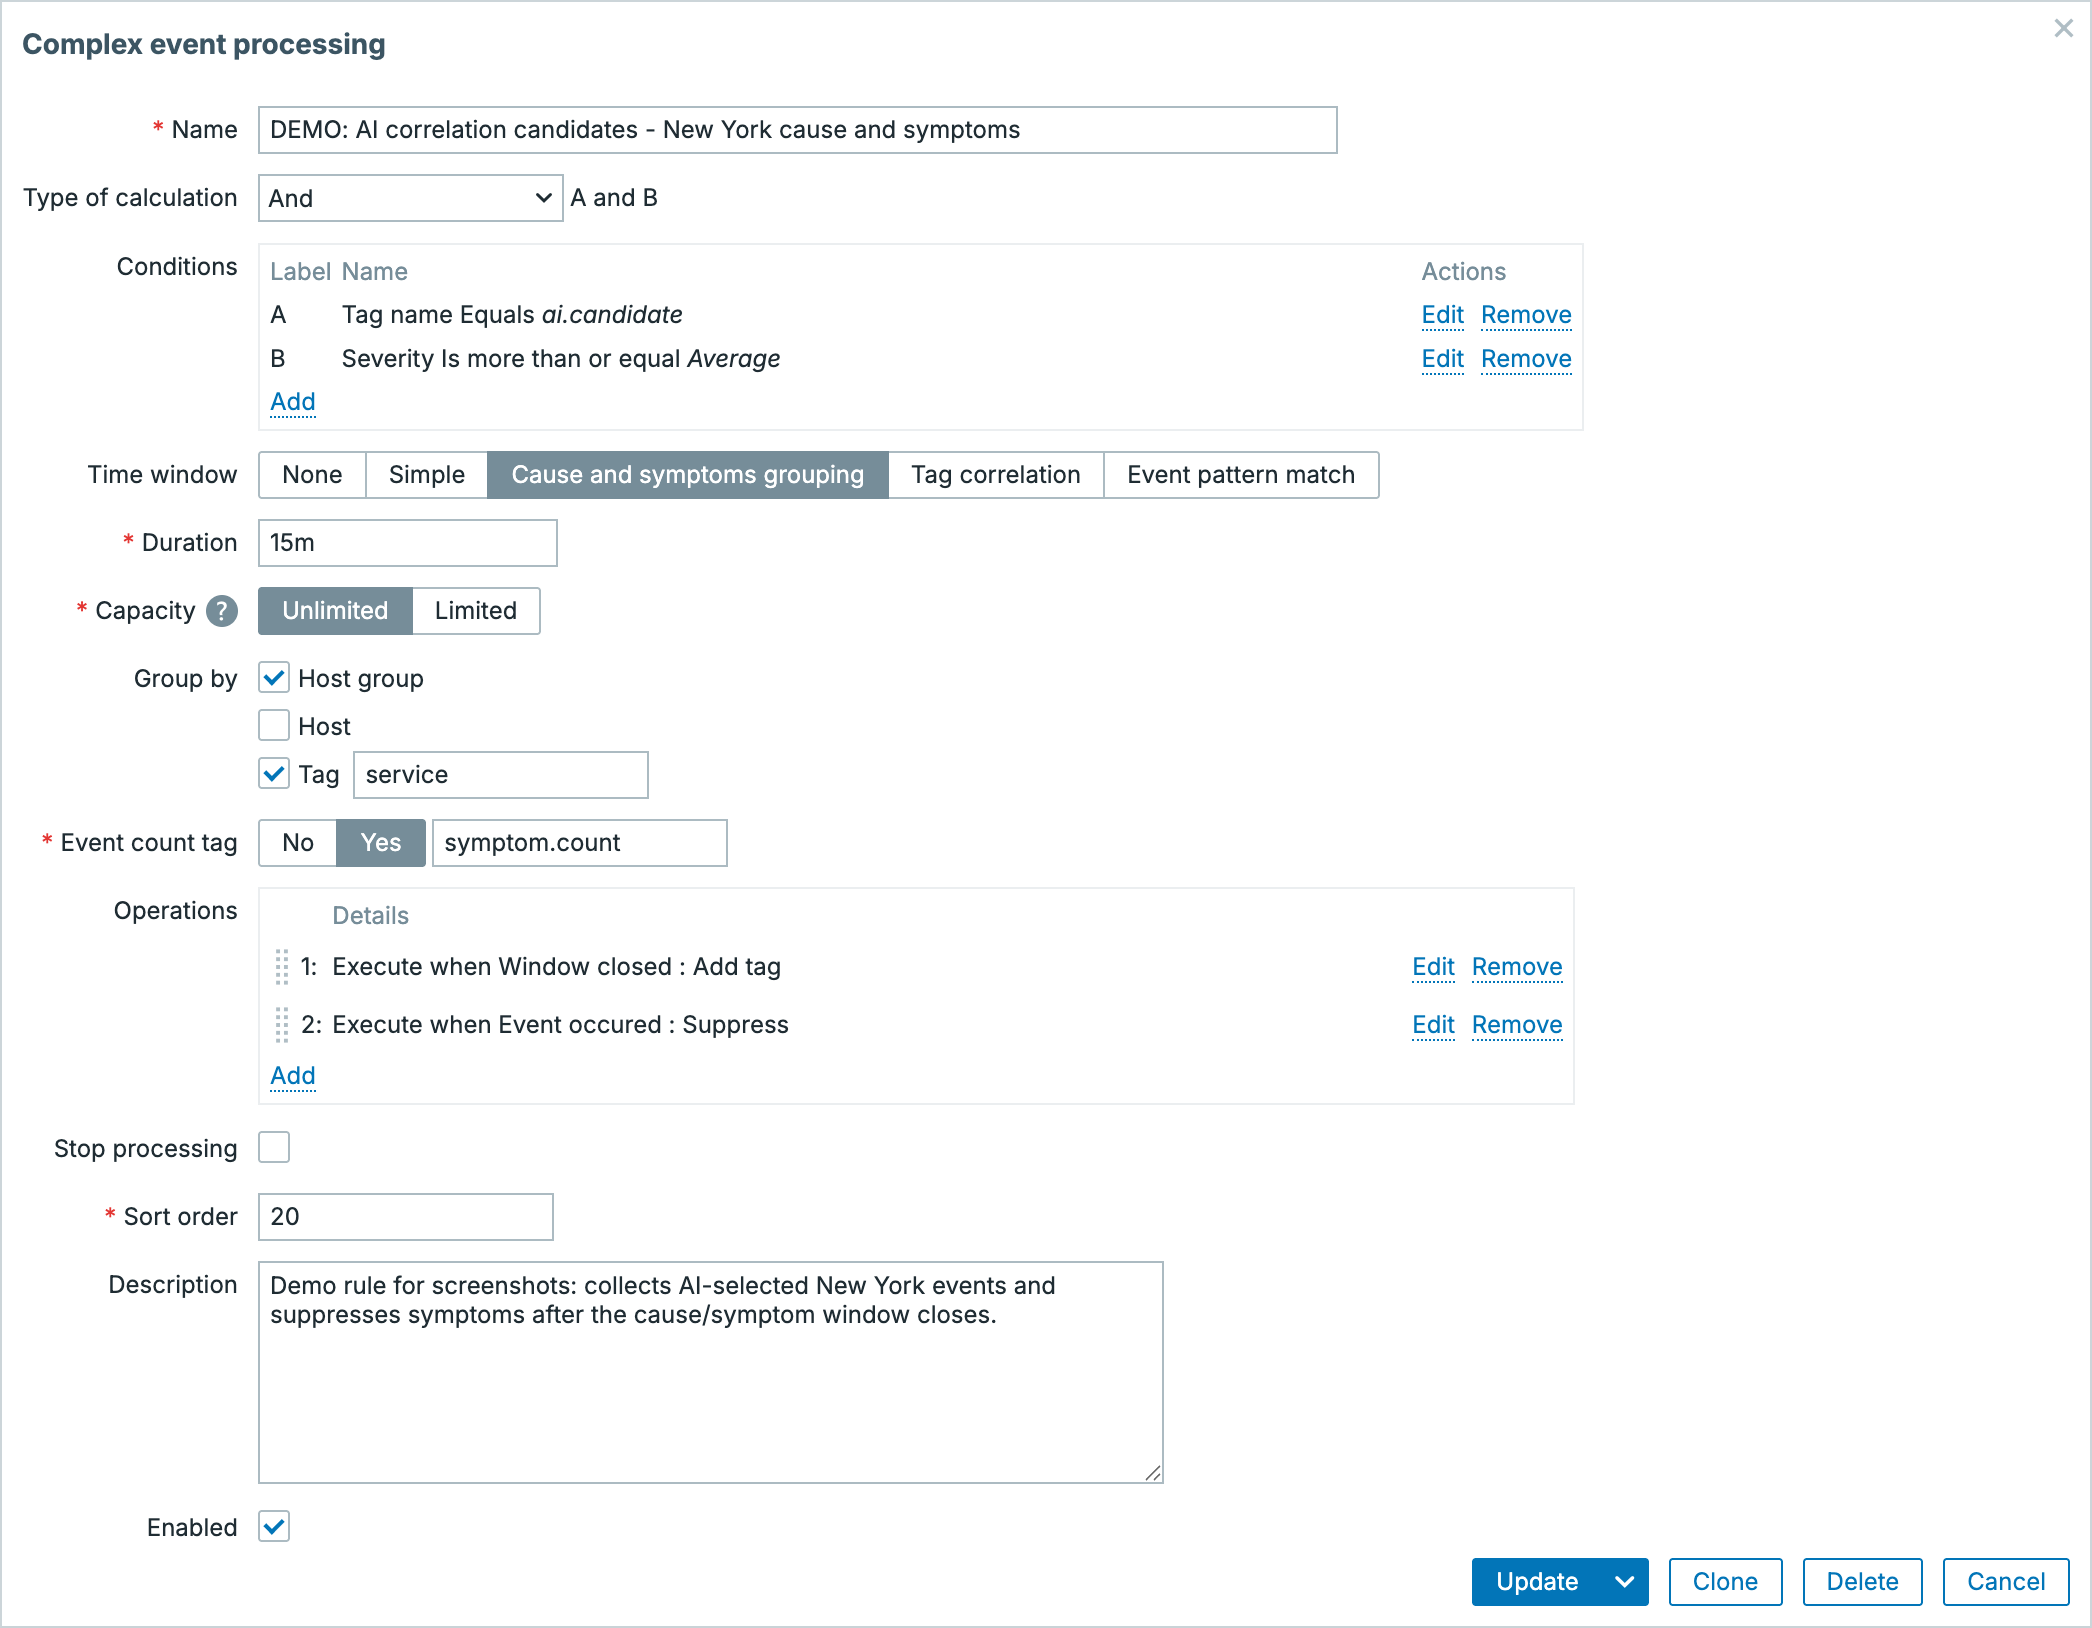
The screenshot shows the detail of a CEP rule. The top part defines which events the rule should catch, the middle part contains the time-window and grouping logic, and the lower part defines the operations Zabbix will perform on matching events.
- Name is the operational identifier of the rule. In larger installations, it makes sense to include the rule purpose in the name, such as location, service, incident type, or expected correlation result.
- Type of calculation and Conditions form the input filter. A rule can select events by name, severity, host, host group, or tags. In the example, the rule works with a New York host group, a location tag, and minimum severity. This is where Zabbix decides which events enter the correlation logic at all.
- Time window defines how events are processed over time.
- None means the rule reacts without a time window.
- Simple keeps matching events for the period set in Duration.
- Cause and symptoms grouping is intended for cause-versus-symptom relationships.
- Tag correlation pairs events based on tags.
- Event pattern match works with an event pattern.
- Duration defines the length of the window. A value such as
10mmeans related events are watched within a ten-minute interval and can be evaluated as one correlation context. - Capacity limits the number of events in the window. After the limit is reached, an event can be evicted from the window because of the capacity restriction. Operations such as Event evicted can then react to that situation, for example by changing severity or adding a tag.
- Group by defines how events inside the window are split into groups. In practice, this can be a host group, host, or a specific tag value such as location, service, or environment. With tags, the exact name including letter case matters.
- Event count tag is used in modes where the number of related events matters. The result can be written into a tag, so the scope of the correlation is visible directly on the problem.
- Operations are the rule output. This is where you define what Zabbix should do with the events: add or modify a tag, change severity, suppress a symptom, change the event name, or otherwise affect further processing.
- Stop processing stops evaluation of further CEP rules for the same event after the current rule is processed. This is important for rule prioritization and for cases where one rule clearly classifies the incident.
- Sort order defines the evaluation order. Lower values are processed earlier, so together with Stop processing it can control the priority of the whole correlation logic.
The operation options inside a CEP rule look like this:
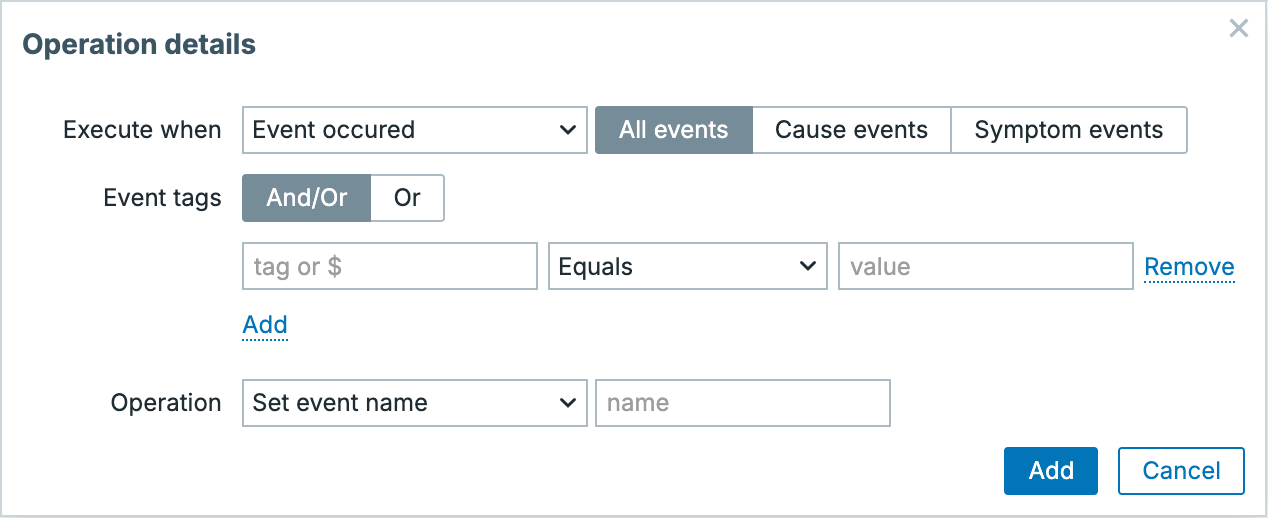
In the Operation details dialog, you first define when the operation should run and which part of the correlated events it should apply to. The All events, Cause events, and Symptom events switches are especially important for rules that distinguish between a cause and symptoms. Below that, you can add an additional event tag filter, so the same CEP logic can perform different actions on different types of events.
- Event occurred runs when a new matching event enters the rule. It is useful for immediately adding context, such as a tag or an adjusted event name.
- Event evicted runs when an event leaves the time window, for example because of a capacity limit or because time has moved on. This makes it possible to distinguish events that no longer belong to the current correlation group.
- Window closed is evaluated when the time window closes, after the period set in Duration. This is useful for actions that should happen only after the full group of events has been collected.
- Tags correlated is used with tag-based correlation when the rule finds events with shared context.
- Event pattern matched belongs to the mode where an event pattern is evaluated. It is useful when a simple count or shared tag is not enough and the sequence or combination of events matters.
The lower Operation part is the actual action Zabbix performs on the selected events. It is therefore not only a filter that finds events, but also the follow-up processing. Depending on the operation type, additional fields are shown, such as a new event name, target severity, tag name, or tag value.
- Set event name changes the event name. This is useful when you want to turn several technical messages into a more readable incident name.
- Close and Discard work with the event lifecycle. One option closes the event, while the other can remove it from further processing if it no longer adds value in the given correlation context.
- Set severity, Increase severity, and Decrease severity adjust severity based on what CEP detects. A standalone problem may have lower priority, but in combination with other events it may represent a more serious incident.
- Suppress suppresses a selected event, typically a symptom that should not be shown as prominently as the probable cause.
- Add tag, Set tag, and Set tag value add or modify tags. This is useful for filtering, notifications, dashboards, and follow-up automation.
- Increase tag value and Decrease tag value work with the tag value as a counter or numeric context, for example for the number of related events in a correlation group.
- Rename tag and Remove tag help normalize event metadata so Zabbix can continue working with consistent naming.
- Copy first and Copy last make sense in pattern match scenarios where you want to carry information from the first or last event in the detected pattern.
Example: incident in the New York location
As a simple example, imagine that several problems appear within a short time in the New York location: on an edge gateway, a database cluster, and an application server. Each problem makes sense on its own, but for the operator it is more important to know that they probably belong to the same incident.
Before correlation
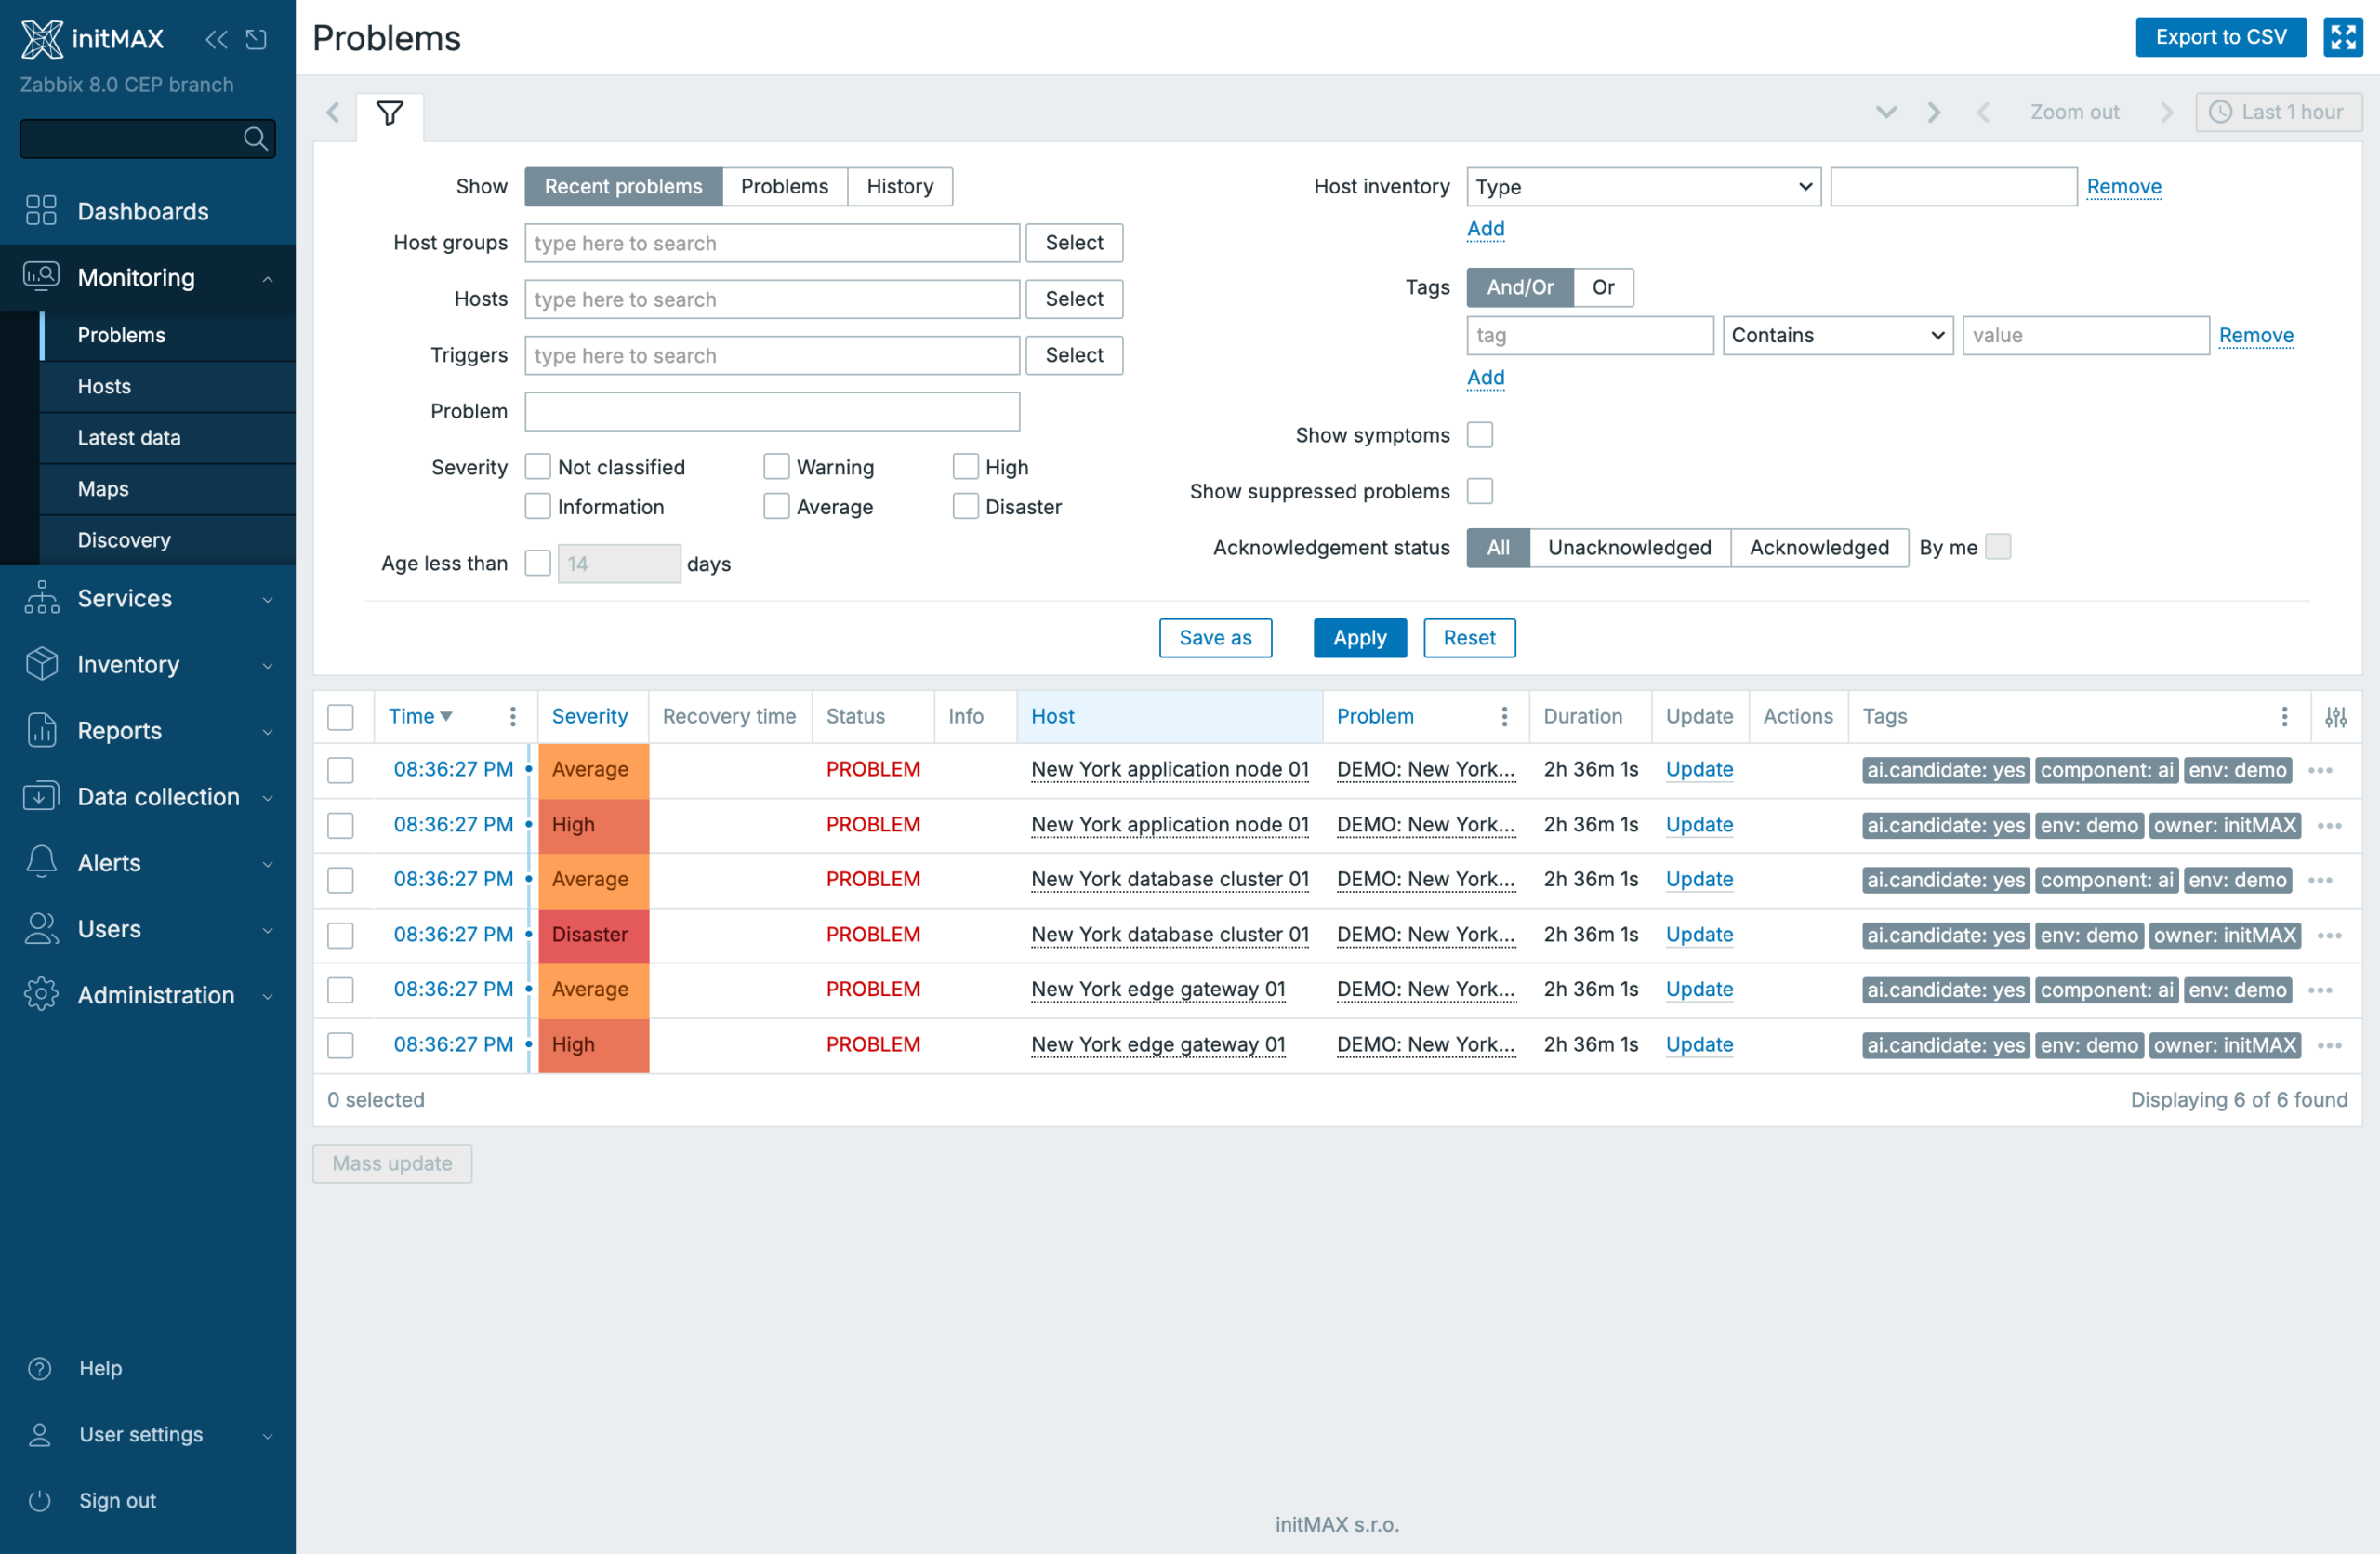
Without correlation, this is a normal list of problems. We can see several events with shared context, such as site=nyc, region=us-east, or similar services, but Zabbix still displays them primarily as separate problems. The operator has to infer the relationship from names, hosts, severity, and tags.
- the problems occurred in the same time period,
- some of them share location tags, such as
site=nycandregion=us-east, - some events can be marked as candidates for further analysis, for example
ai.candidate=yes, - without additional logic, it is not immediately clear what the main cause is and what is only a symptom.
After correlation
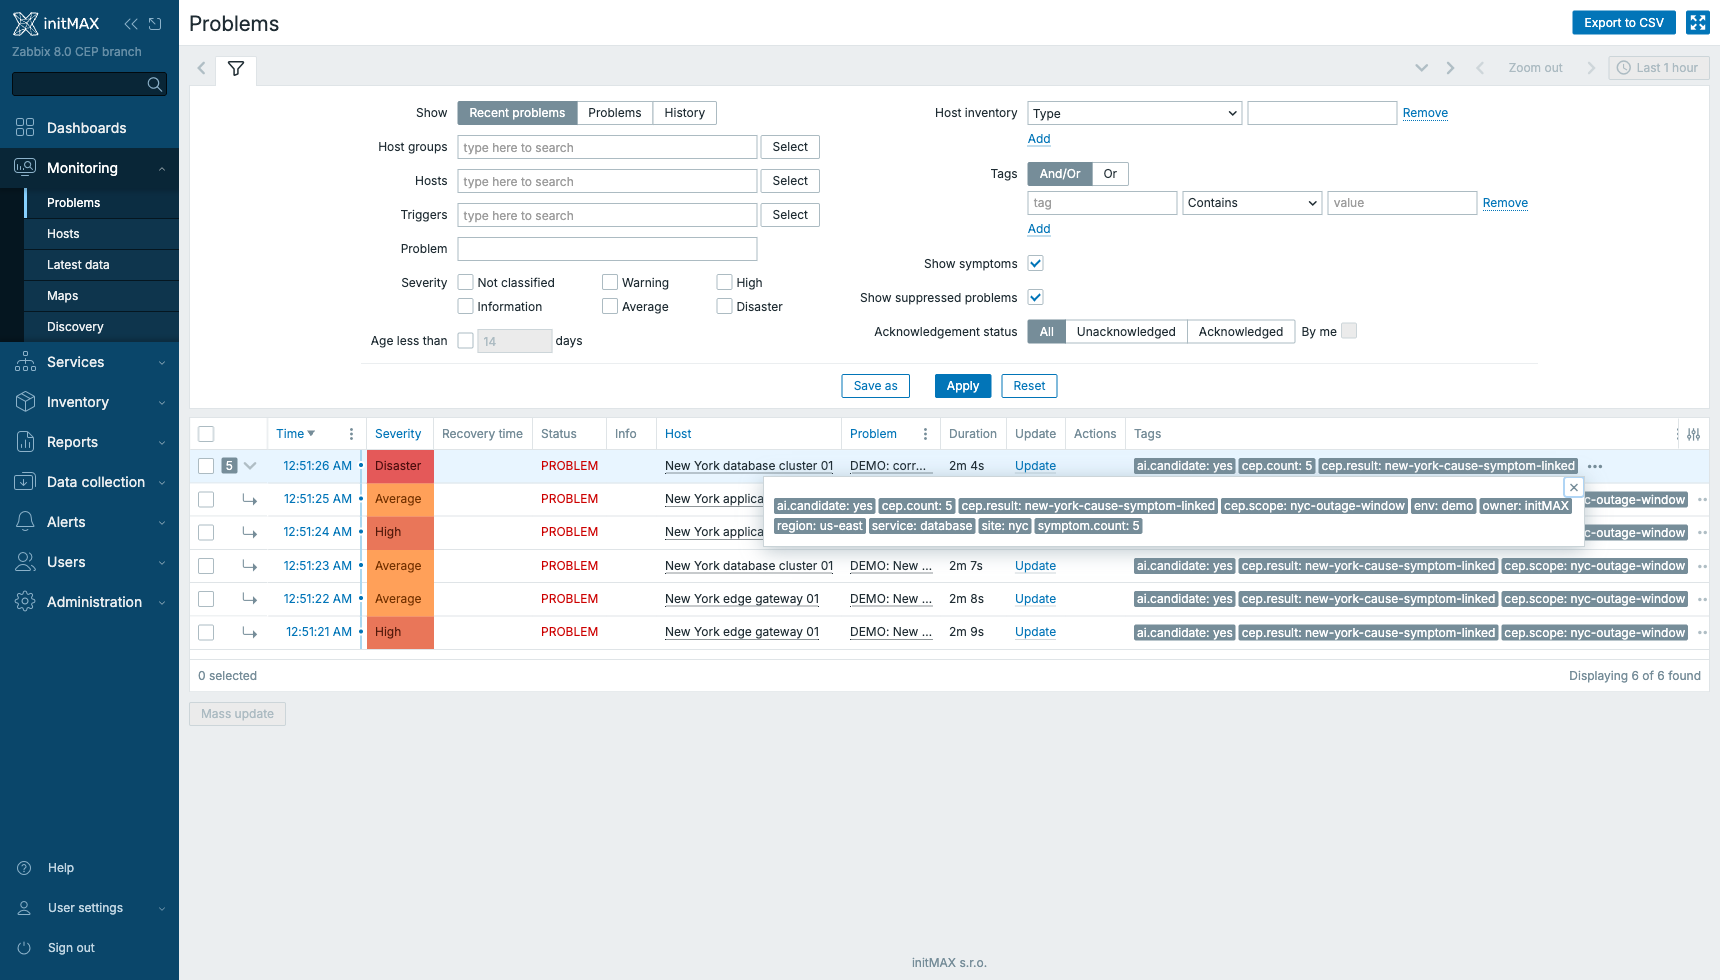
After the CEP rule processes the events, they start behaving as a related group. In the example, the database problem is marked as the probable cause and the other problems are treated as symptoms. The Problems view also shows the number of linked symptoms and the output tag cep.count=5, which adds the correlation scope directly into the event metadata.
- Root cause remains visible as the main problem the operator should focus on first.
- Symptoms do not disappear, but they are linked to the main cause. They provide context without pretending to be separate incidents of the same importance.
- Shared tags, such as
cep.scope=nyc-outage-window, make later filtering, reporting, notifications, and automation easier. - Count tag, for example
cep.count=5, shows the number of related symptoms or the scope of the affected group directly in event data.
The practical effect is that monitoring no longer presents only a longer list of individual problems. Events get context: what probably belongs together, what looks like the cause, which problems are symptoms, and how large the related event group is.
We see CEP as one of the main changes in Zabbix 8.0. It is not a replacement for the existing problem workflow, but a new level of event management: Zabbix can maintain context over events, link them into related groups, and automatically add information that administrators would otherwise have to find manually.
The original global event correlation rules remain in the UI, but they are marked as a legacy/deprecated path next to the new CEP. In practice, this means existing rules do not disappear, but new development is moving toward Event processing and CEP.
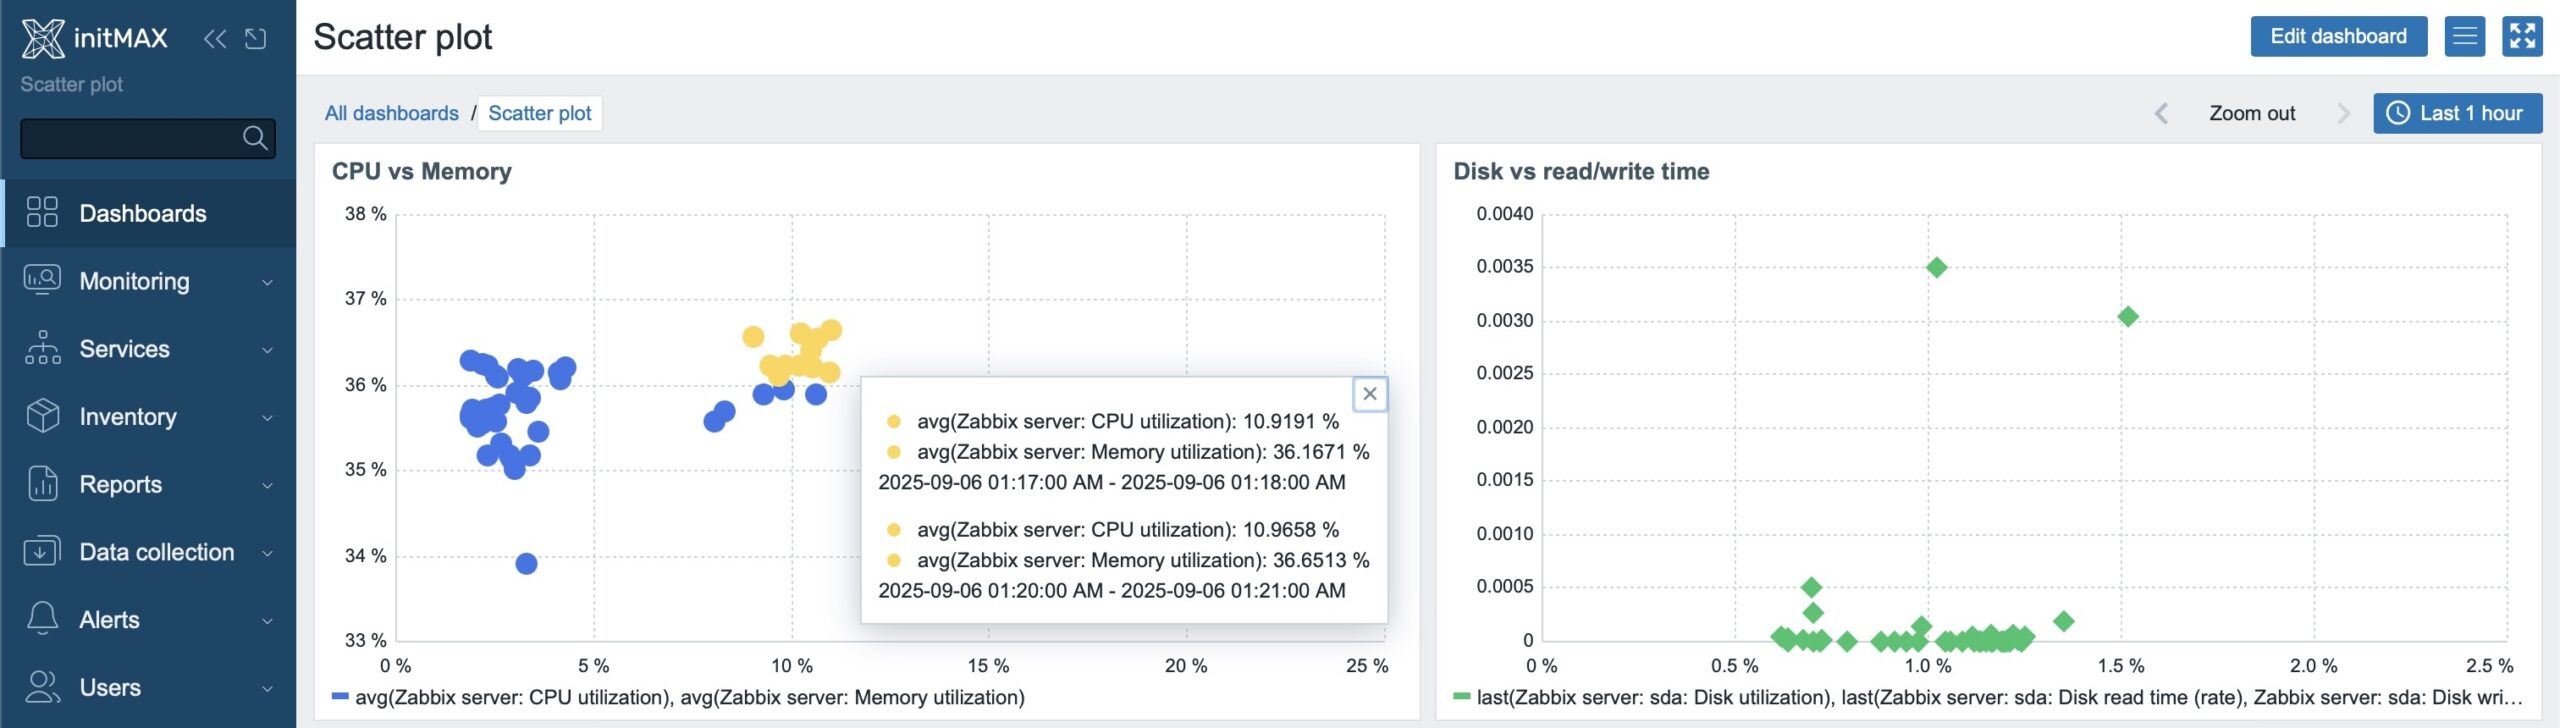
Widget Scatter Plot
Simply put: you take two metrics (X and Y axis) and Zabbix will plot points for each host/time interval. At a glance, you can see correlations (or the lack of them), clusters of problematic machines, and anomalies that could easily be missed in a classic time-series chart.
Benefits
- Metric relationships: e.g., “when CPU increases, does RAM also increase?”
- Outliers: quickly detect servers that stand out.
- Visual triage: instantly see where to focus first.
How it works
- Datasets: multiple sets; each has an X-Axis item and a Y-Axis item.
- Host filtering: Host patterns / Host groups / Host tags.
- Aggregation: Aggregation interval (e.g., 1m) + function (e.g., avg) → one point per window.
- Appearance: choose marker and size; tooltips with values; time shift for period comparison.
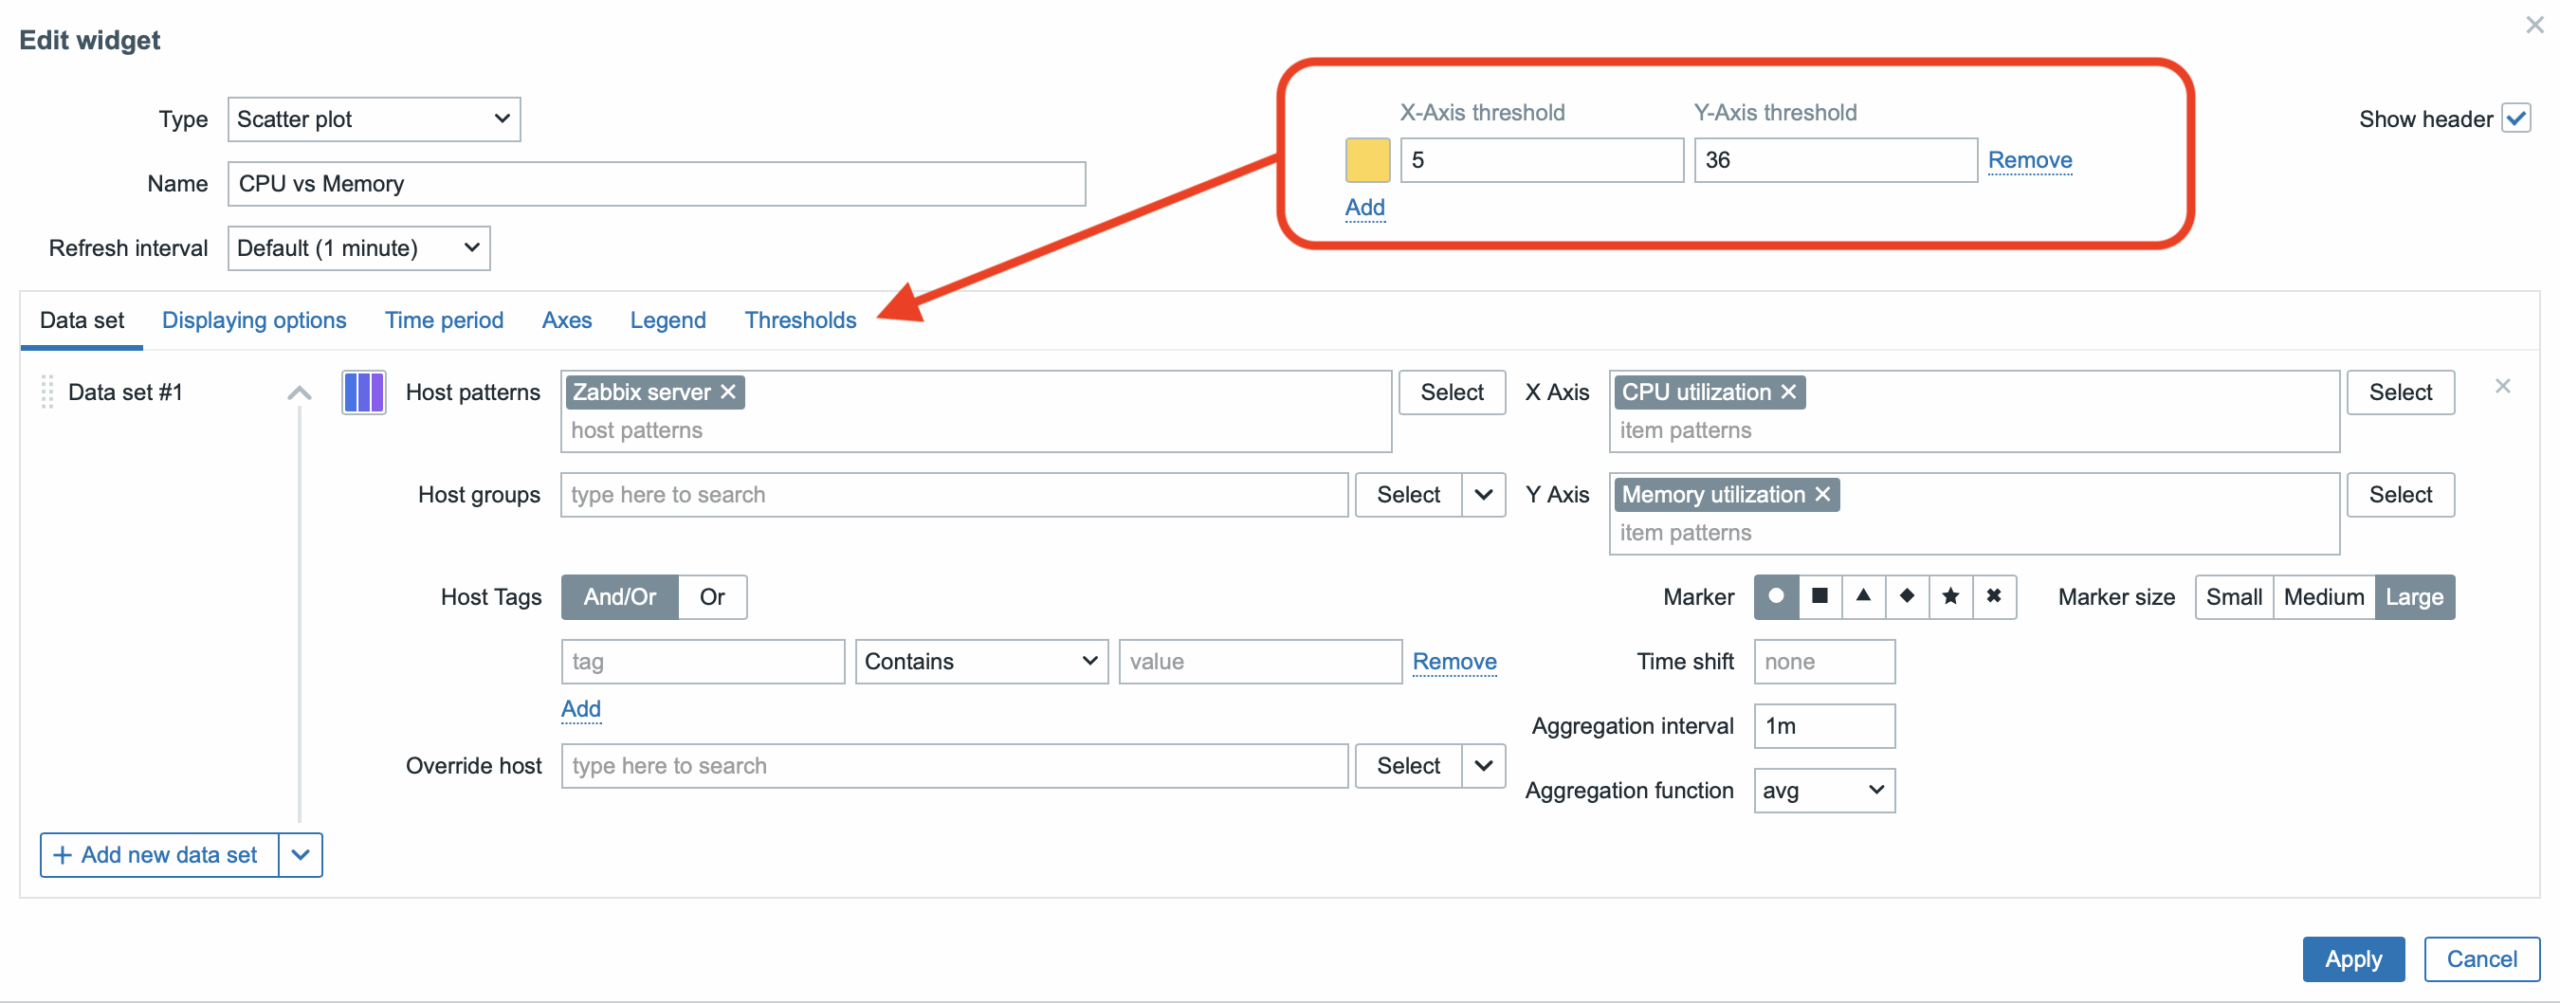
Thresholds
Combined conditions for X and Y change the point’s color, e.g., X ≥ 5 AND Y ≥ 36. Multiple rules = multiple colors → anomalies become instantly visible (see image).
Example Scenarios
- CPU load vs. Memory usage
X axis: average CPU load
Y axis: percentage of RAM used
→ Quickly shows whether hosts with high CPU also have high RAM usage. Great first diagnostic for “CPU bound” vs. “RAM bound.” - Disk usage vs. I/O latency
X axis: disk utilization (%)
Y axis: latency (ms)
→ Identifies servers with overloaded storage. The combination of high utilization + high latency is a red flag for I/O. - Network traffic vs. Error rate
X axis: outgoing/incoming traffic (bps)
Y axis: error rate (dropped packets, errors)
→ Finds machines with low traffic but many errors – typically bad links, duplex, MTU, or driver issues. - Response time vs. Availability (services/apps)
X axis: average response time (ms)
Y axis: availability (%)
→ Differentiates “slow but stable” vs. “fast but unreliable” services. A strategic view for prioritizing team effort.
ClickHouse backend and significant improvements for Elastic
A major new feature is support for ClickHouse as an optional storage backend for historical data. The main motivation is clearly its close connection to the new support for JSON data types-with this volume and structure of data, an analytical backend like ClickHouse makes perfect sense.
The concept and configuration are very similar to what many of you already know from the optional Elastic integration. Zabbix can store historical data in an alternative backend without changing the core architecture. ClickHouse can store all history data types except BIN, which covers the vast majority of both common and advanced use cases.
A big advantage is that you can combine Elastic and (now) ClickHouse and split data types based on what makes the most sense-while keeping PostgreSQL as the primary backend for most standard history.
A typical scenario could be, for example:
- LOG / TEXT / CHAR → Elastic (search, full-text, log analytics, and text-based observability queries)
- Numeric data (float/uint) → PostgreSQL (a stable, proven time-series backend for classic metrics and trends; simplicity, compatibility, and battle-tested operation)
- JSON → ClickHouse (high analytical performance for semi-structured data, aggregations, filtering, and wide queries over JSON structures)
And of course, you can adjust the strategy based on your priorities-e.g., if you want to push as much as possible to an analytical backend, or if you prefer the simplest architecture and use ClickHouse only where it brings the biggest impact (typically JSON).
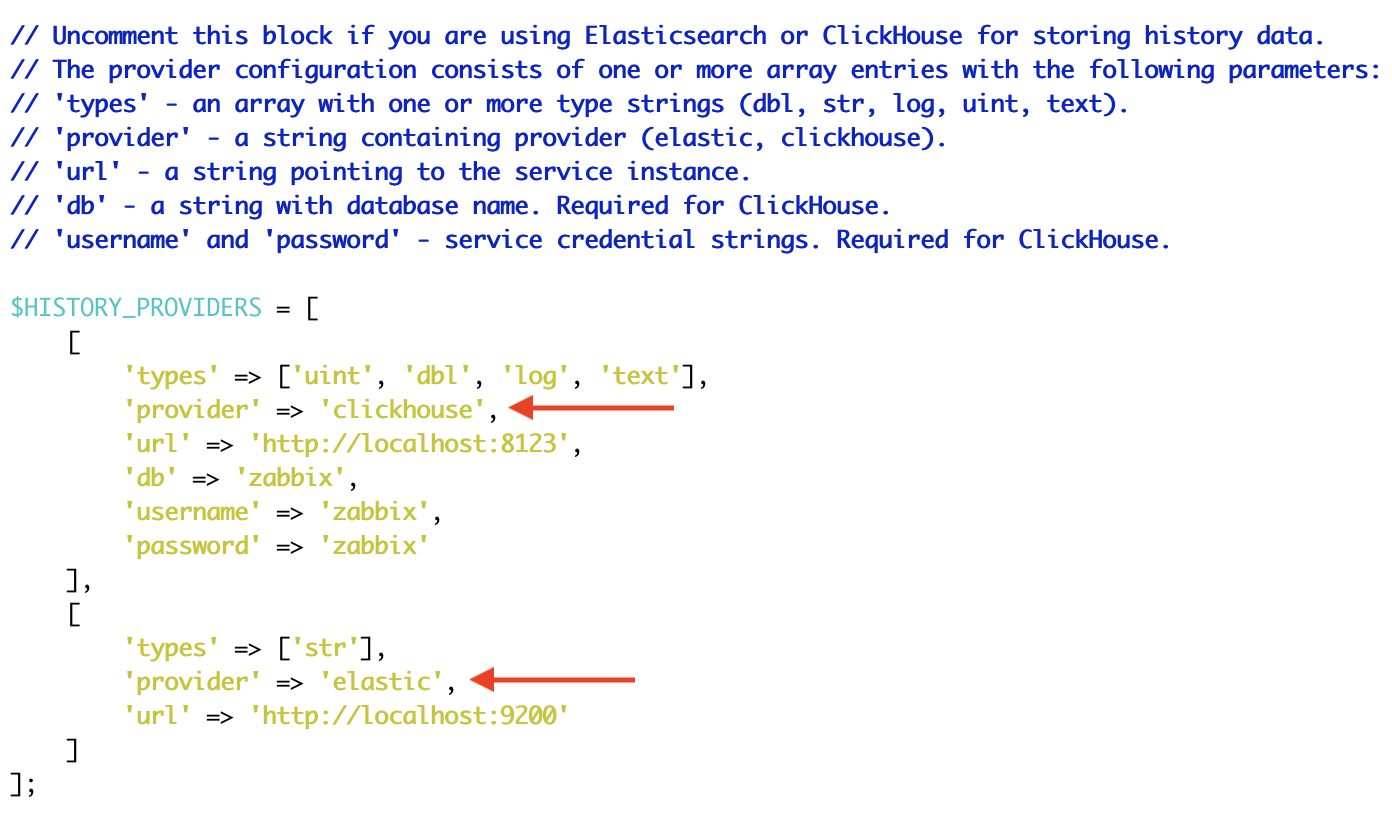
Frontend configuration (Zabbix UI / frontend)
Frontend configuration is defined in /etc/zabbix/web/zabbix.conf.php using the $HISTORY_PROVIDERS array. Each backend (ClickHouse, Elastic) is listed as a separate item in this array-therefore the individual blocks are separated by commas (standard PHP syntax). In practice, you can set ClickHouse as the primary provider for selected value types and add another provider (e.g., Elastic) right below it for str.
Server configuration (Zabbix server)
The second part of the configuration is in /etc/zabbix/zabbix_server.conf, where individual providers are defined on separate lines using the repeated HistoryProvider directive. Unlike the frontend, this is not a “list of items” but a configuration in the form provider;options, where the options themselves (url=..., db=..., username=...) are comma-separated.
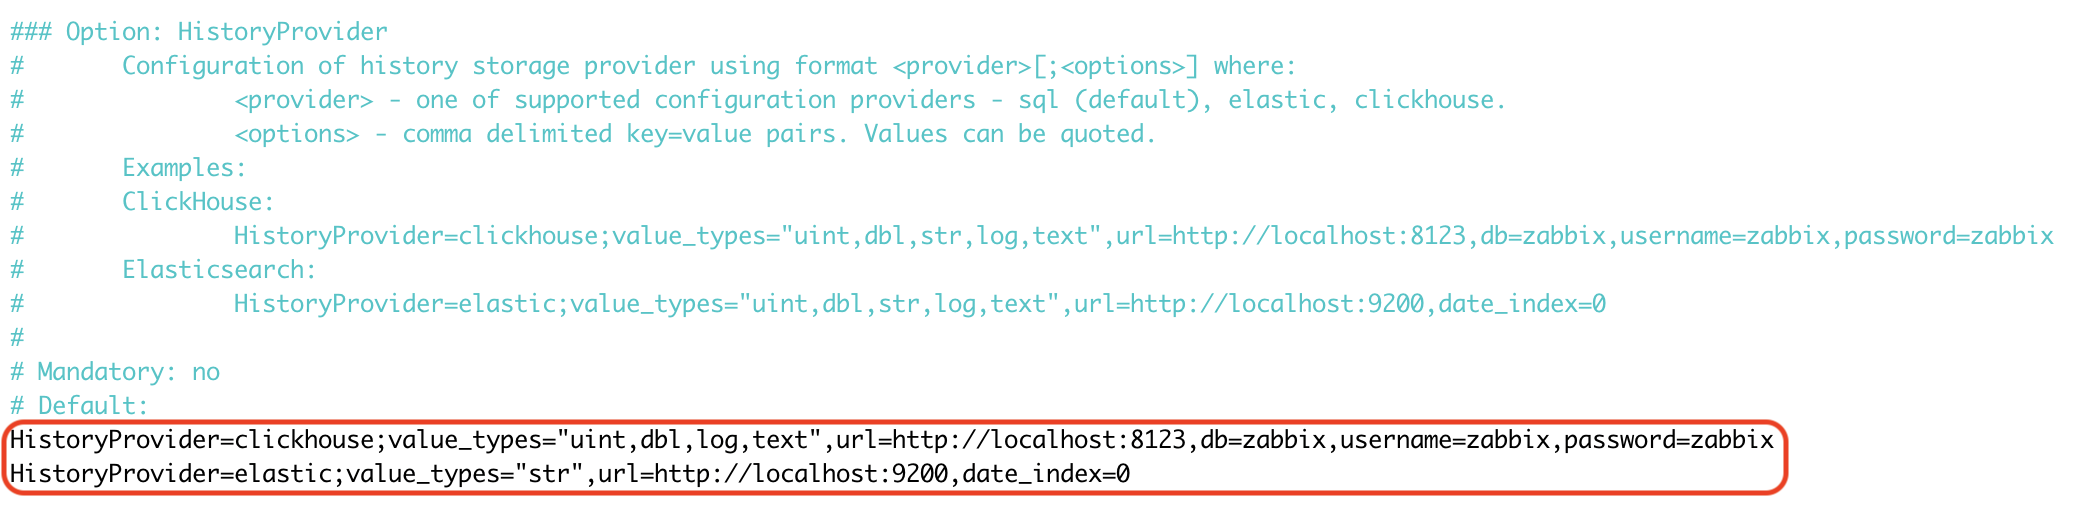
Using these backends is also very easy to verify directly in the Zabbix server log-right at startup, Zabbix prints the list of active history providers (including the detected version and assigned value_types), so you immediately know where each type of historical data is being stored.

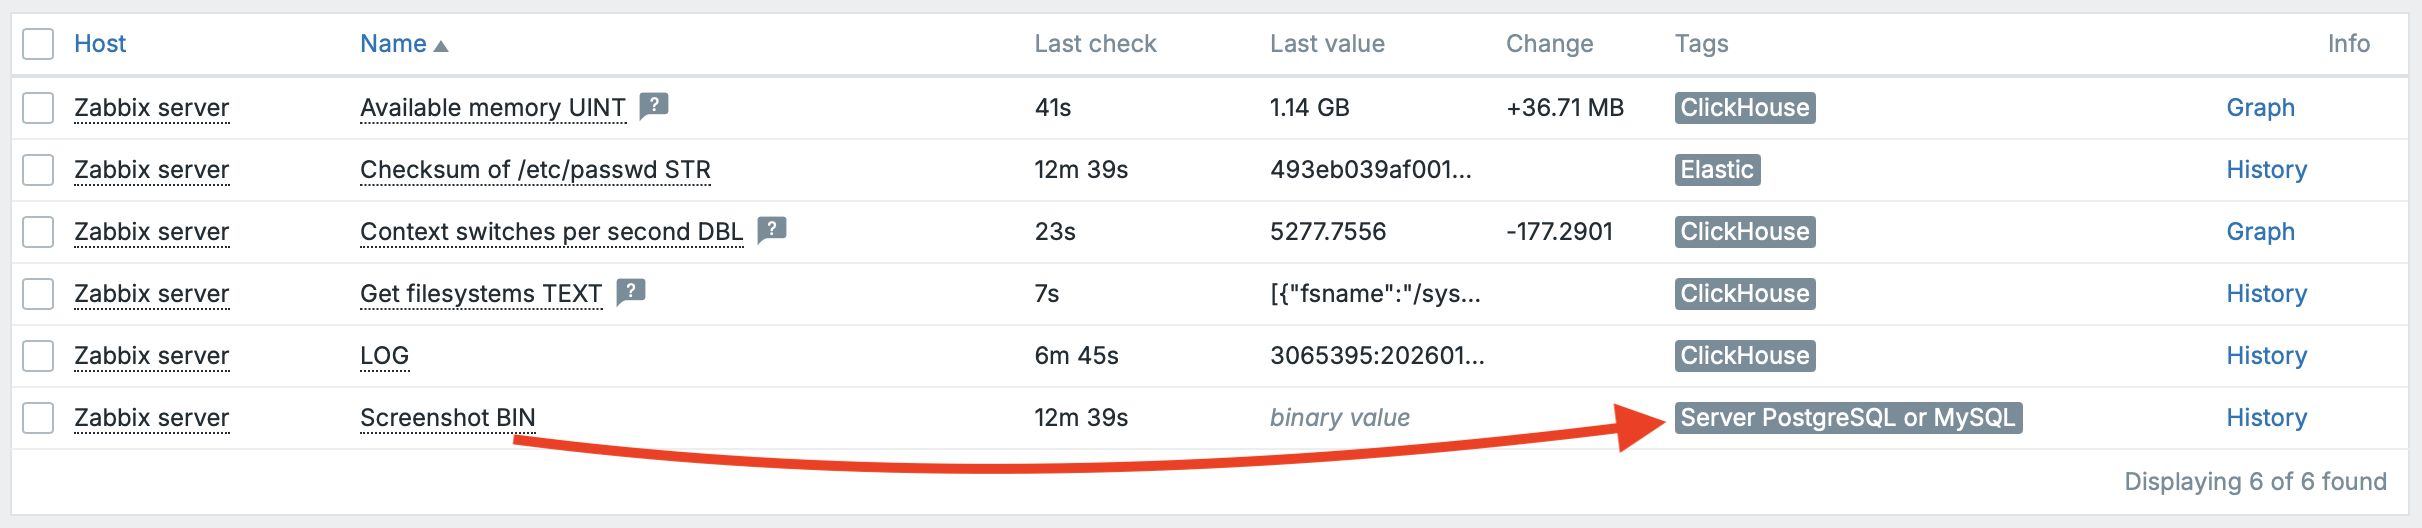
In the frontend, the data looks exactly the same-there is no UI-level difference whether historical data is stored in PostgreSQL, ClickHouse, or Elastic. Zabbix transparently displays the latest values, history, and graphs regardless of the backend used; the only exception is BIN values, which remain stored in the server’s primary database (PostgreSQL/MySQL).
Elasticsearch
The Elastic backend has also undergone significant internal changes-the biggest difference is in the way it communicates. It now relies more on connection reuse and other optimizations in the network layer and request handling. As a result, this backend is noticeably faster from Zabbix’s perspective, especially in environments with a high query rate and a large volume of stored data.
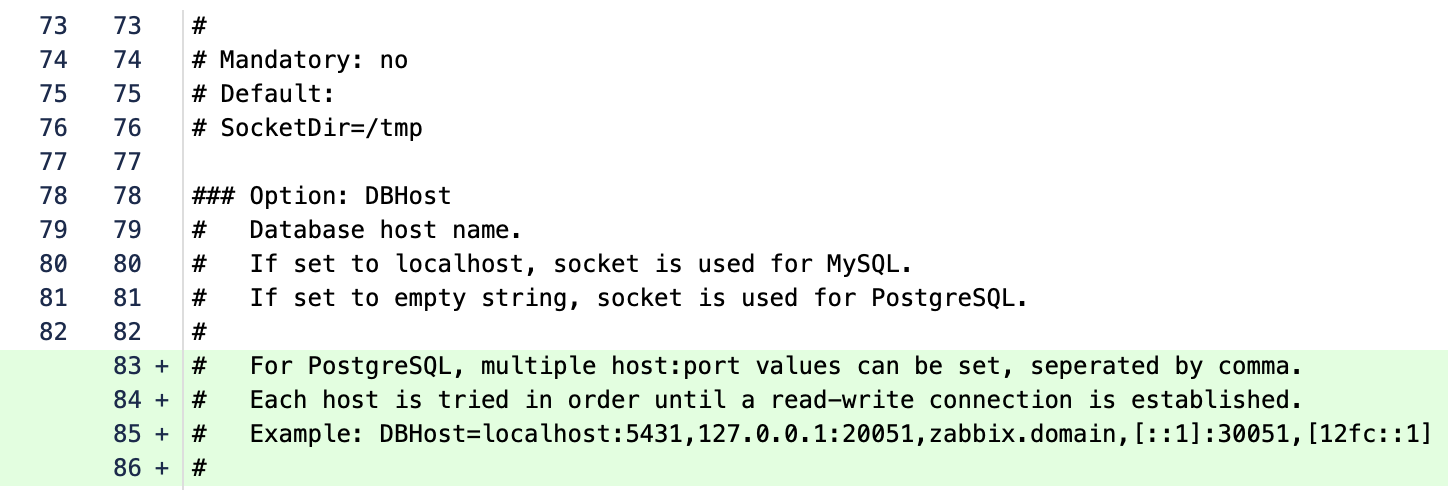
Multi-host connection string for PostgreSQL backend
For us, this is one of the best practical improvements to the PostgreSQL backend so far. The ability to specify multiple host:port entries in DBHost (comma-separated) and let Zabbix automatically find the first available read-write node at startup significantly simplifies deployment and operations-especially in HA environments. In practice, this often means fewer dependencies on an external load balancer and a cleaner, more self-contained configuration directly within Zabbix.
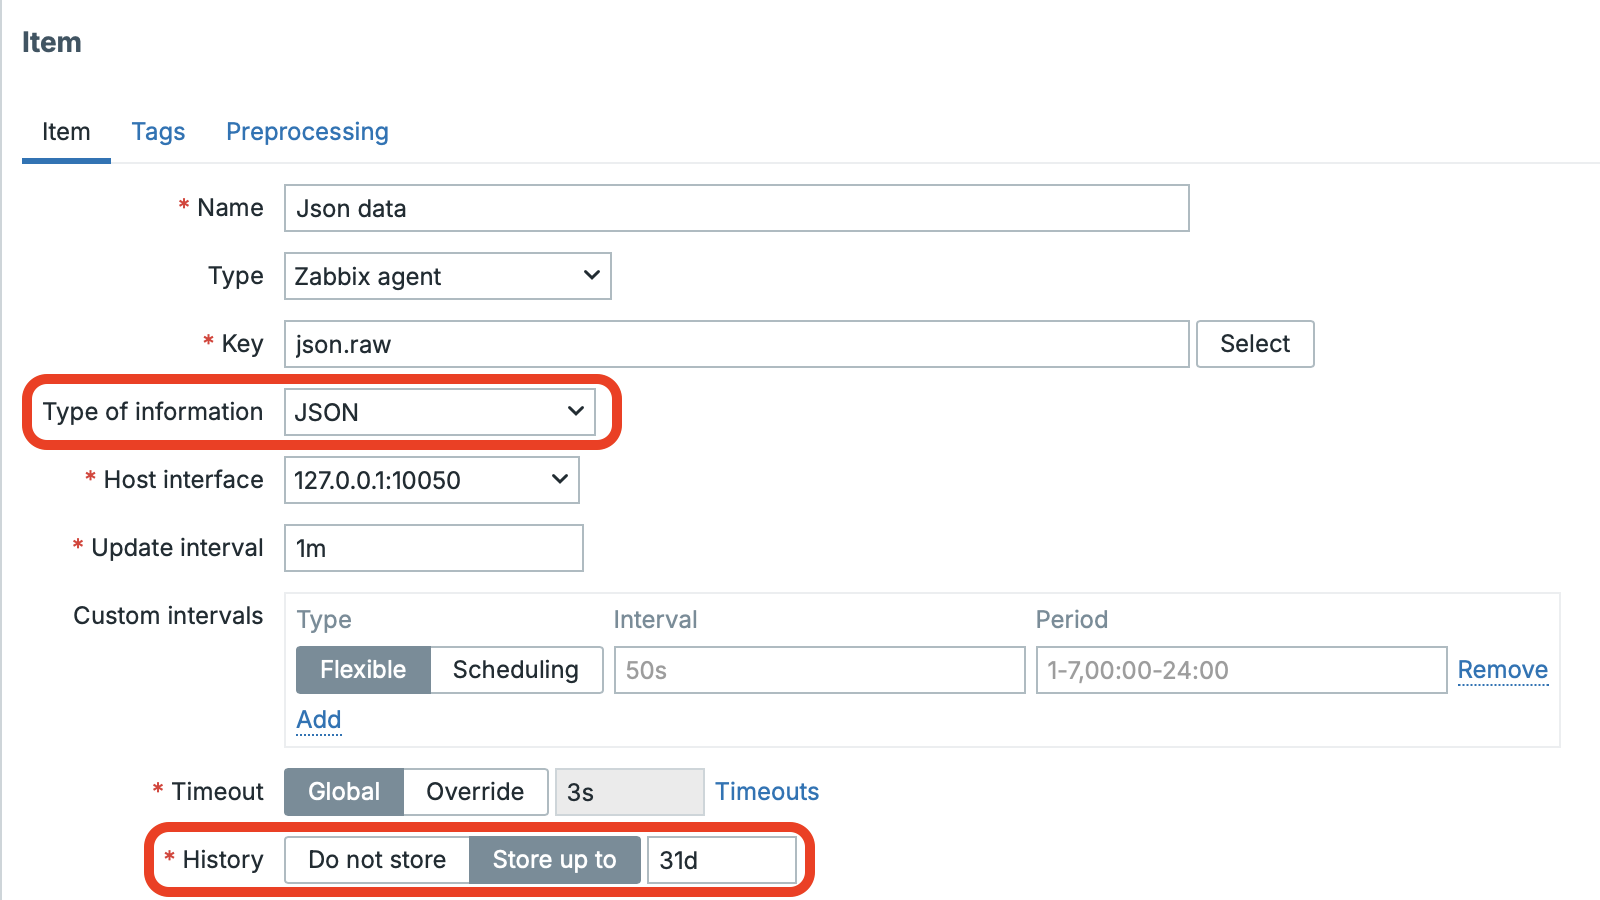
New option to store data in JSON format
We’ve finally got it: in Zabbix’s (almost) native JSON world, there is now an option to store such data directly in the database – in JSON format. The feature is available on both the proxy and the server side. Conceptually, it’s similar to the Binary storage type we already know (used, for example, for storing screenshots). Partitioning support for the new table is included as well, and the change is also reflected in the Elastic implementation.
One more important advantage: unlike Binary storage, this type can be used not only for master items, but also for dependent items.
We see the primary use case in scenarios with a large number of master items. The maximum size of stored data per single write is 128 MiB.
Just like with the Binary type (available since Zabbix 7.0), it is not possible to create triggers for this data type – and that’s not the purpose of storing data this way. The reason is that such triggers could put an extreme load on the server’s value cache. So this is primarily a practical capacity/performance limitation (to ensure the data fits into the memory used by the value cache), rather than something that would be impossible to implement technically.
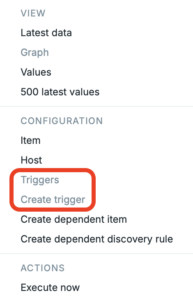
Dashboard export and import
Dashboard export and import are finally available. You could achieve something similar via the API before, but you had to map individual entities precisely by their IDs – otherwise the import would fail.
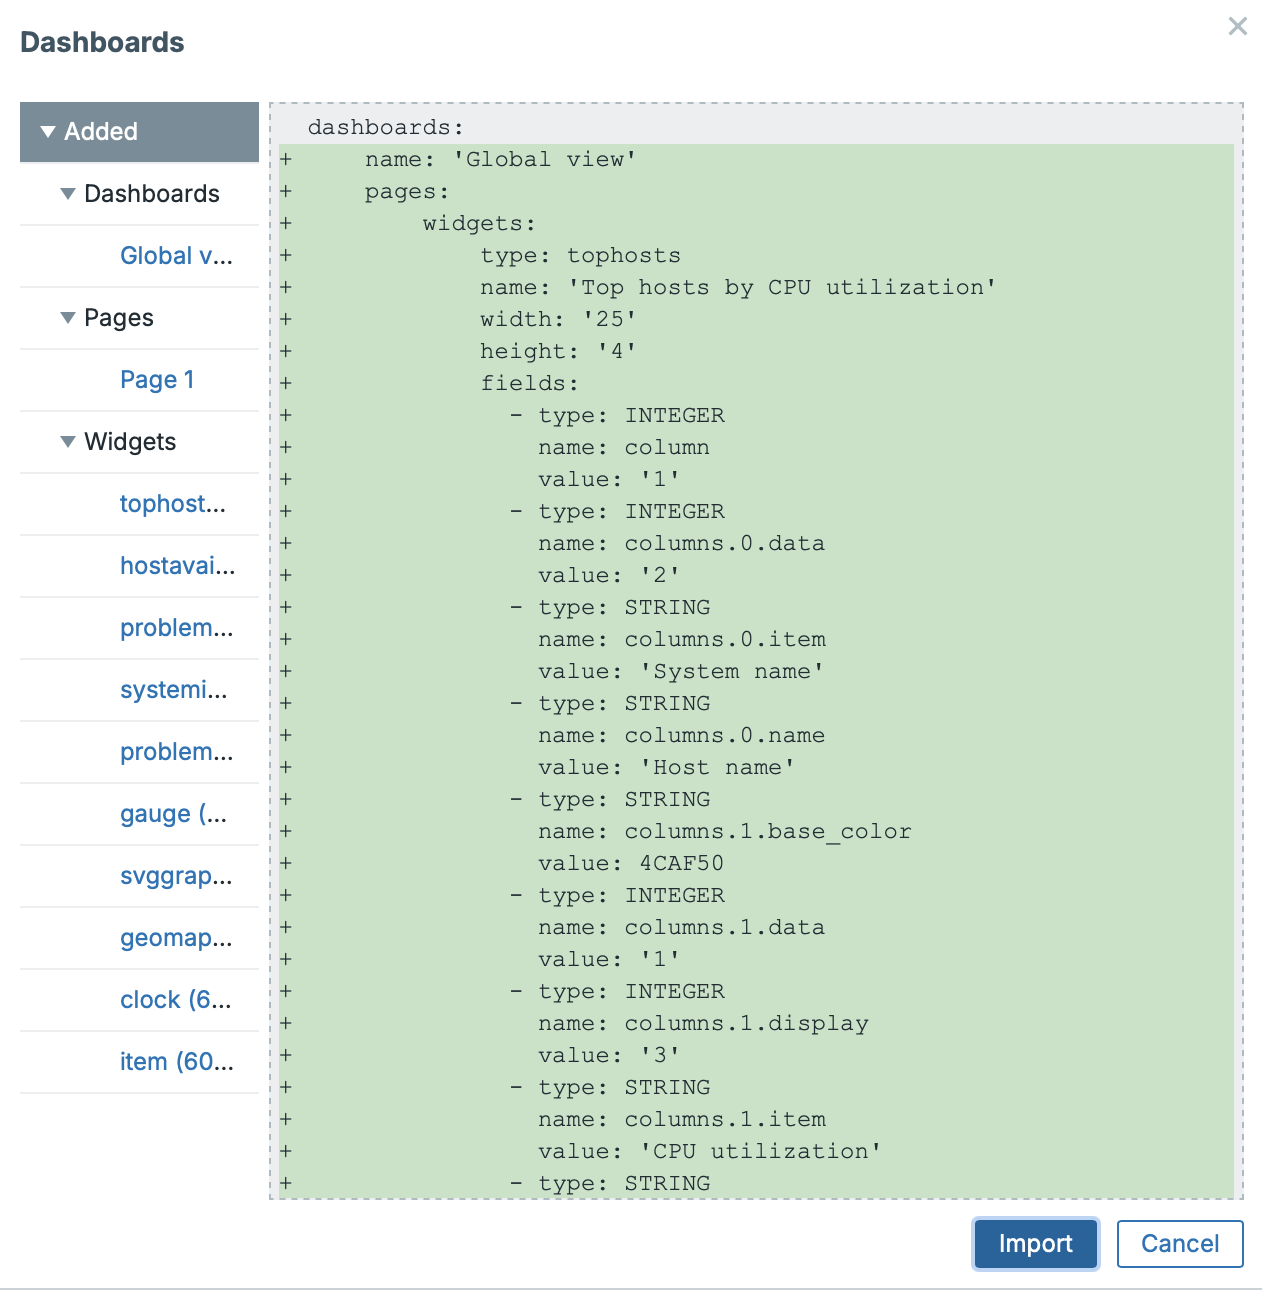
Now the UI provides two buttons: one for Export (in the familiar Zabbix export format) and one for Import.
You’ll find the Import button in the top-right corner of the dashboards overview, right next to Create dashboard.
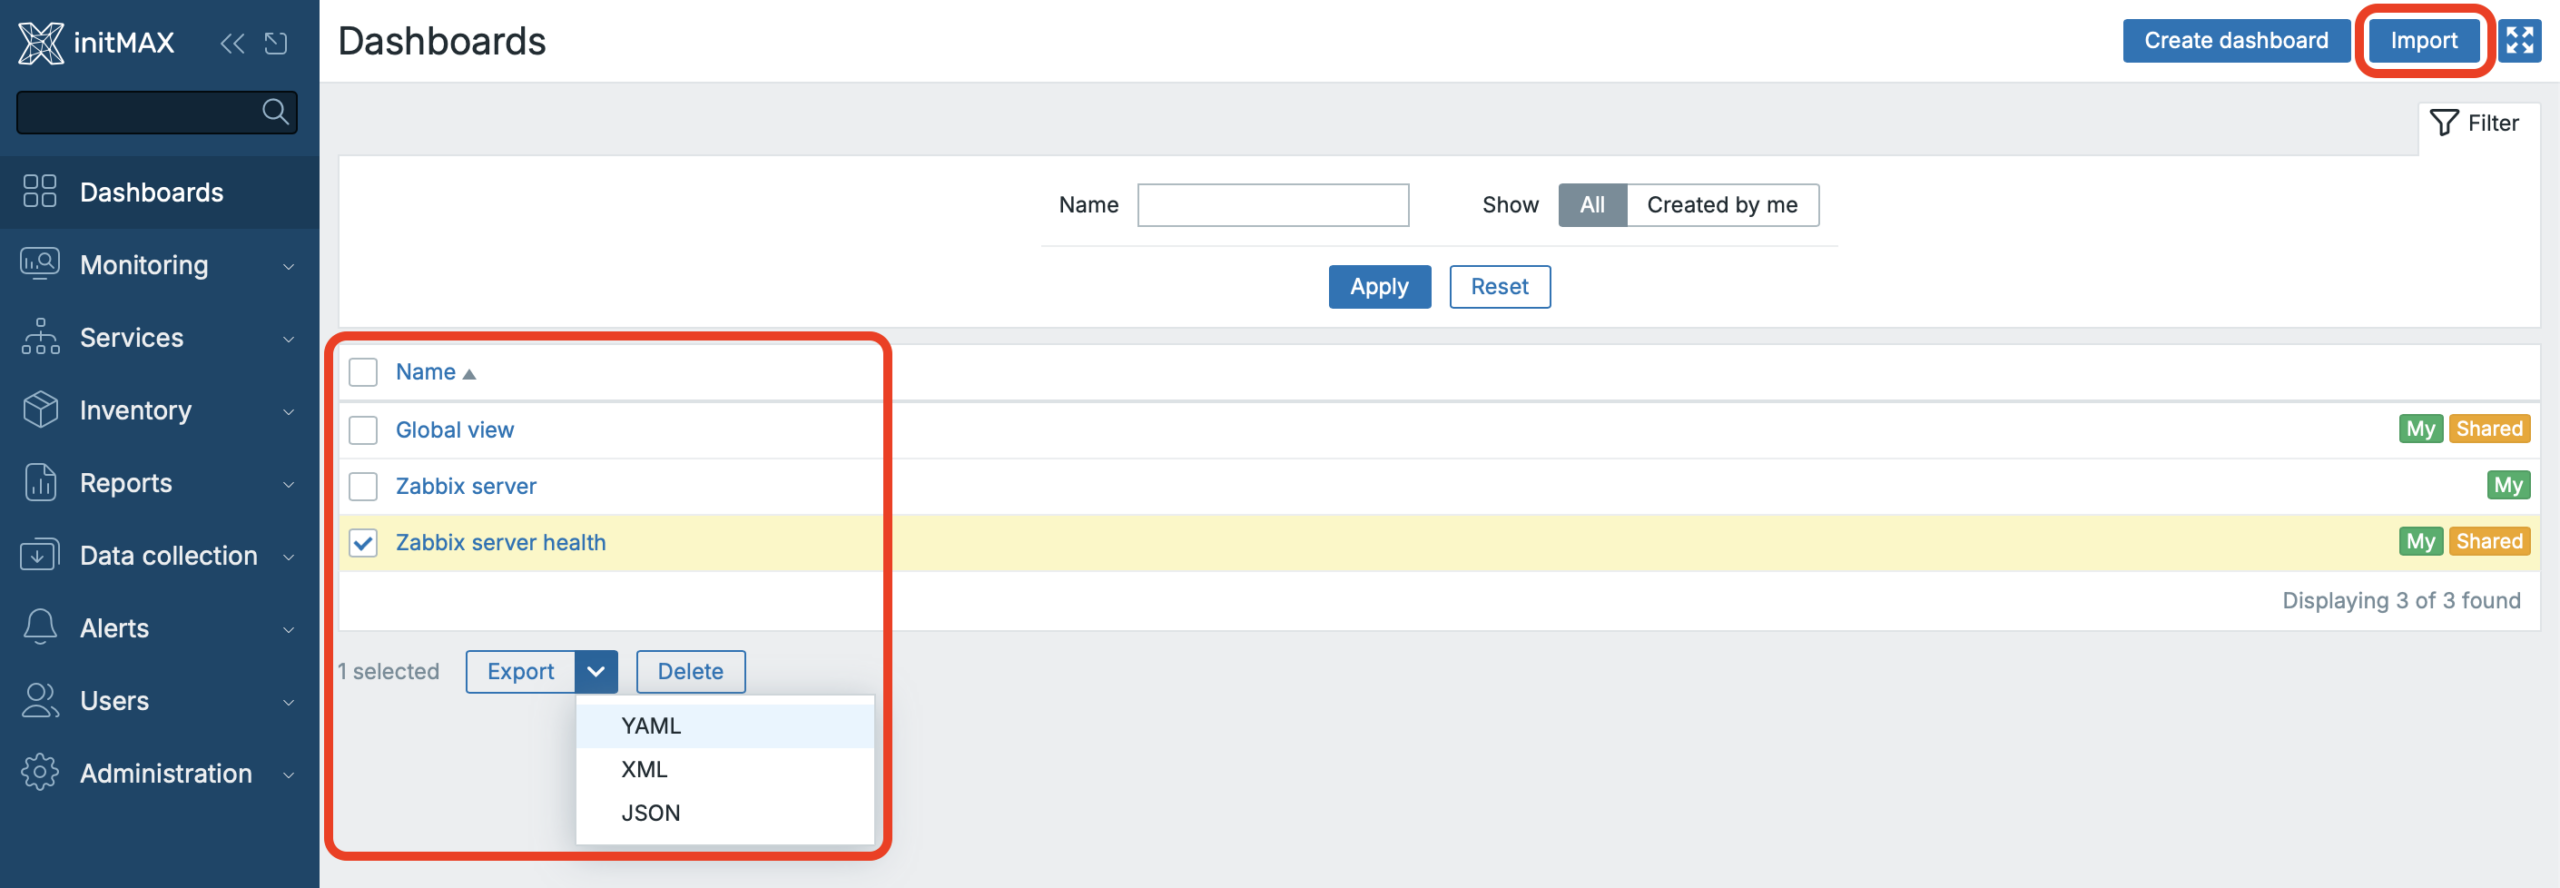
The import process itself is straightforward: you can create entirely new dashboards, and if they already exist, you can update the existing ones. The import also supports pages, if you use them within your dashboards.
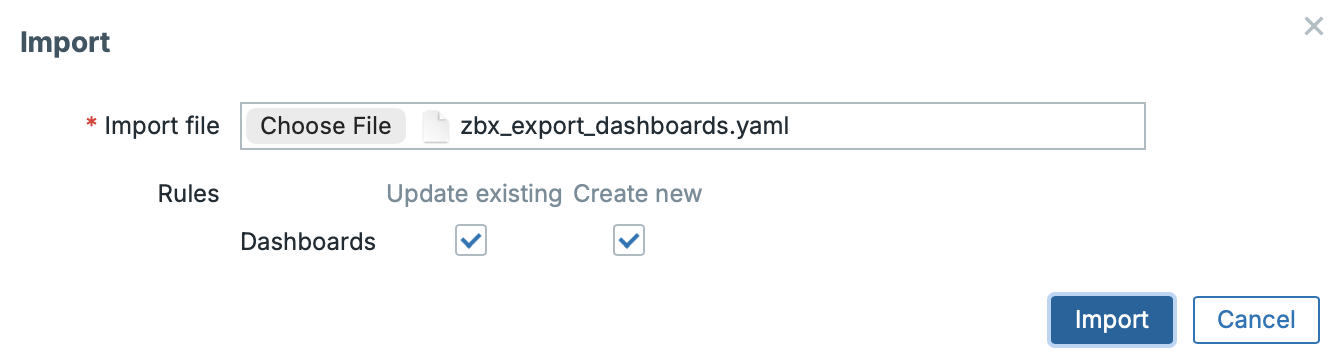
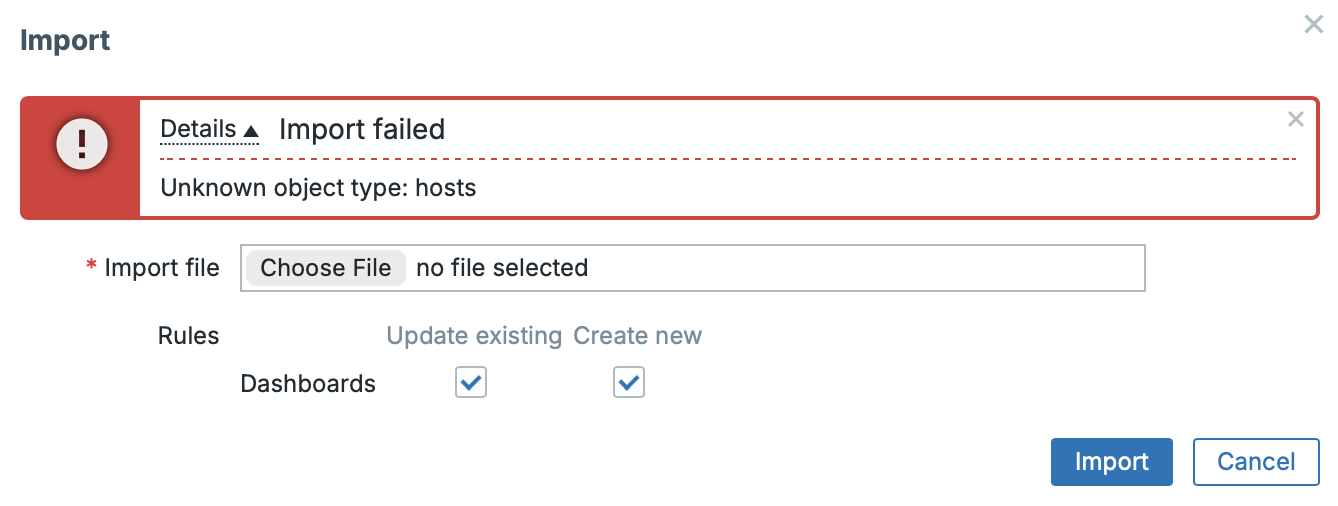
During import, individual objects are not matched by ID, but by name. In our example, the host was renamed from “Zabbix server” to “Zabbix server RENAMED”, and the system was then unable to find it. The fix is straightforward: you can adjust the mapping directly in the UI during import, or by editing the exported file.
Before the actual import, you’ll also see a summary of what will be added, removed, and updated – including the specific changes.
GeoMap Clustering
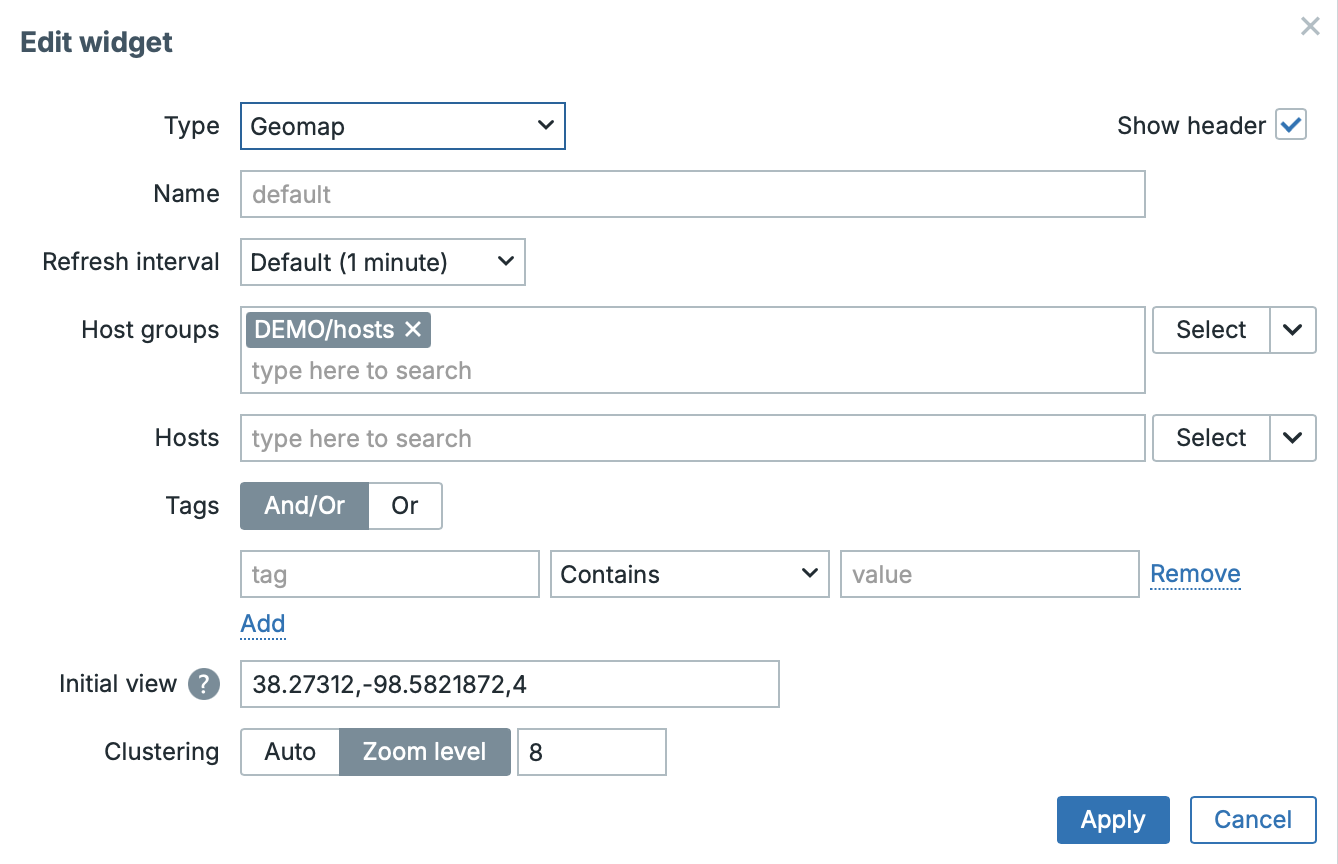
In the GeoMap widget, you can now configure different host clustering behavior for your maps. You can choose between Auto (the previous/default behavior) and a new Zoom level option. With Zoom level, clustering changes at a defined zoom threshold – for example, if the threshold is set to 8, only a few host markers split into individual elements when you zoom in; if you lower it to 5, many more markers remain clustered, so the map stays grouped and cleaner until you zoom further in.
Example video of GeoMap clustering
Visual Inherited Tag Indicator
Zabbix now makes inherited tags a first-class part of the UI, so you can immediately tell whether a tag comes from a template/parent object or if it was created directly on the current level. This is especially handy in large environments where many objects share the same names and you rely on tags for routing, filtering, and consistent classification across hosts, templates, items, and triggers.
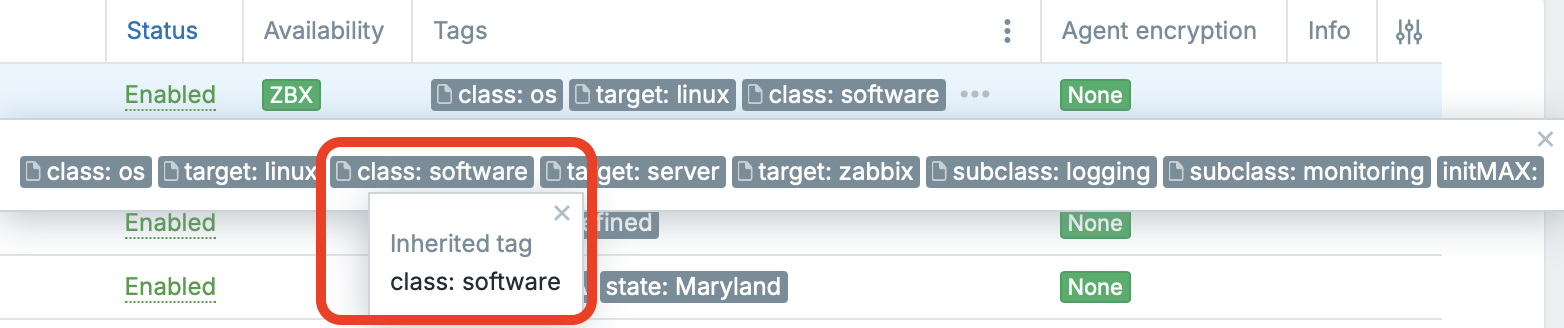
In the list views, inherited tags are marked with a small page/document icon on the left side of the tag pill, and when you hover over it you’ll see a tooltip like “Inherited tag” (as highlighted in the screenshot). Tags without this icon are not inherited – they were added directly at that level. In the example below, most tags are inherited, while initMAX is a non-inherited tag created locally, making the difference instantly visible.
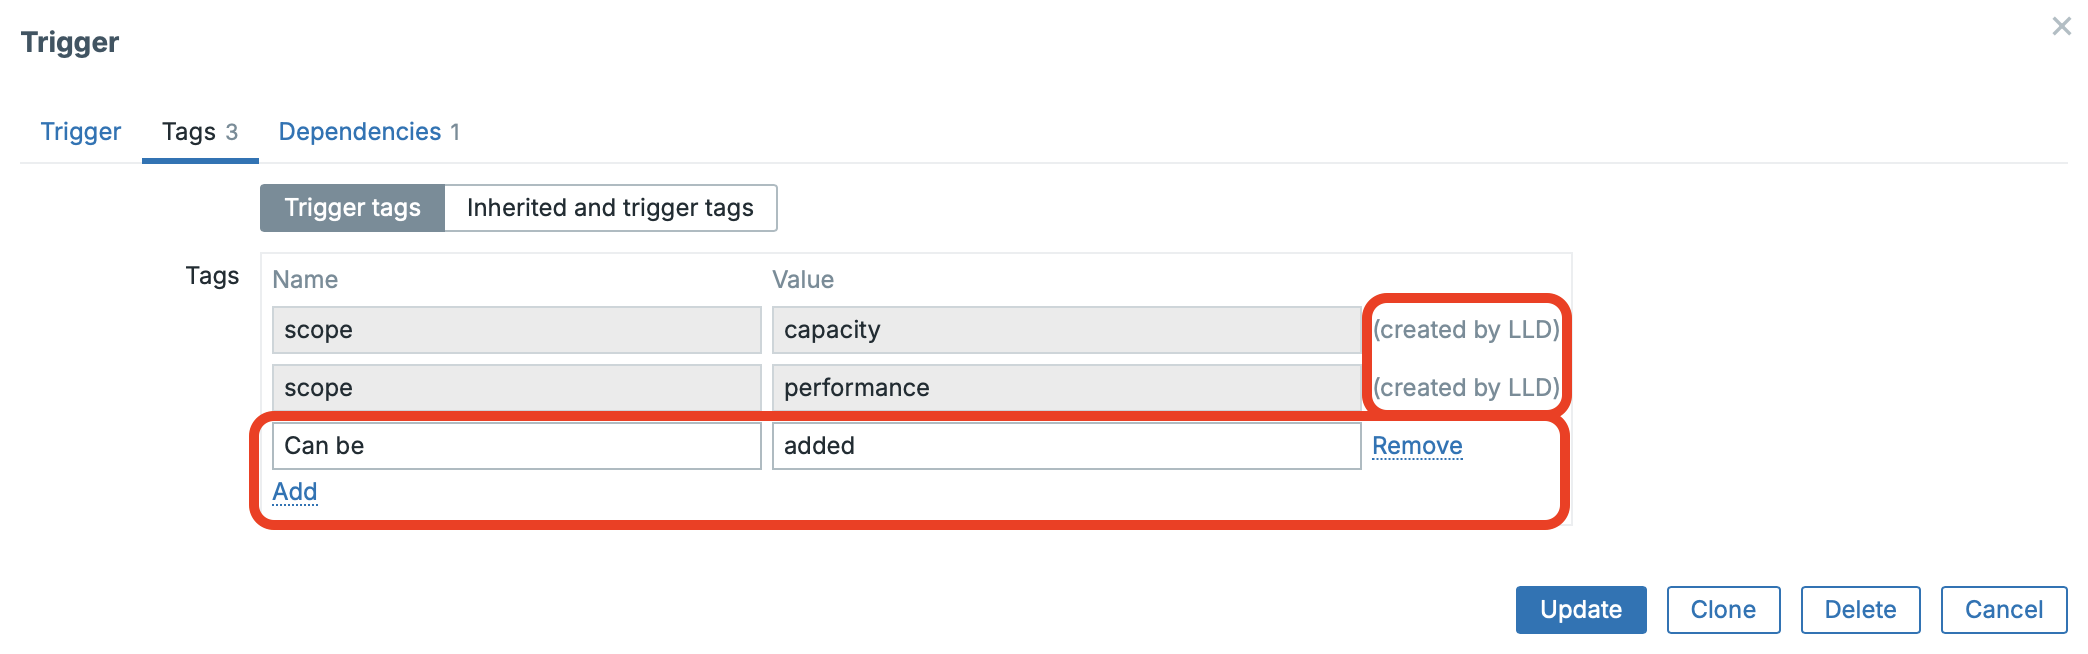
Add custom tags to triggers created from trigger prototypes
This feature allows you to assign custom tags to triggers that are created from trigger prototypes.
It is especially useful for controlling notifications (send / do not send alerts based on tags) and for labeling triggers by specific services, teams, or use cases, enabling more precise alert routing, filtering, and service-level correlation.
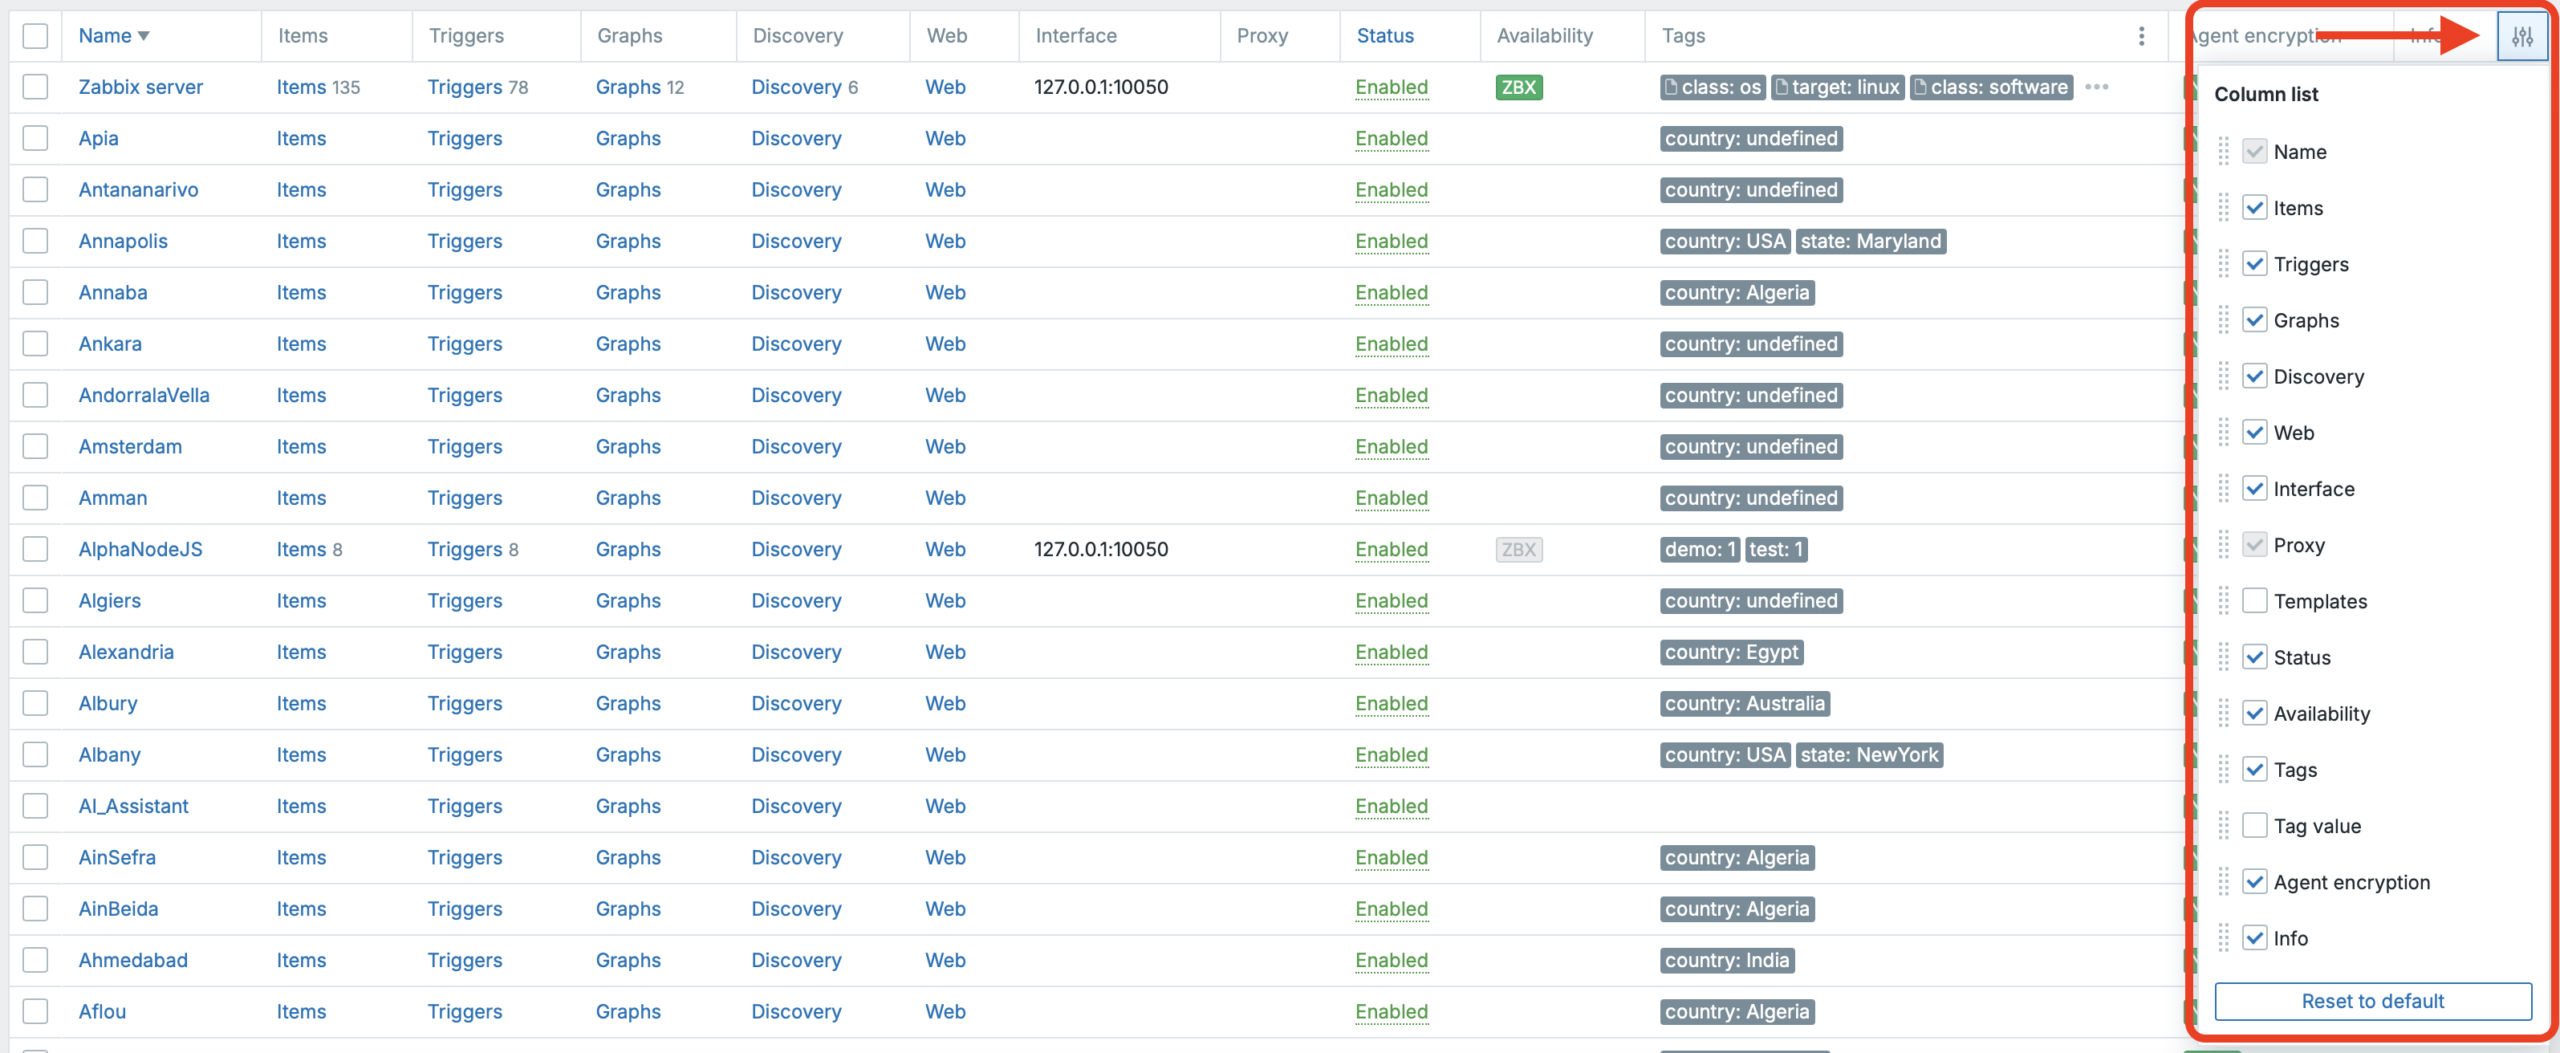
Customizable table views on selected pages
This feature lets you customize list tables on supported pages via the column settings in the top-right corner. You can show or hide entire columns and resize their widths; renaming is currently available only for duplicated tag columns (as shown in the screenshot).
Where it’s available:
- Monitoring → Hosts
- Monitoring → Latest data
- Monitoring → Problems
- Data collection → Hosts
- Data collection → Templates
All changes are stored in your user profile, so the layout is personal and not shared with other users. We also plan to update our User Filter Manager (https://www.initmax.com/product/user-filter-manager/) to support this functionality as well.
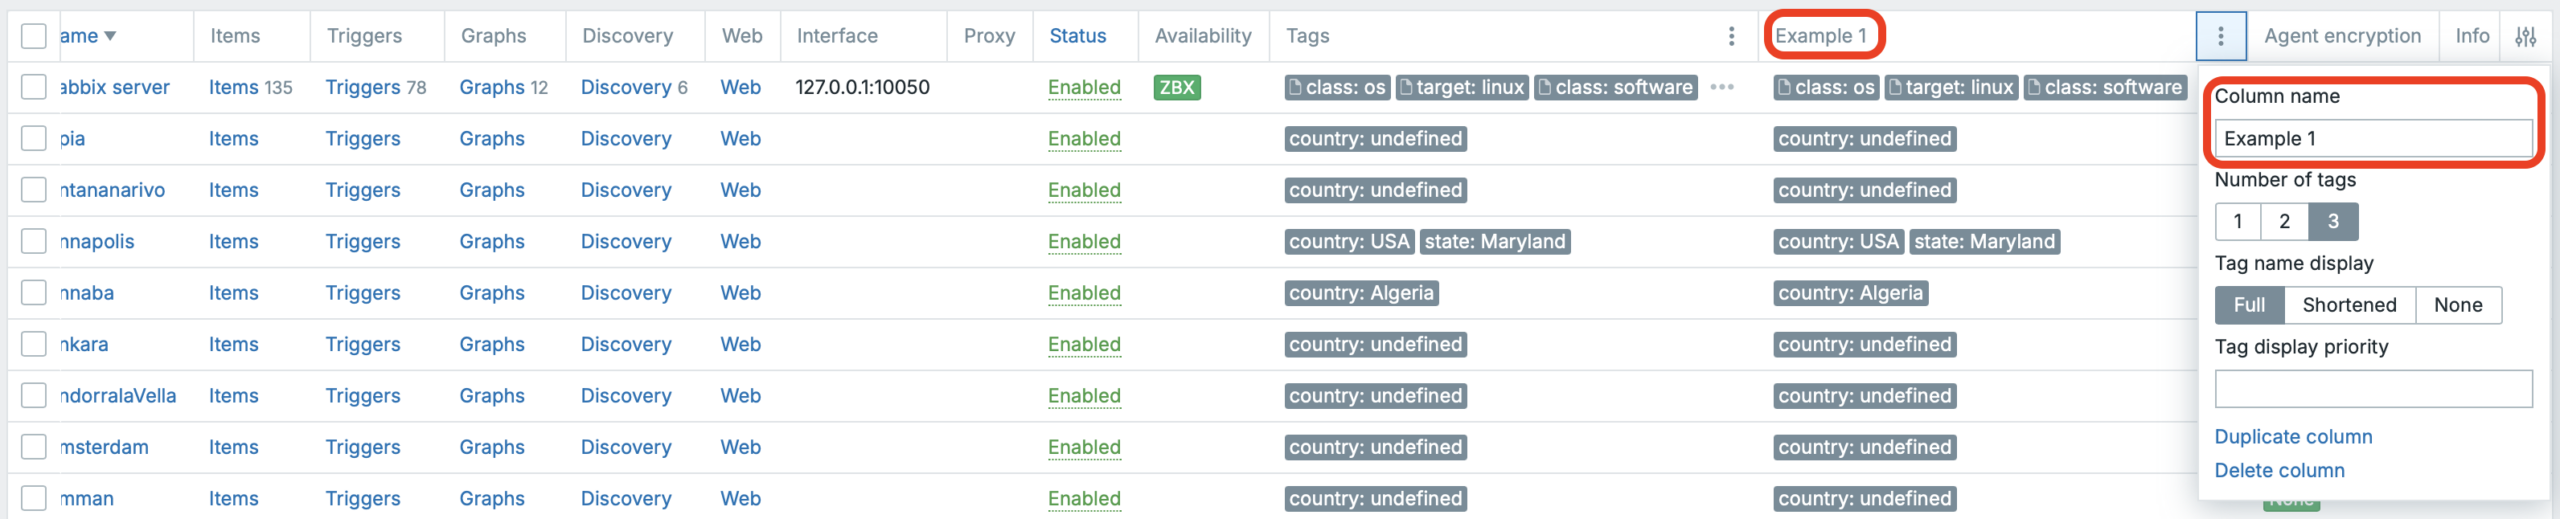
In the second screenshot, you can see an example of a duplicated “Tags” column, where we can apply filtering and also rename that duplicated tag column. This is a really cool feature and makes it much easier to keep tag-heavy views clean and focused.
Here’s a short video showing how you can resize columns and hide them in the Triggers view.
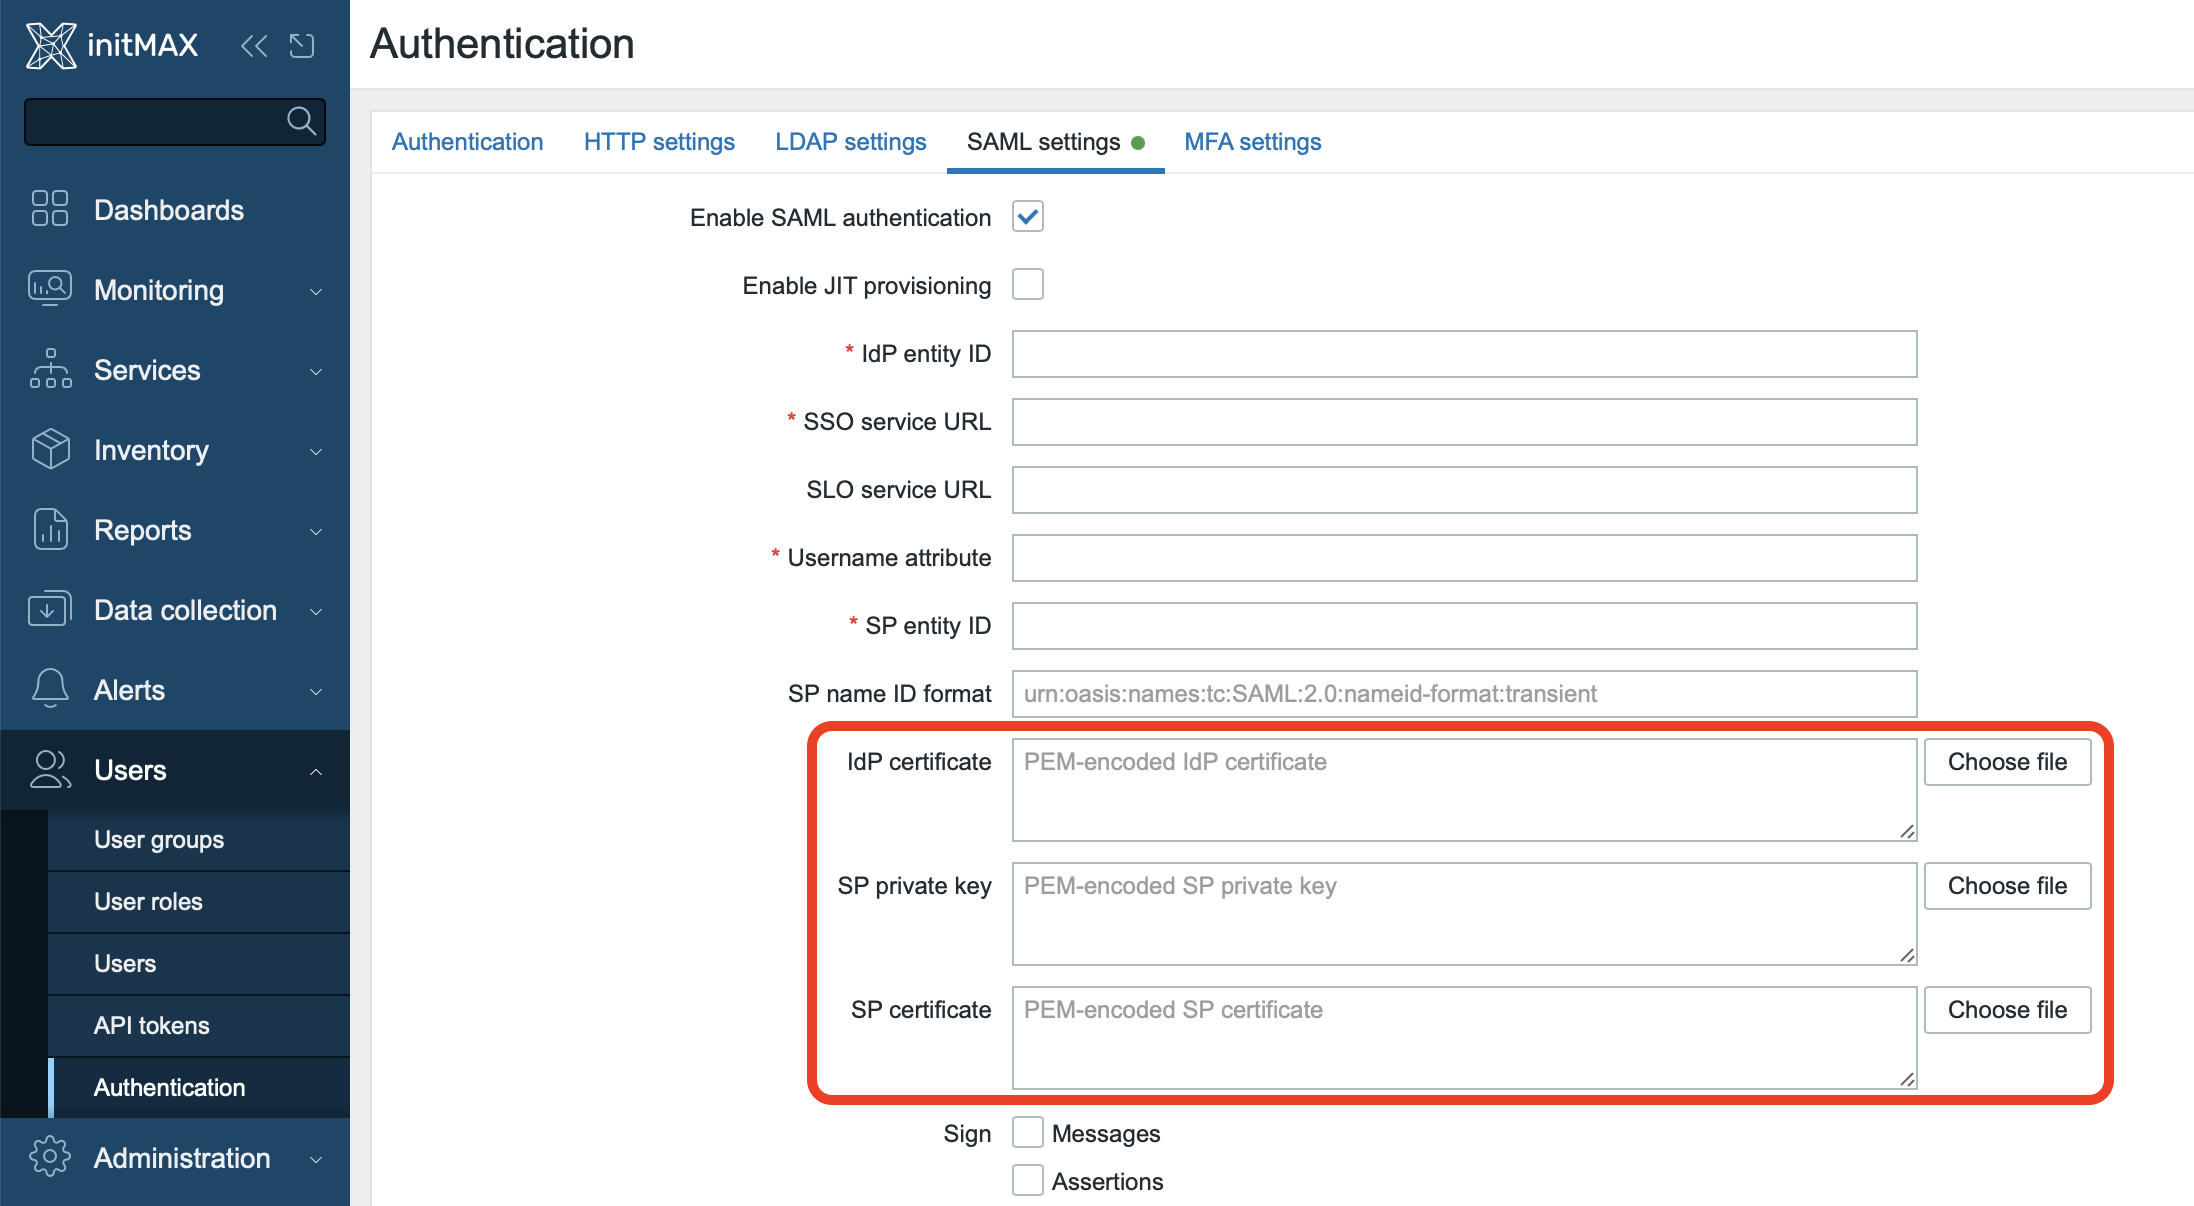
Storing SAML certificates directly in the database
You can now configure Zabbix to store SAML certificates directly in the database. Simply set the following option in the frontend configuration file (typically /etc/zabbix/web/zabbix.conf.php):
$SSO['CERT_STORAGE'] = 'database';This eliminates the need to upload certificates directly to the server’s file system. This solution brings several benefits, especially:
- Easy configuration directly via the web interface.
- Unified certificate management in High Availability (HA) deployments.
- Simplified administration of the entire SAML configuration.
Overview of minor improvements
Audit log export to CSV
The audit log is getting CSV export. It is a smaller change, but a very useful one in practice. In larger installations, audit records are often handed over outside Zabbix, archived, compared, or used during change reviews. Direct export reduces the need for manual copying or additional scripts.
Safer default settings for trapper items
Zabbix adds a default value for Allowed hosts in trapper items and introduces the global macro {$TRAPPER.ALLOWED_HOSTS}. This helps especially with templates, imports, and bulk management, where it is better to have a unified and easily adjustable default mode instead of manually filling the same setting in many places.
New and updated templates
New Templates:
- OpenAI Platform by HTTP
- GitHub organization by HTTP
- Ribbon SBC Edge by HTTP
- Ribbon SBC SWe core by HTTP
- Ribbon SBC SWe CE by HTTP
- VeloCloud SD-WAN Edge by HTTP
Updated Templates:
- Proxmox VE by HTTP (nested LLD; SMART status mapping)
- GitHub repository by HTTP
- Microsoft 365 reports by HTTP (Copilot monitoring)
- Ciena 3906 by SNMP (filesystem + CPU load items)
- MySQL templates (new syntax support)
- RabbitMQ templates (healthcheck response code regex)
- Nextcloud by HTTP (item logic)
- NetApp AFF A700 by HTTP (macro names)
- MSSQL templates (additional GRANTs)
- Stormshield SNS by SNMP (protected host memory OID)
- Zabbix server/proxy health templates (ODBC poller error handling)
Zabbix downloads and other useful links
- Zabbix 8.0 is available for download here: www.zabbix.com/download
- Full documentation for the new version can be found here: https://www.zabbix.com/documentation/devel/en/manual
As official partners and strong enthusiasts of the Zabbix platform, we offer comprehensive, top-level services in all areas of Zabbix monitoring. If you’re interested in a live demonstration of Zabbix installations at our customers’ sites, we’d be happy to show you Zabbix in action.


Give us a Like, share us, or follow us 😍
So you don’t miss anything: