Zabbix version 7.4 is here!
The new Zabbix 7.4 version has introduced a number of exciting new features.
| Contact us for a free consultation | CONTACT US FOR A FREE CONSULTATION AND DEMO |
|
We are preparing thematic webinars for you |
|
| Training for the latest LTS version (Zabbix 7.0) | MORE INFORMATION ABOUT THE TRAINING |
| You can also explore our DEMO Zabbix. Log in using the “sign in as guest” button. | SIGN IN TO DEMO ZABBIX |
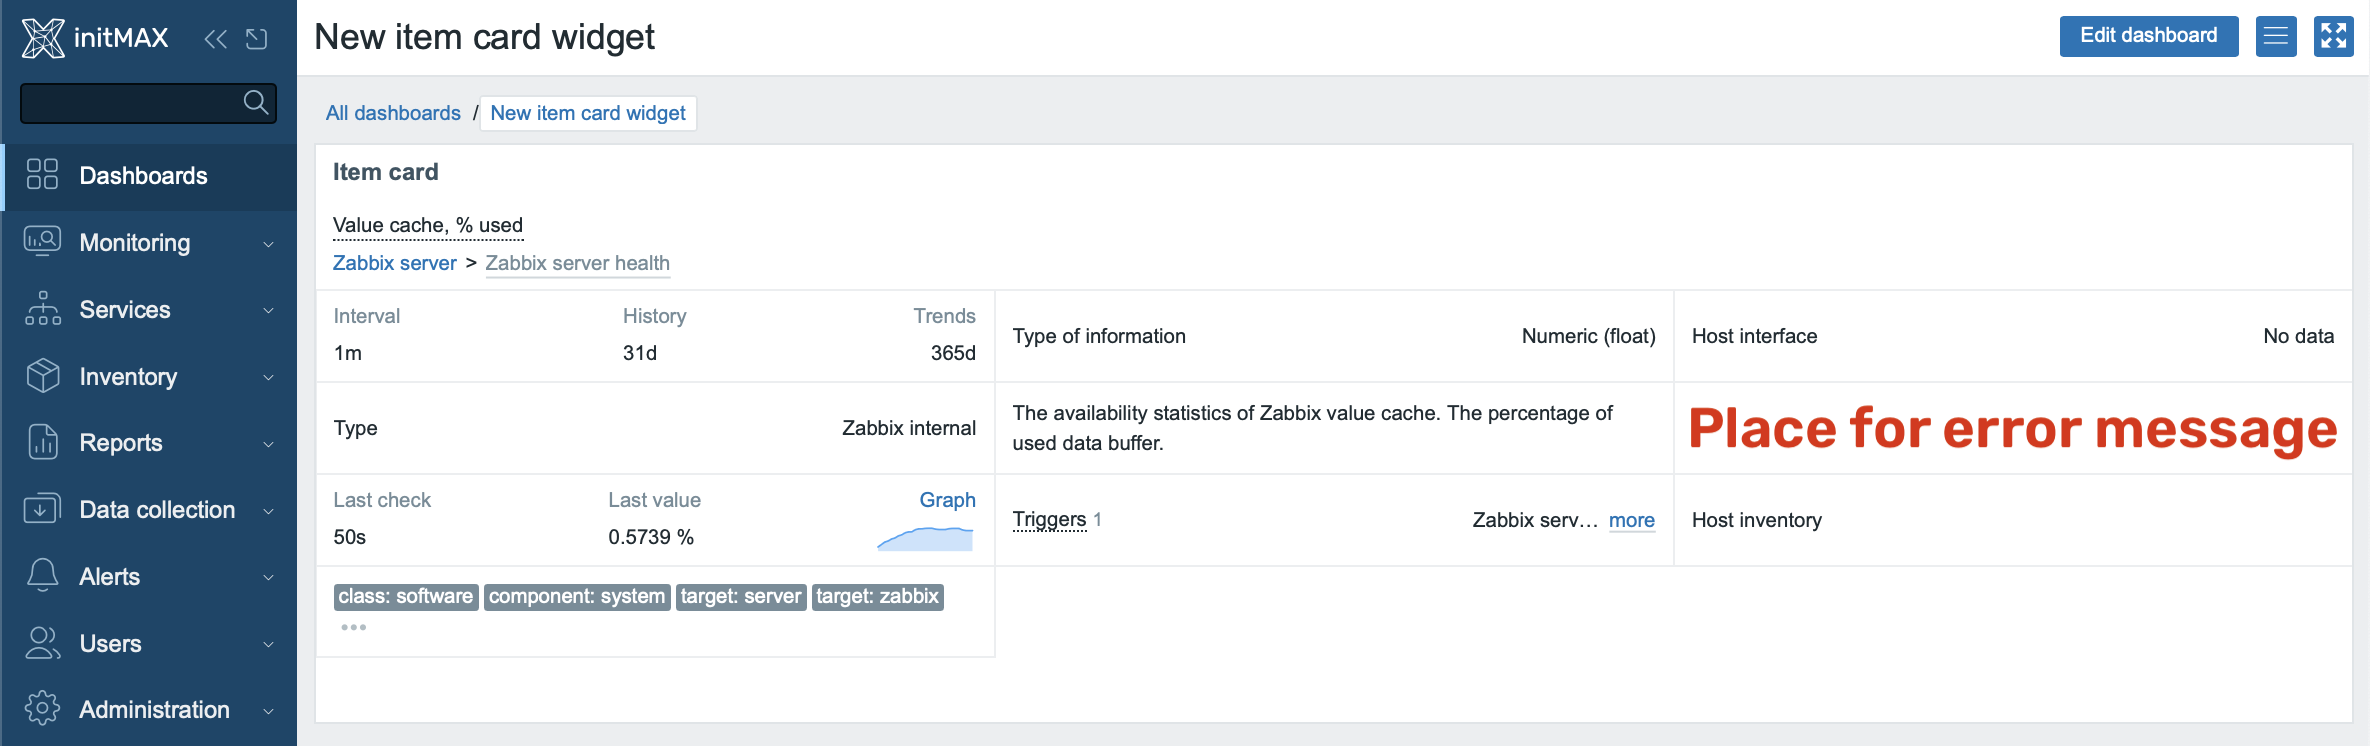
Widget Item card
This widget is ideal for a quick and detailed overview of selected critical items on dashboards. It’s especially useful for technical and administrative dashboards, where you need to closely monitor the status of key Zabbix metrics.
The widget allows displaying various parameters of a selected item (e.g., “Value cache, % used”). It provides the following information:
Widget configuration section
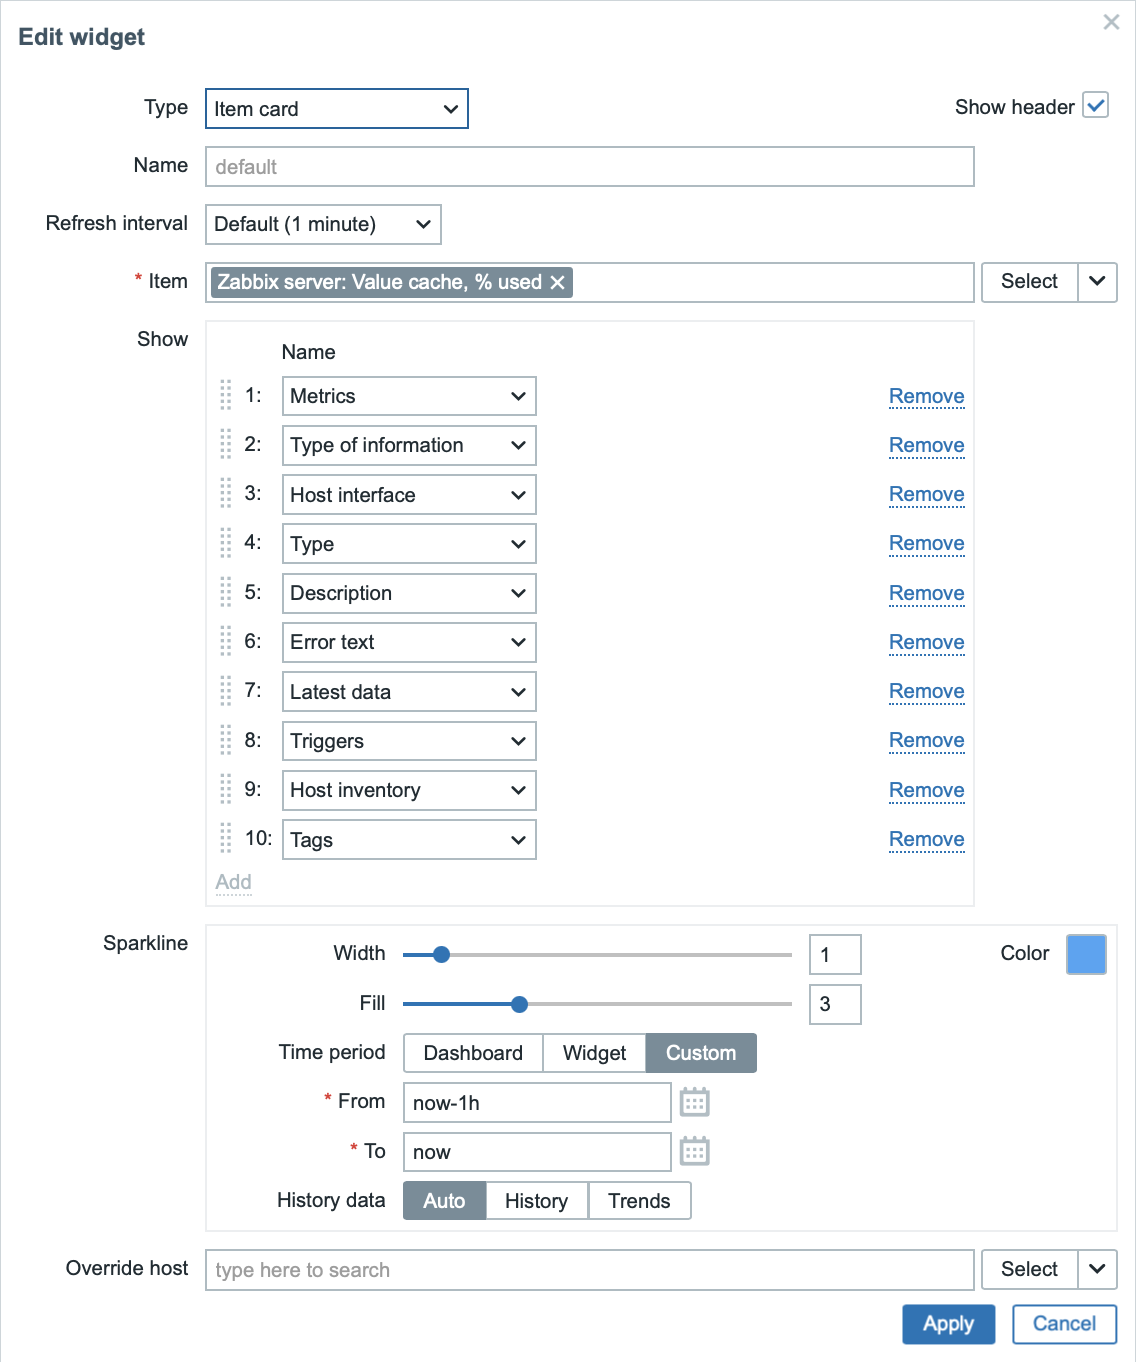
Here, the user defines the order and selection of information to be displayed in the widget:
- Metrics (basic metrics)
- Type of information (information type)
- Host interface (host interface details)
- Type (item type)
- Description (item description)
- Error text (error messages – as mentioned in the first image)
- Latest data (most recent data, last check, last value)
- Triggers (trigger statuses)
- Host inventory (host inventory details)
- Tags (item tags)
Sparkline (mini graph):
- Width, padding, and color settings of the value mini-graph (sparkline).
- Time interval selection from which the sparkline displays data (e.g., the last hour).
History data:
- Option to select whether to use automatically determined data or specify historical data or trends.
Override host:
Option to override the host for which the widget displays data (useful for dynamic dashboards).
New Zabbix Host Wizard – quick and easy host addition
The new Host Wizard is an interactive guide in Zabbix designed to simplify and speed up the process of adding new hosts, particularly for beginners and cloud administrators. Advanced configuration options remain fully accessible.
The wizard works in the following steps:
- Selecting any compatible template
You can choose any compatible available template for monitoring according to your requirements. Templates are categorized, such as DB, OS, Cloud, Application, Device, Firewall, and more. Each template clearly indicates the connection type it’s intended for (e.g., Zabbix Agent 2, etc.). - Automatic Interface Proposal
After selecting a template, the wizard automatically identifies and proposes the correct interface type required by the template, such as SNMP. You then need to fill in all mandatory parameters. This removes the need to manually select the appropriate interface type, helping eliminate configuration errors. - Assistance with Agent Installation and Configuration
If the chosen template requires installing the Zabbix agent, the wizard provides a clear and understandable guide for its installation and basic configuration, categorized by operating system (Linux, Windows, and more). - Summary and Saving Configuration
At the end, the wizard displays a concise summary of the entire configuration, allowing any final adjustments. By confirming, the configuration is saved, and the host is automatically added or updated in Zabbix.
Benefits of the Host Wizard:
- Easy to use, especially for beginners.
- Reduces configuration errors.
- Fast and clear setup of new hosts.
- Availability of all advanced configuration options for experienced users.
Dynamic real-time widget configuration updates
This new feature enables instant preview of changes made to widget configurations without the need to continuously save.
As soon as you make adjustments to the widget settings (such as changing the order of displayed information, enabling/disabling features, modifying time intervals, or adjusting appearance), the widget on the dashboard updates immediately in the background.
This dramatically improves your overview of how the final changes will appear and significantly speeds up the configuration process.
Additionally, the entire widget configuration window can now be easily moved around the screen by simply clicking and dragging.
Multi-Level Low-Level Discovery
Zabbix 7.4 introduces the long-awaited ability to perform nested low-level discovery (LLD) directly at the host level – not just a single discovery rule, but an entire cascade of dependent “discovery” steps that you can chain together. This lets you:
- First discovery (for example via TRAP or the HTTP agent) return a raw JSON array of MAC addresses (
$.macs) and expose only a single macro{#MAC}for each one. - Second (nested) discovery, using
parent_discovery_ruleto point back to the first rule, which for each MAC address issues another query (e.g., SNMP Get, HTTP call, SQL) and pulls out details (vendor, type, status, etc.) from the JSON via JSONPATH (for example$.deviceInfo), exposing additional macros such as{#TYPE},{#VENDOR}, and so on. - Optionally third (and further) levels, where you need even finer-grained breakdowns (for example ports, sensors, tables), by adding further nested discovery rules whose parent is the previous level.
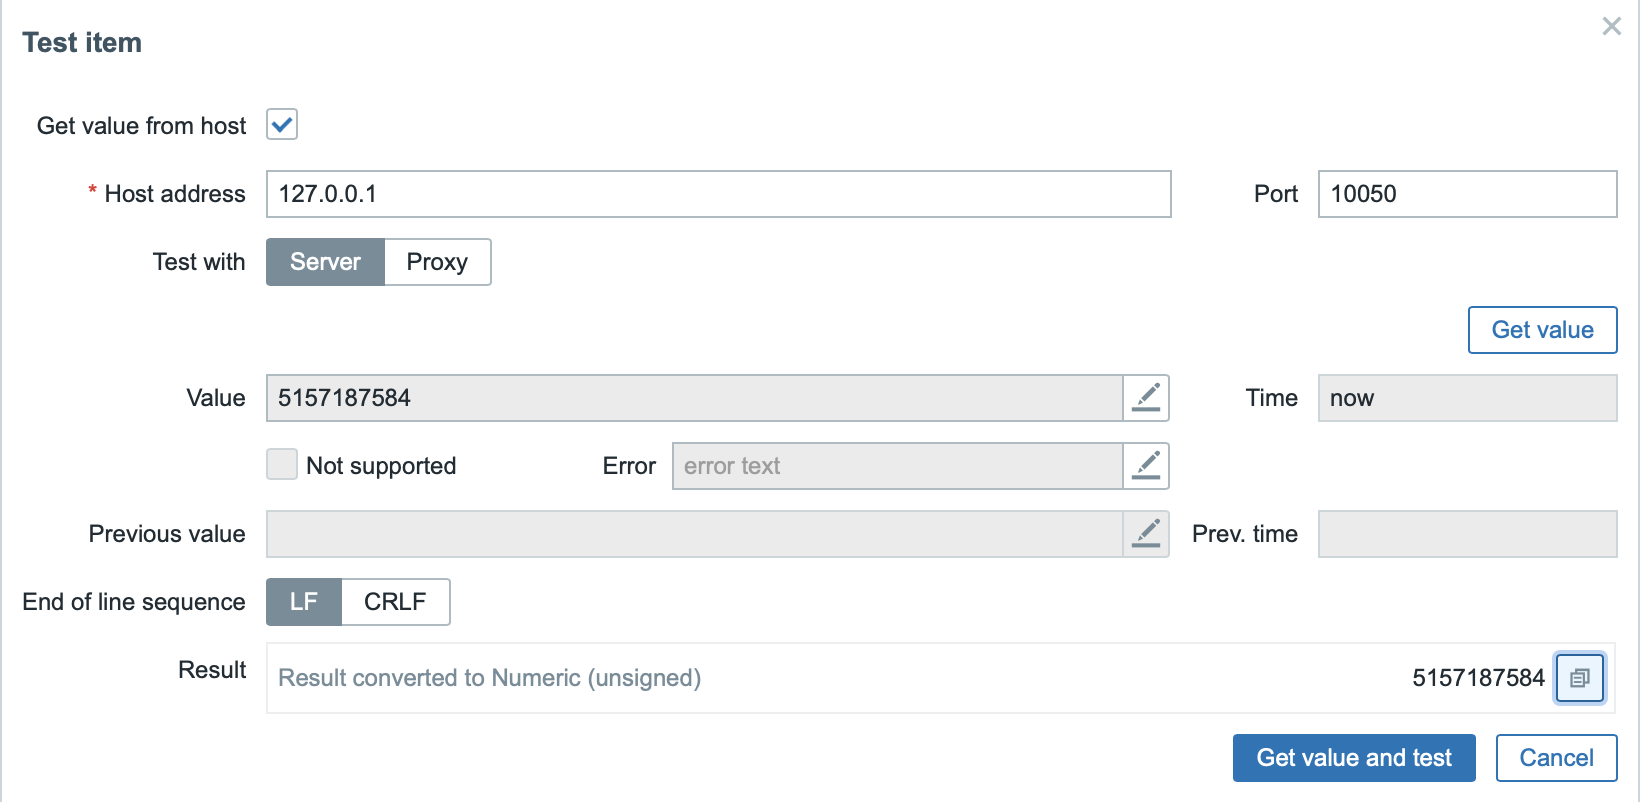
Easier copying of item test results
Now you can easily copy the results of item testing and preprocessing steps using the new “Copy to clipboard” button. There’s no longer a need to manually highlight and copy the value—just click once and effortlessly paste it wherever you need.
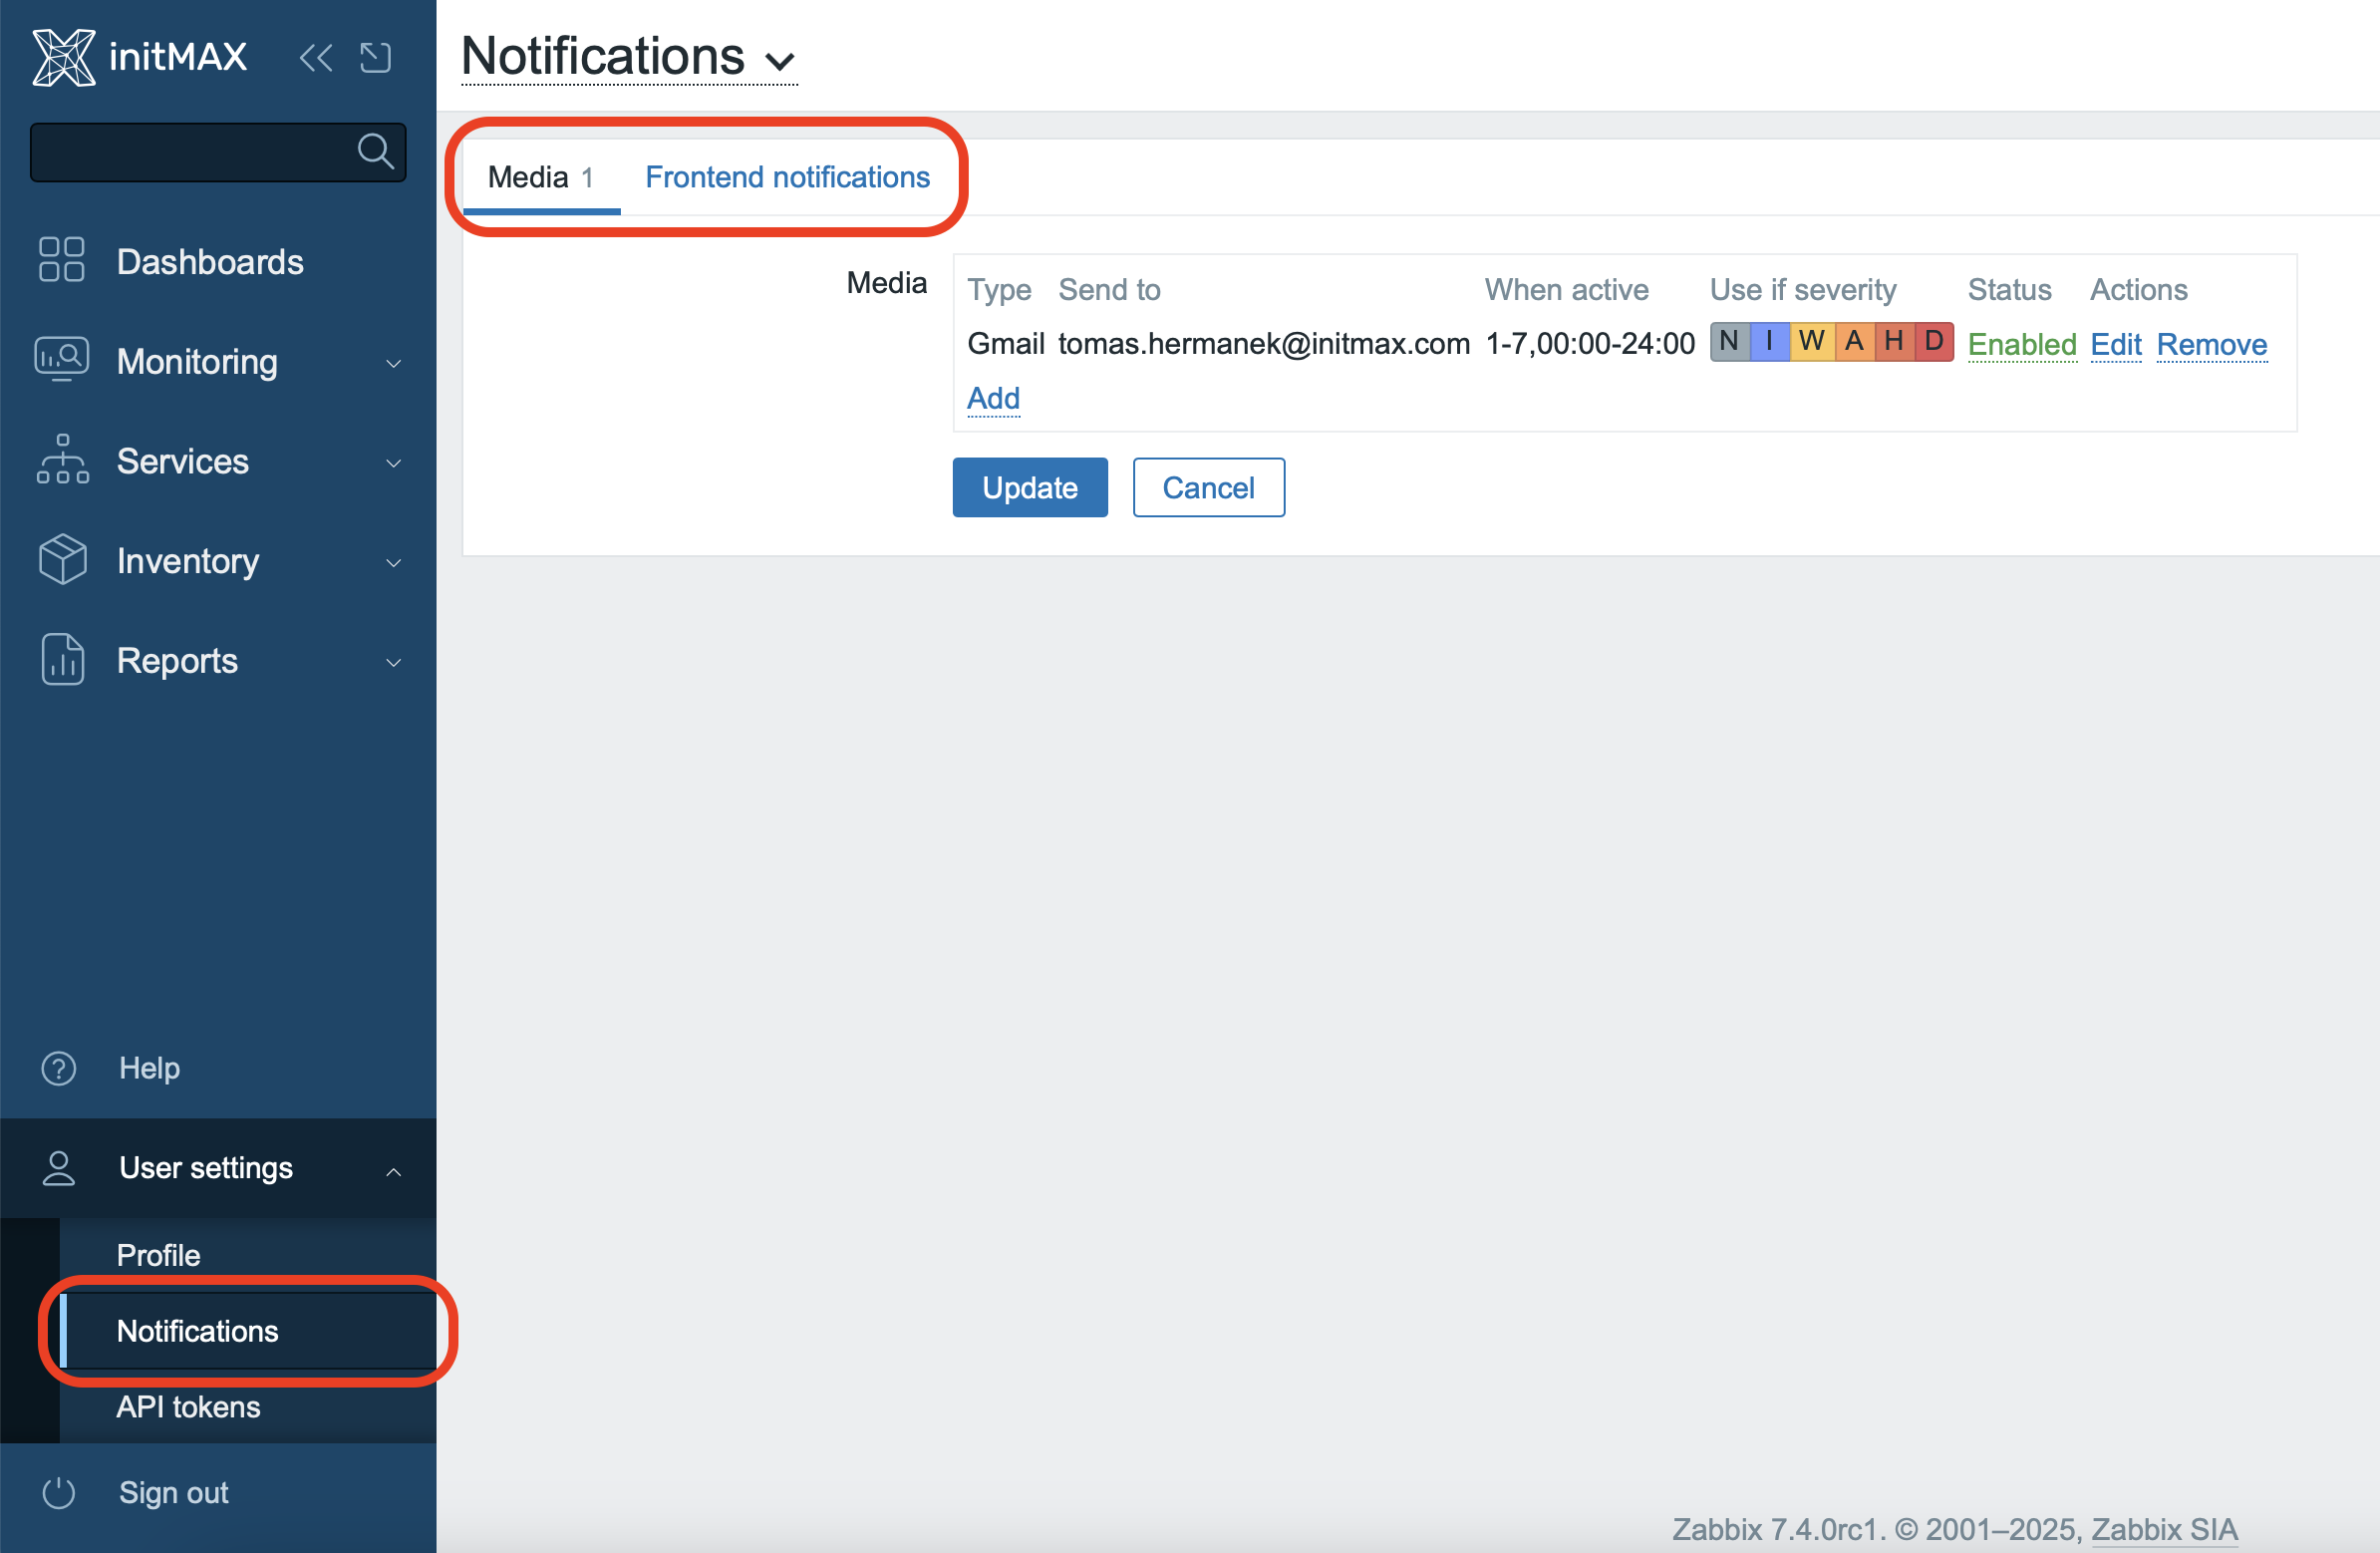
New Notifications section in the user profile
Management of notification media and frontend messages has been moved from the user profile into a new, clearer Notifications section. With this change, even users with Zabbix User permissions can now easily configure and manage their own notification media.
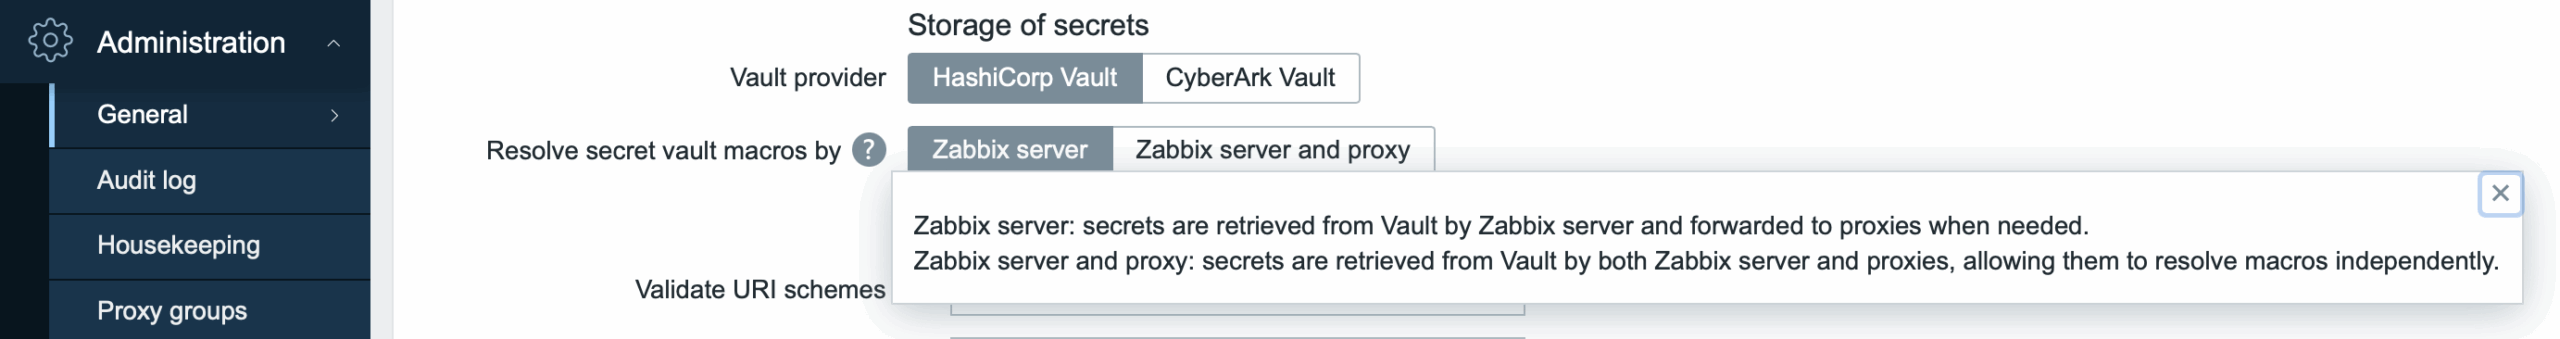
Independent resolution of Vault macros via Zabbix server and proxy
It is now possible to configure Vault secret macros to be resolved independently by both the Zabbix server and individual Zabbix proxies. Simply set the “Resolve secret vault macros by” option to “Zabbix server and proxy”. This allows proxy servers to independently resolve macros without needing to communicate with the Zabbix server.
More detailed statistics for “History syncer“ transactions
More detailed statistics for “History syncer” transactions
History syncer processes now display detailed statistics about processed transactions directly in their names. This enables you to easily monitor how many values and triggers were processed and the duration of each operation.
The notation “A+B triggers” means:
- A: triggers processed based on new values.
- B: triggers processed based on timers.
In parentheses, you’ll find detailed timing of individual steps in the following order:
- Time spent writing item values to the database
- Time spent updating items (status, errors, host inventory, etc.)
- Time spent writing trends to the database
- Time spent calculating triggers
- Time spent processing events and actions

This detailed diagnostics allows you to quickly identify potential performance issues and more accurately analyze the behavior of your Zabbix server or proxy.
New options for displaying elements and links on maps
Maps in Zabbix have received several useful improvements:
1. Automatic label hiding
Labels for map elements (hosts) and links can now be set to Auto hide mode. Labels will automatically hide if the element or link is in an OK state and appear only when a problem arises or a value changes. This makes the maps clearer and easier to read.
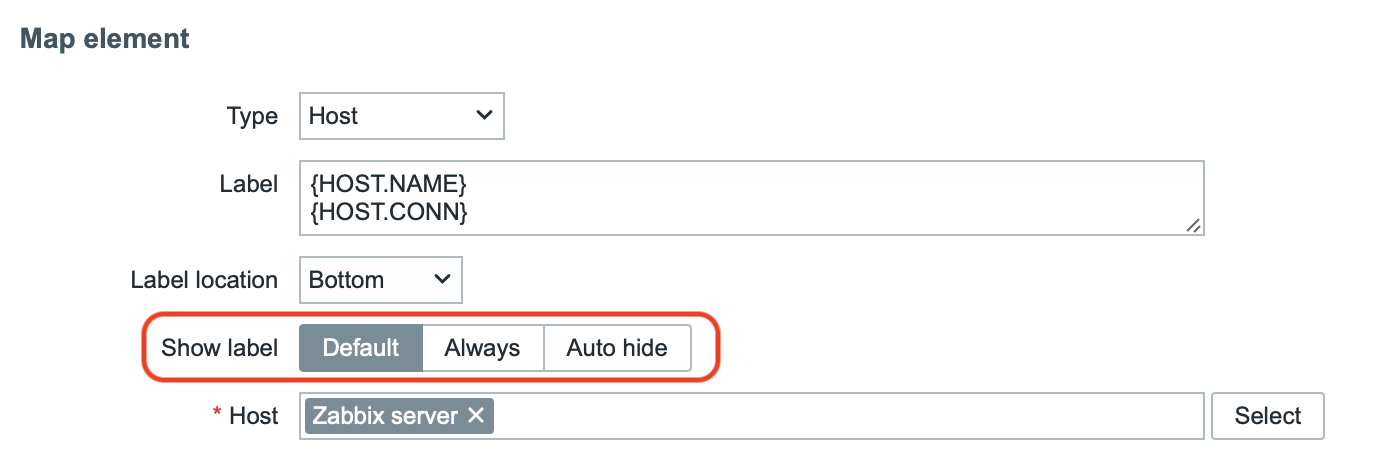
An example of the Auto Hide feature in action could look like this:
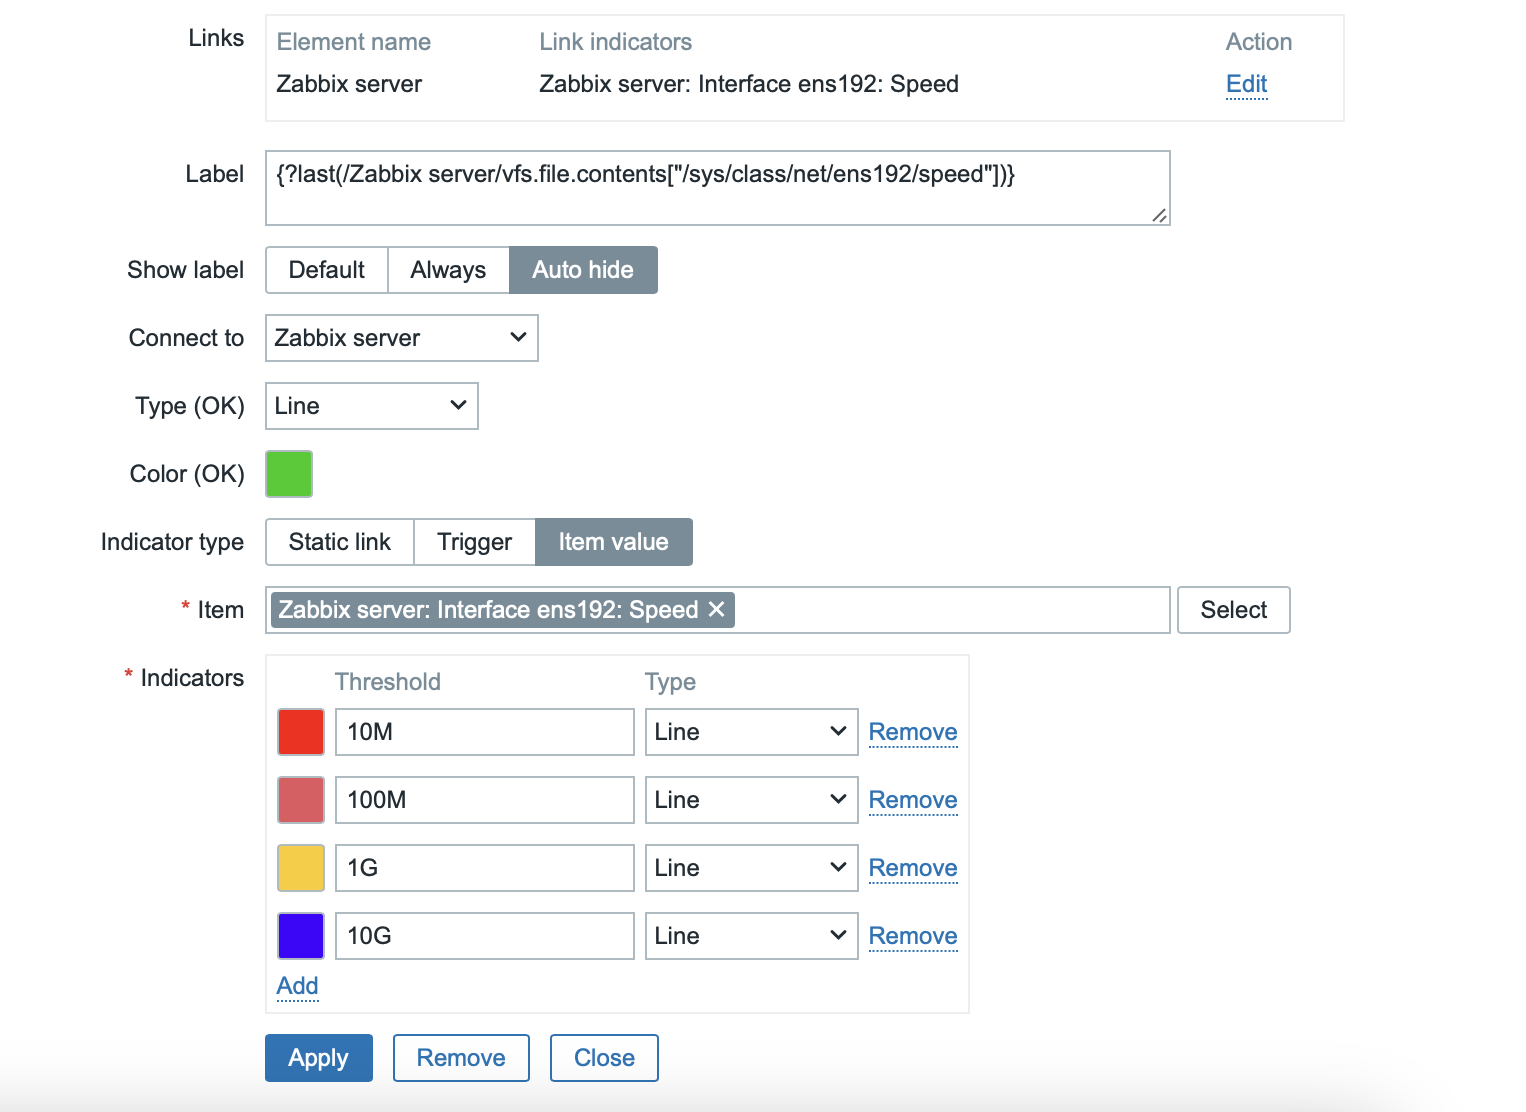
2. Item value indicators
You can now dynamically change the color and style of links between map elements based on the current item value. This makes it easy, for example, to visualize real-time speed or network link utilization directly on the map.
3. Dynamic display of elements and links
Map elements (hosts, links) can now be completely hidden based on their current state or item value. This ensures maximum clarity by displaying only relevant objects and connections.
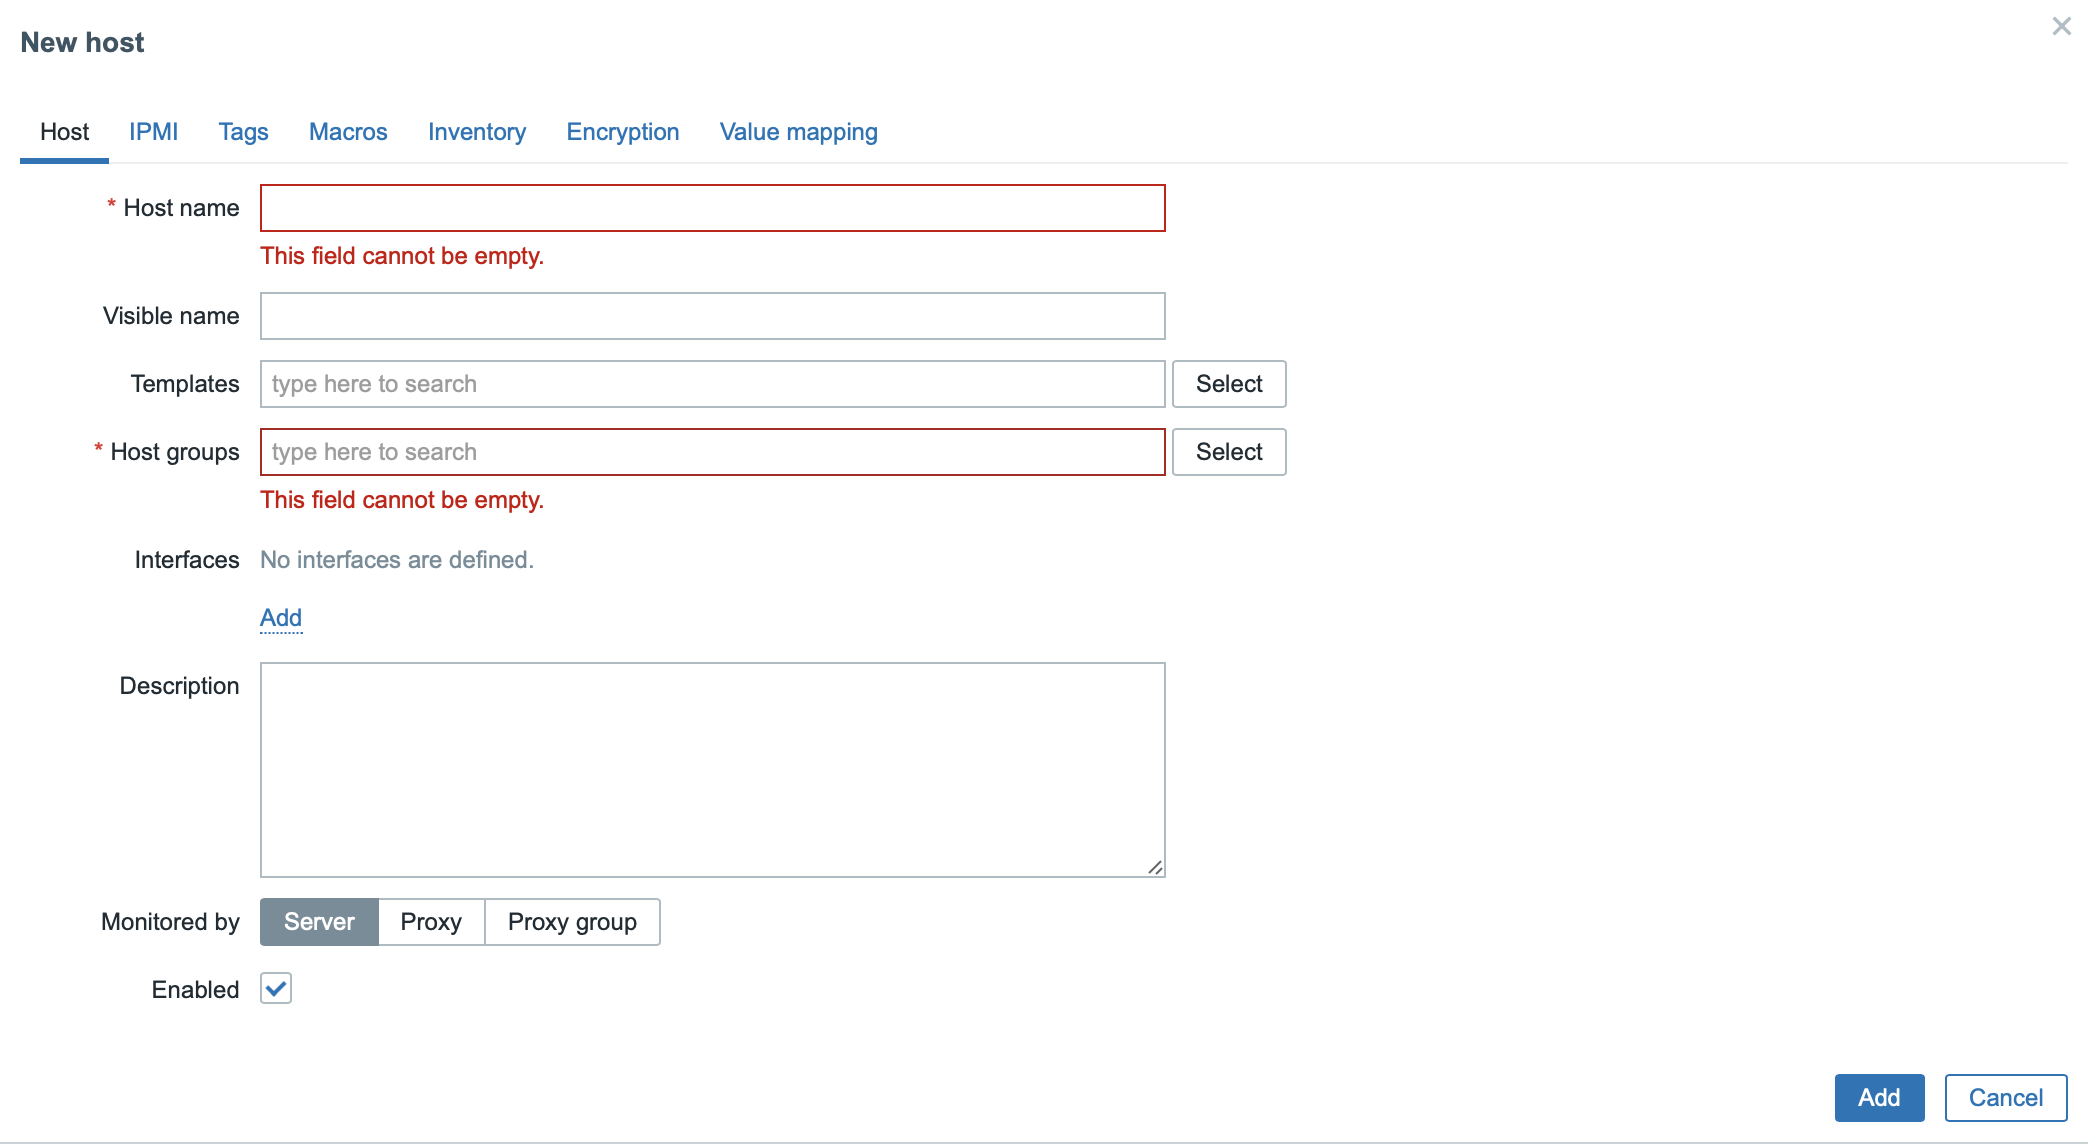
Inline validation in forms
Zabbix now offers instant form validation, which immediately alerts users to errors when entering values without having to submit or save the form. As soon as you fill in the individual fields, any errors are immediately displayed directly below the specific field, which significantly speeds up and simplifies configuration.
Inline validation is currently available for the following forms:
- Template configuration
- Host configuration
- Item configuration
- Trigger configuration
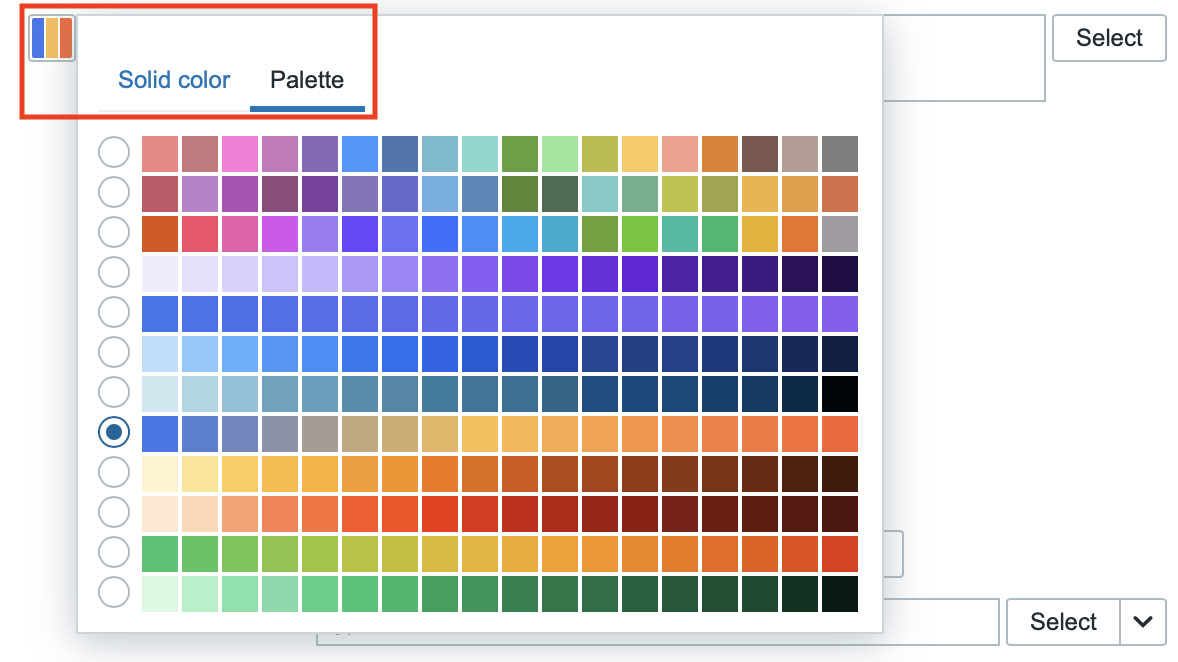
Improved color selection with palette support
The color selection in graph and pie widgets has been redesigned for better usability. In addition to selecting a single color and entering a hex code, you can now switch to the Palette tab and choose from predefined color series—each series gets a different shade for clearer differentiation. Selection now also fully supports keyboard control and immediately checks the correctness of the entered values.
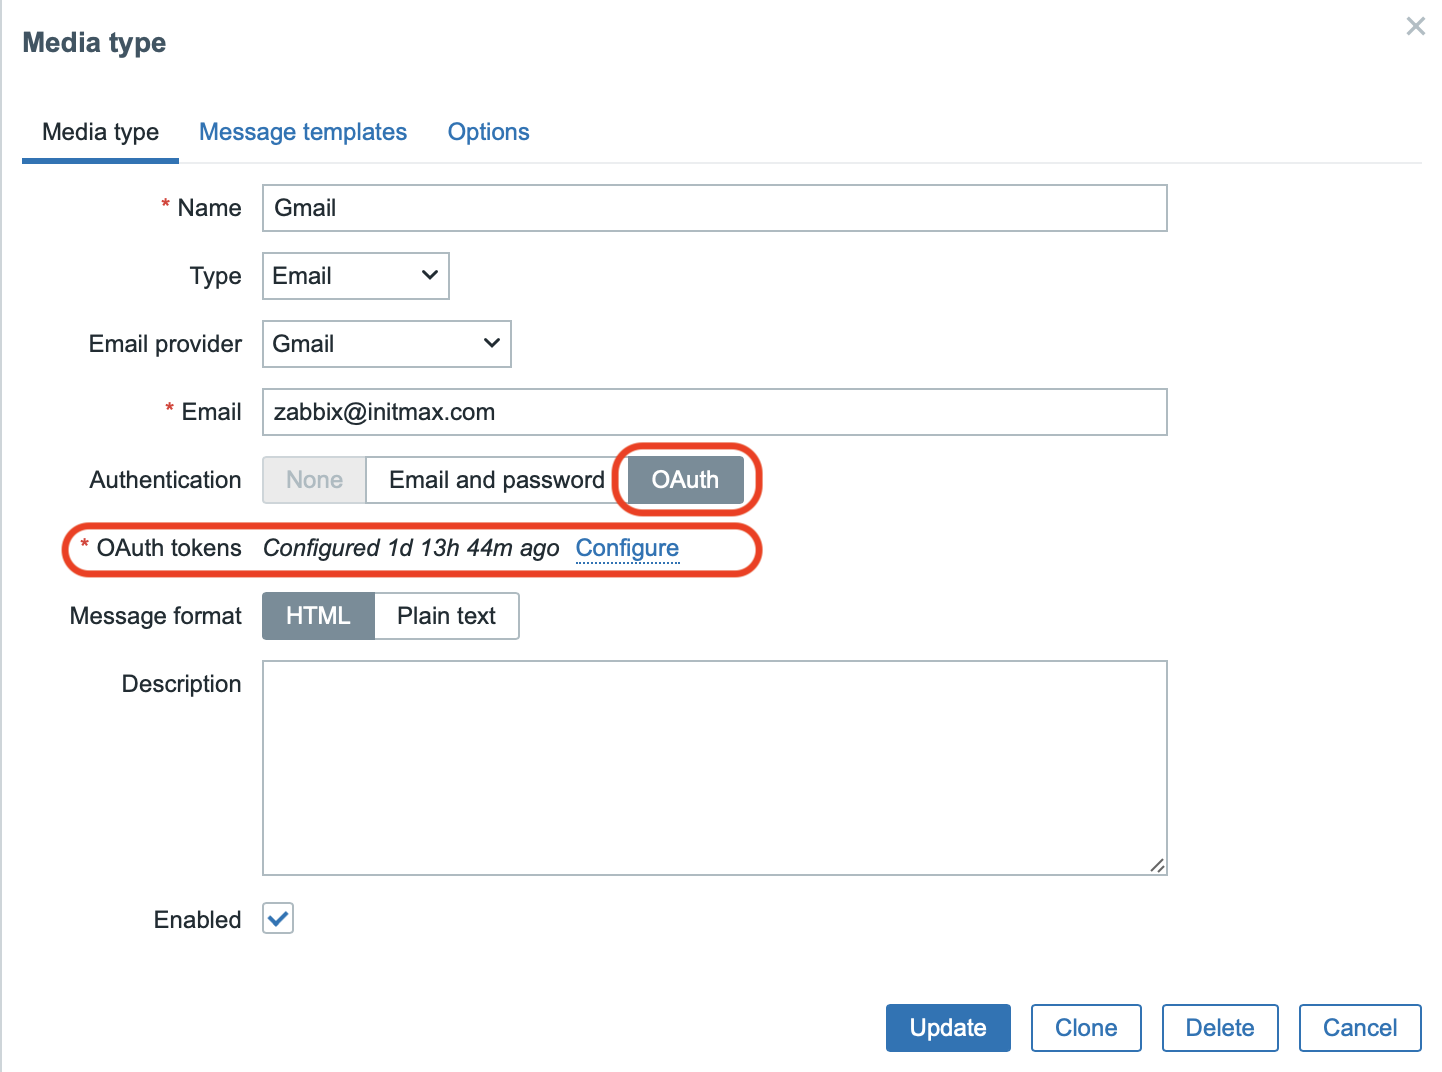
OAuth2 support for SMTP media
Zabbix now supports OAuth2 authentication for SMTP media types Generic, Gmail, and Microsoft. This enhancement provides greater security and is required by modern email service providers, who are gradually discontinuing support for traditional username-and-password authentication.
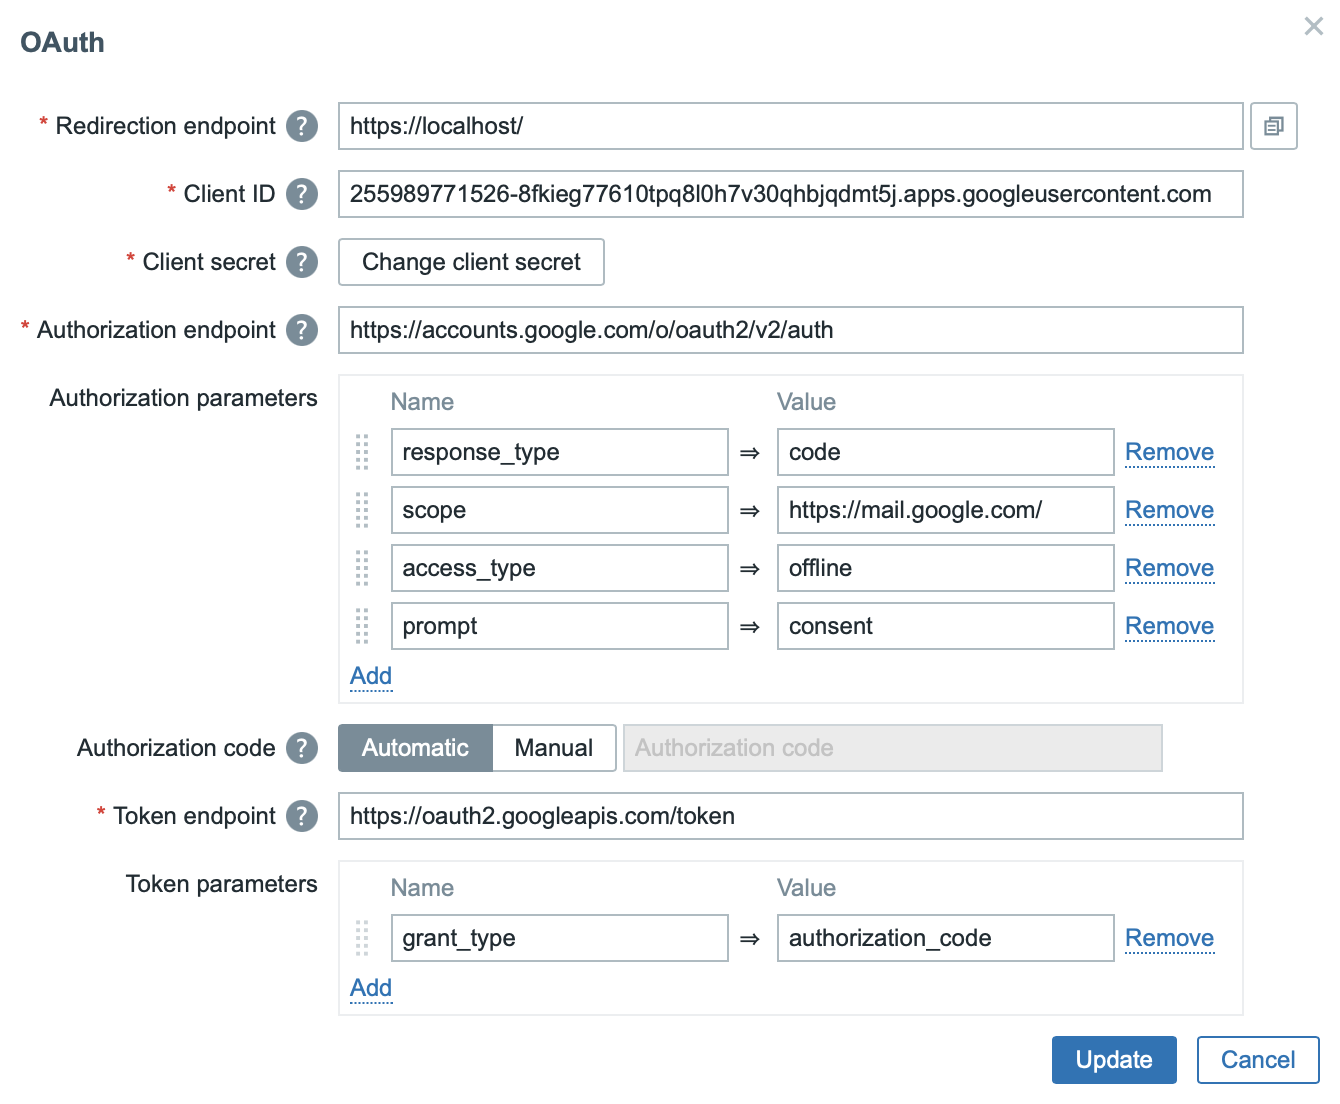
Example configuration for Generic SMTP:
For generic SMTP services, you’ll manually configure the endpoints and OAuth2 parameters according to your provider’s documentation:
- Redirection endpoint – The URL of your Zabbix server where the provider returns the authorization code.
- Client ID and Client Secret – Obtained from your OAuth2 provider.
- Authorization endpoint and Token endpoint – Configured according to your OAuth2 provider’s documentation.
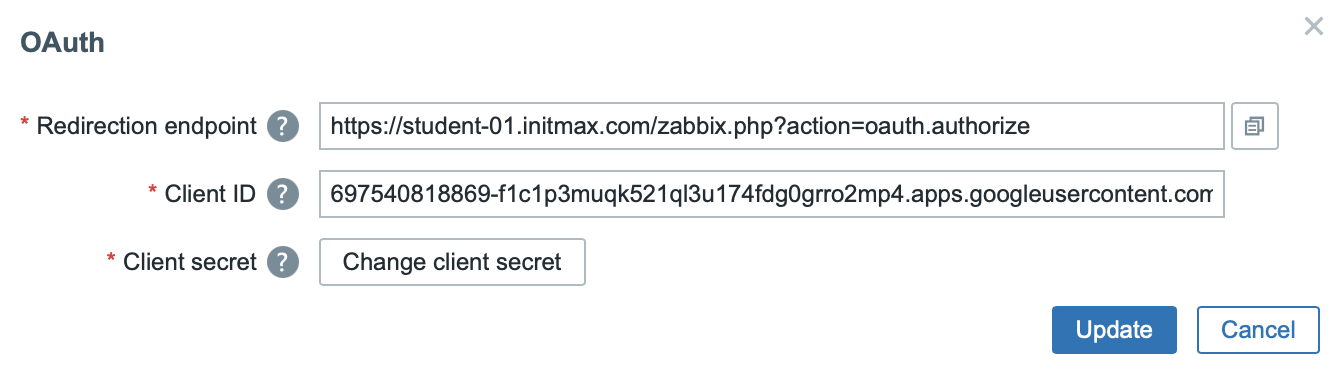
Example configuration for Gmail SMTP:
For Gmail, simply select the pre-configured Gmail option and enter your:
- Client ID
- Client Secret
- The URL of your Zabbix server as the Redirection endpoint (URL +
action=oauth.authorize). - The Redirection endpoint is filled in automatically, but only if the Frontend URL is set in Administration → General → Other.
All other parameters are set automatically.
⚠️ Note: Since May 30, 2022, Gmail no longer supports traditional password-based authentication. OAuth2 is now the only available authentication method for Gmail SMTP in Zabbix. We recommend migrating as soon as possible.

Management of historical cache
In some data collection scenarios, certain items may temporarily block the history in the cache server or proxy. This can cause delays in writing historical data to the database and slow down the entire system. The following improvements have been introduced to better manage the history cache:
- Manual cache clearing: A new runtime command history_cache_clear=target for the Zabbix server/proxy allows you to manually clear the history cache for a specific item based on its ID.
- Automatic cache clearing: If you disable an item, it is immediately removed from the history cache (except for its last value, which is retained for logging purposes). Similarly, when disabling an entire host, all its items are removed from the history cache (again, except for the last values).
- Cache diagnostic logging: If the history cache is full, the Zabbix server/proxy now writes diagnostic information about the cache status starting from DebugLevel=3 (previously from DebugLevel=4). The log contains items that have the most values stored in the cache.
Encryption of communication between frontend and server
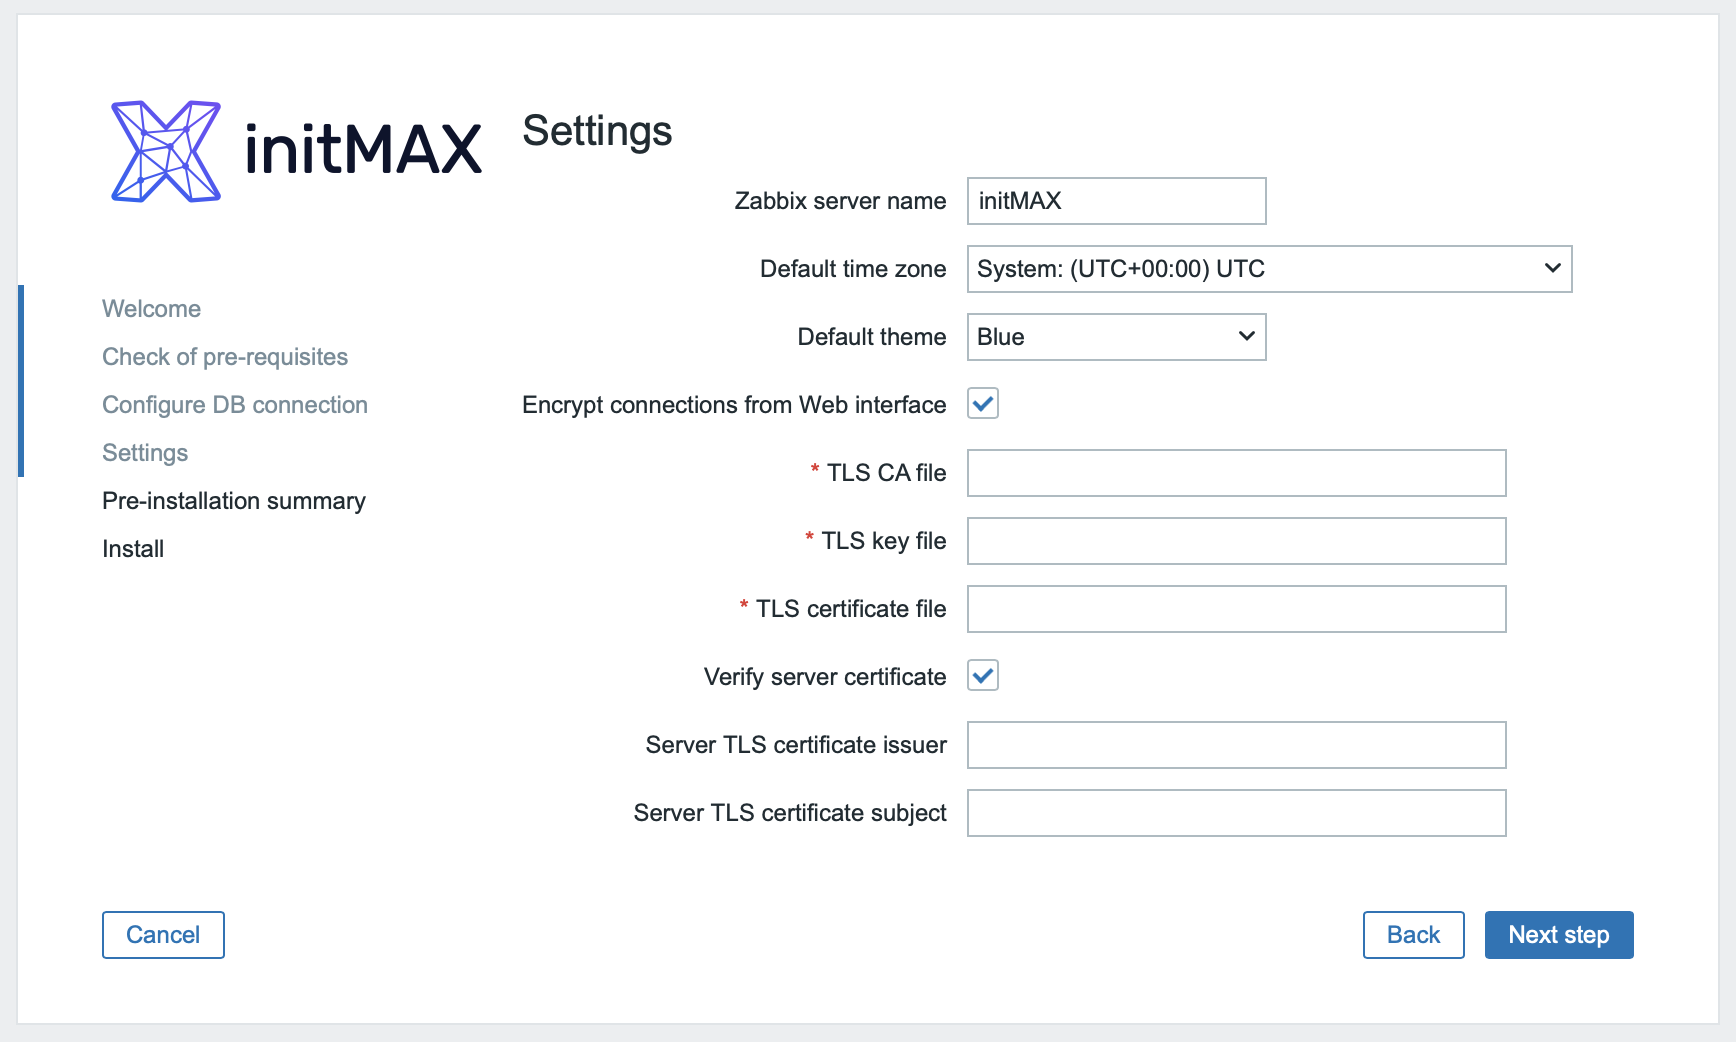
You can now secure communication between the frontend and the Zabbix server (trapper) using encryption. This is particularly useful in configurations with separate frontend and backend servers—typical in high-availability (HA) setups. Besides enabling TLS on the trapper itself (“TLSListen=required”), you can also encrypt communications between the proxy and the server, as well as between agents and proxy/server, ensuring all traffic runs exclusively over TLS.
Additionally, you now have the option to specify which frontend nodes are permitted to connect to the Zabbix server using the FrontendAllowedIP parameter, or whether only connections secured with certificates are allowed (TLSFrontendAccept=cert). Of course, the choice of using encryption or keeping communication open remains entirely up to you.
Summary of new features:
- Forced TLS for trapper (
TLSListen=required) - Encryption between proxy↔server, agent↔proxy/server
- Frontend whitelisting via IP/CIDR or DNS names (
FrontendAllowedIP) - Selection of incoming connection mode (
TLSFrontendAccept=certorunencrypted)
All these options in version 7.4 allow granular control—from “never encrypt” to “certificate-only”—depending on the level of security your infrastructure requires.
Overview of minor improvements
- Changed the default user session storage period from 365 days to 31 days.
- Increased maximum cache sizes for
HistoryCacheSize,HistoryIndexCacheSize, andTrendCacheSize:- HistoryCacheSize
Cache size for historical data (history), in bytes. This is the size of shared memory dedicated to storing historical data.
Default: 16M
Range: 128K–16G - HistoryIndexCacheSize
History index cache size, in bytes. Size of shared memory dedicated to indexing historical data stored in cache. The index cache requires approximately 100 bytes per cached item.
Default: 4M
Range: 128K–16G - TrendCacheSize
Trend cache size, in bytes. Size of shared memory dedicated to storing trend data.
Default: 4M
Range: 128K–16G
- HistoryCacheSize
- Proportional scaling of background images on maps
- Zabbix now allows you to proportionally scale background images on maps. With this new feature, the image automatically adjusts to the current map size without distortion or loss of quality.
New and updated templates
New Templates:
- Juniper MX series: Added a new template for monitoring Juniper MX network devices using the NETCONF protocol, enabling direct retrieval of statistics via the native interface.
- Azure MSSQL DTU: A new template allows monitoring of Database Transaction Unit (DTU) utilization for Azure databases through the REST API.
- Pure Storage FlashArray: Added a template for monitoring Pure Storage FlashArray storage systems using HTTP API (REST v1 and v2), including automatic discovery and tracking of capacity and performance metrics.
Updated Templates:
- Dell iDRAC and PowerEdge: Now utilizing SNMP walk items for more efficient data collection.
- Proxmox VE by HTTP: Added new items and triggers for monitoring disk space usage.
- MSSQL by ODBC: Corrected performance counter queries for improved accuracy in monitoring.
- Linux and Nextcloud: Removed unnecessary preprocessing steps from LLD rules to enhance performance.
- Microsoft 365 reports by HTTP: Improved descriptions for better clarity.
- PostgreSQL by Zabbix agent 2: Expanded support for PostgreSQL version 17.
Zabbix Download and Other Useful Links
- Zabbix 7.4 is available for download here: www.zabbix.com/download
- Full documentation for the new version can be found here: https://www.zabbix.com/documentation/7.4/en/manual/introduction/whatsnew740
As official partners and strong enthusiasts of the Zabbix platform, we offer comprehensive, top-level services in all areas of Zabbix monitoring. If you’re interested in a live demonstration of Zabbix installations at our customers’ sites, we’d be happy to show you Zabbix in action.

Give us a Like, share us, or follow us 😍
So you don’t miss anything: