
Zabbix Certified User
Zabbix Certified User training is an ideal starting point for Zabbix beginners, NOC team members, and anyone else who wants to get acquainted with the Zabbix GUI and learn how to leverage a variety of Zabbix views, filters, and dashboard features for tracking and analyzing collected metrics and detected problems.
Information about the course
| Designed for the product: | Zabbix 8.0 |
|---|---|
| Group size: | Up to 50 students virtually |
| Type of exam: | 30 min, theoretical |
| Requirements: | None |
| Next level: | Zabbix Certified Specialist (Level 2) |
| Course language: | English or Czech — your choice for requested dates |
| Training format: | Online · Hybrid · On-site |
| Course length: | 1 DAY |
| Course price: | 14 300,-€590$660 excluding VAT |
Course content
One-day course
- Zabbix overview
- Zabbix user interface
- User profile
- Accessing, viewing, and filtering the collected metrics
- Zabbix inventory features
- Logical host grouping with Host groups
- Viewing and filtering detected problems
- Acknowledging, updating, and suppressing problems
- Cause and symptom problems
- Zabbix alerting feature overview
- Accessing and reading Zabbix graphs
- Displaying environment status on network maps
- Working with Zabbix dashboards and widgets
- Zabbix Application performance monitoring feature overview
- Built-in reports
- Business service monitoring and SLAs
- Zabbix mobile application overview

Tomáš Heřmánek
CEO & Zabbix Certified TrainerAdditional information
Certificate
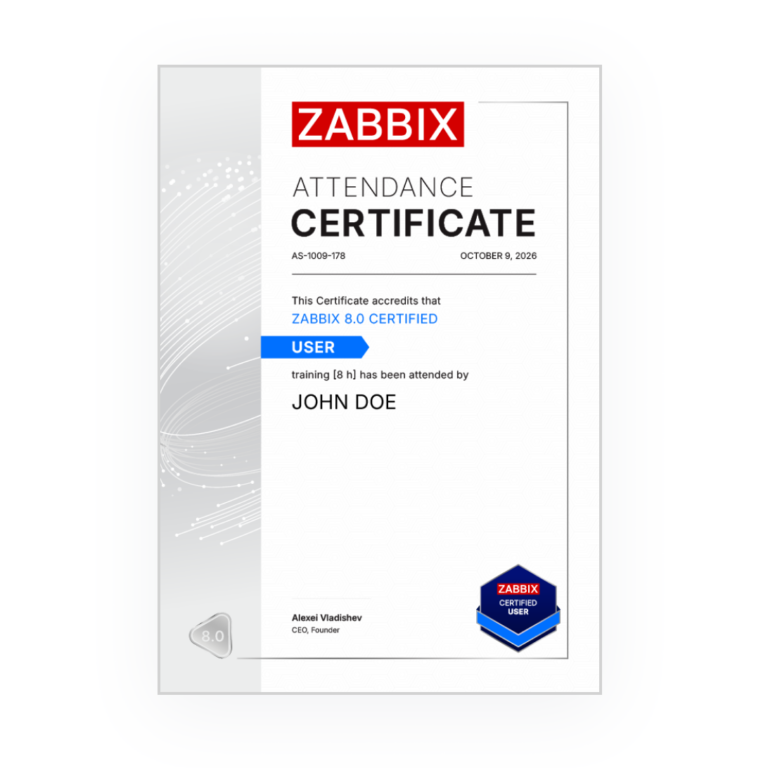
- Each participant will receive a certificate of attendance of the Zabbix 8.0 course.
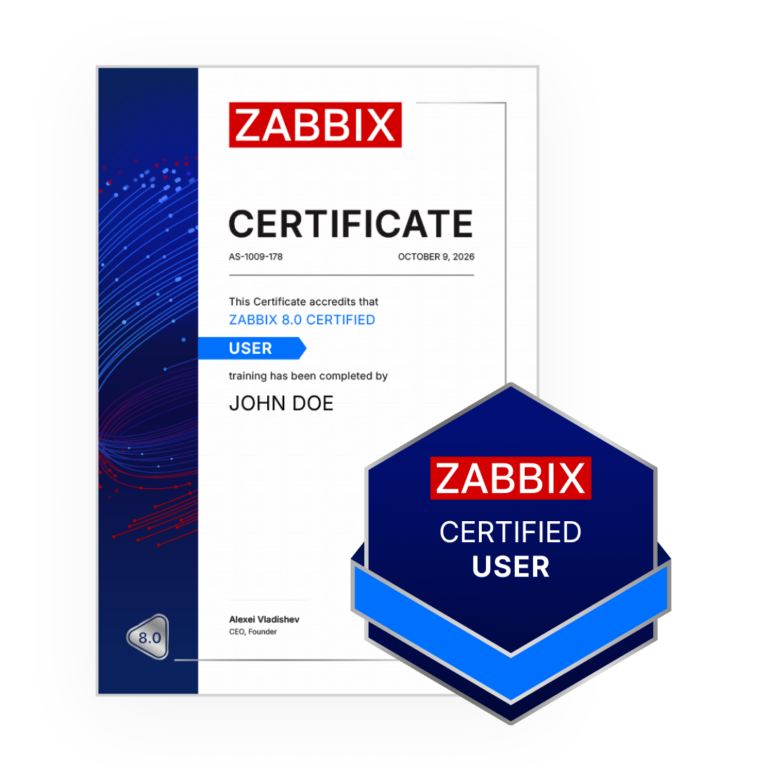
- After successfully passing the exam, you will receive the Zabbix 8.0 Certified User certificate and digital badge. The User certificate is issued electronically.

Certificates and gifts for the course
For all attendees
For passing the exam
Acquired skills and knowledge
Navigate the Zabbix GUI
Learn how to adjust the Zabbix GUI and quickly navigate between Zabbix sections.
Access and filter data
Leverage the provided tools to quickly filter for and display the required data in a variety of views.
Track inventory information
Utilize the Zabbix inventory feature to centrally track and manage your host inventory information.
Manage detected problems
Acknowledge, update, or suppress detected problems based on the current state of your infrastructure.
Understand your environment
Use the Zabbix interface to focus on the most pressing issues affecting your environment.
Configure and interact with dashboards
Visually track your metric history and current infrastructure state with a variety of dashboard widgets.
Outcomes
Organizational impact
A proper understanding of the Zabbix GUI and the available toolset for viewing and filtering data will enable NOC teams and Zabbix administrators to quickly pinpoint root cause issues, understand the additional context information provided by Zabbix, and track collected metrics over time in a variety of views.
Individual impact
After finishing the course, attendees will be familiar with the Zabbix GUI. This will allow them to acknowledge, react to, and understand the problems detected by Zabbix while tracking data points and system states in dashboards and maps.