itemMAX
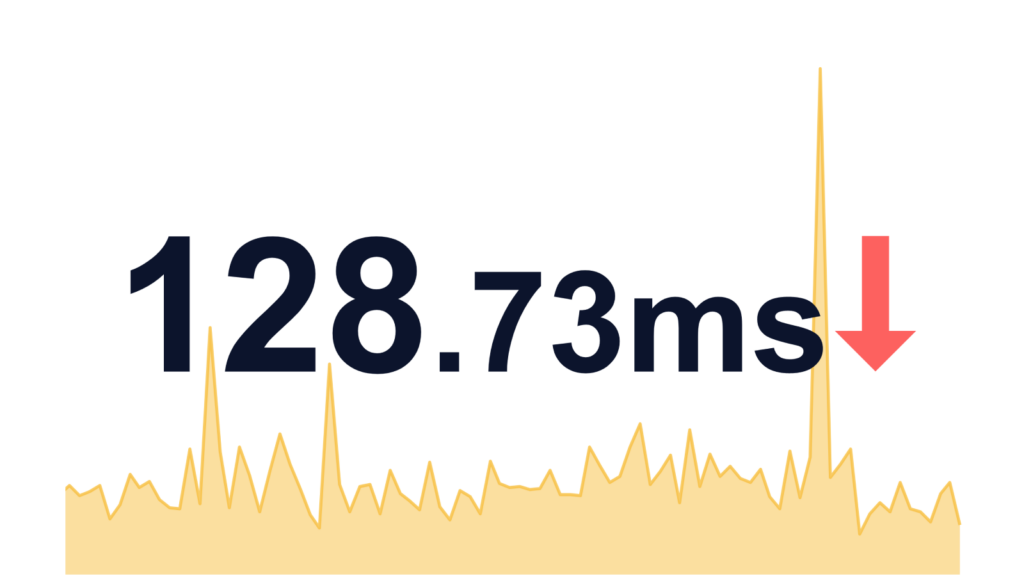
This advanced widget significantly enhances the functionality of the classic Item Value widget by integrating a visualization of historical data directly into the background. The current value is prominently displayed in the foreground, while a compact graph in the background provides valuable context and allows for tracking data evolution over time.
Requirements
Supported Zabbix version
7.0
Min. supported PHP version
8.0
Key features
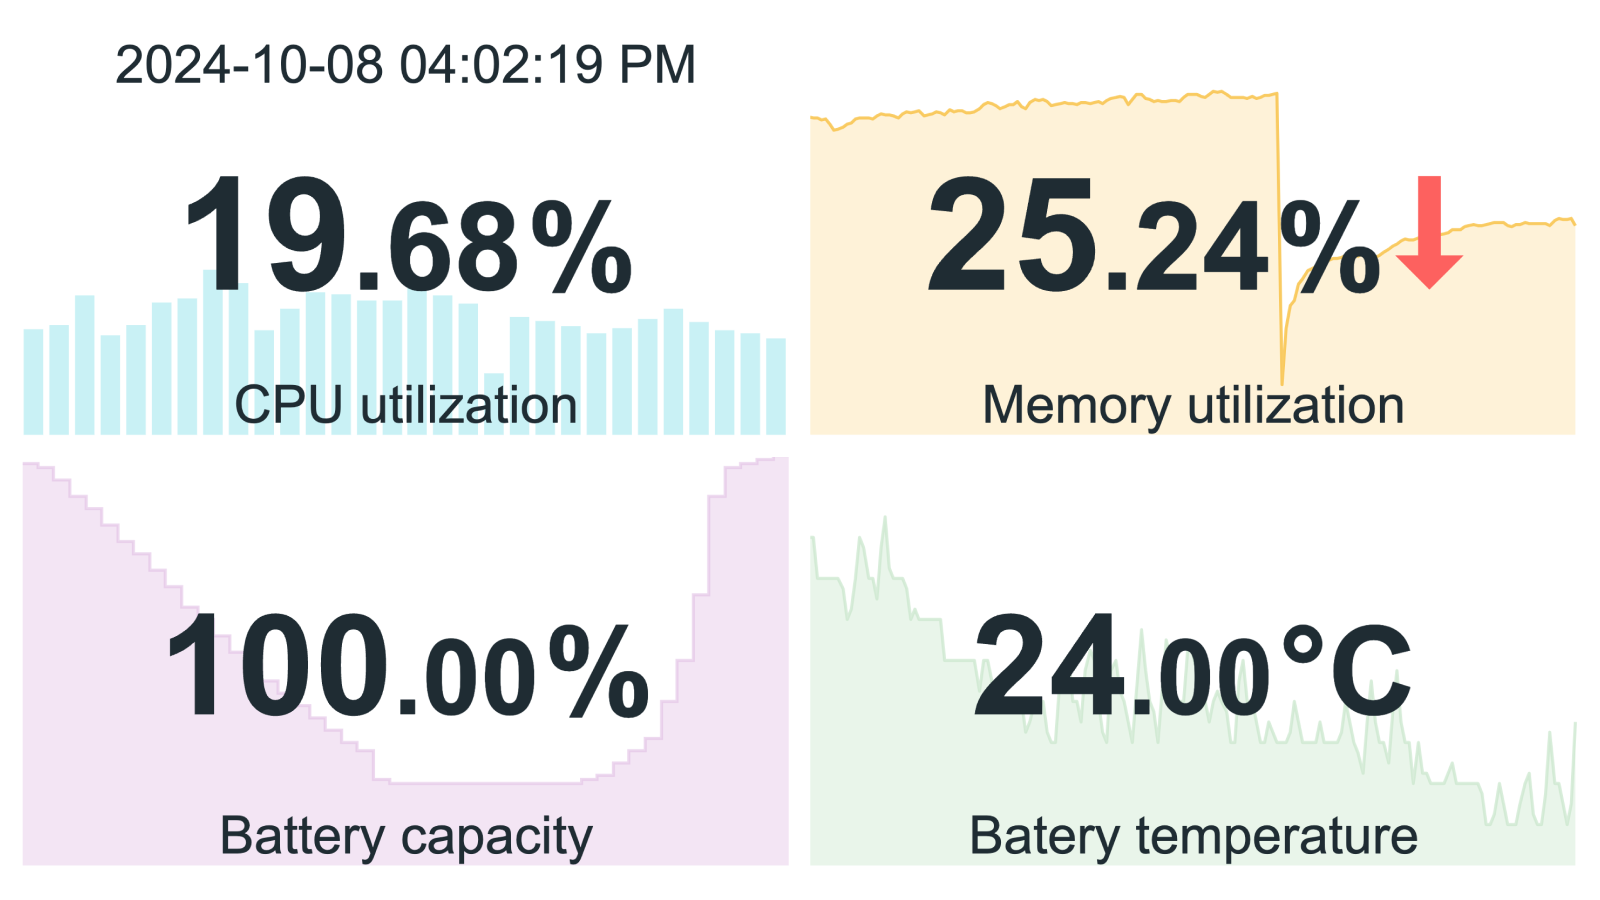
The widget combines current value display with historical data graphing, enabling quick trend analysis. Users can choose between line, staircase, or bar graphs to best represent their data.
Aggregation functions are supported, allowing efficient processing of large datasets or varying time periods. The time range for historical data is customizable, providing flexibility in trend observation.
An override host feature allows users to specify which host’s data is displayed, facilitating monitoring across different systems or devices.
This compact tool is ideal for real-time monitoring with historical context, suitable for applications in IT infrastructure or environmental monitoring. It empowers users to make informed decisions based on both current and historical data trends.
Documentation
Access detailed documentation in our product wiki, including step-by-step setup, system requirements, customization options, and real-use configurations.
Editions
Free
99 $
without VAT
All features of ‘Item value’ widget
Graph in the background visualizes historical data
Customizable graph settings
├ Line, Staircase, and Bar graph types
├ Adjustable graph width
├ Graph transparency control
├ Fill level adjustment
├ Color selection for graph in the background
├ Aggregation function (e.g., average)
├ Custom aggregation intervals
├ Handling of missing data
├ Customizable time period for data display
├ Min and Max Y-axis customization
Editions
Free
All features of ‘Item value’ widget
Graph in the background visualizes historical data
Customizable graph settings
├ Line, Staircase, and Bar graph types
├ Adjustable graph width
├ Graph transparency control
├ Fill level adjustment
├ Color selection for graph in the background
├ Aggregation function (e.g., average)
├ Custom aggregation intervals
├ Handling of missing data
├ Customizable time period for data display
├ Min and Max Y-axis customization
99 $
All features of ‘Item value’ widget
Graph in the background visualizes historical data
Customizable graph settings
├ Line, Staircase, and Bar graph types
├ Adjustable graph width
├ Graph transparency control
├ Fill level adjustment
├ Color selection for graph in the background
├ Aggregation function (e.g., average)
├ Custom aggregation intervals
├ Handling of missing data
├ Customizable time period for data display
├ Min and Max Y-axis customization
Software distribution
Distribution & Repository access
Editions labeled as Free are openly accessible through our public Git repository. Premium editions (like Pro and Enterprise) are delivered through our secure private Git repository, which serves as the central distribution point for our maintained software. Upon purchase, you’ll receive immediate access credentials to this repository, where you can download your products, access documentation, and get all future updates compatible with your Zabbix LTS installation.
Access & Ownership
When you purchase a paid edition, you gain lifetime access to the product version you download. The purchase includes one full year of updates and maintenance, during which we ensure compatibility with the latest minor version of Zabbix LTS. Our development team continuously maintains and improves the products, providing regular updates, security patches, and new features.
Subscription model
Our subscription is designed to auto-renew annually, ensuring uninterrupted access to our private repository where we maintain the latest versions of our products. This subscription model guarantees that you always have access to the most recent updates, security fixes, and feature enhancements. While you retain permanent access to your downloaded version, maintaining an active subscription ensures you benefit from ongoing product improvements and compatibility updates. For detailed subscription terms, please refer to our Terms and Conditions.
Similar products
headerMAX
Zabbix widget that allows users to create section headers, embed images, or add buttons with customisable URL links in the dashboard UI.
ChatGPT
The ChatGPT widget integrates AI capabilities into your Zabbix dashboard, allowing interaction with OpenAI models directly from the widget.
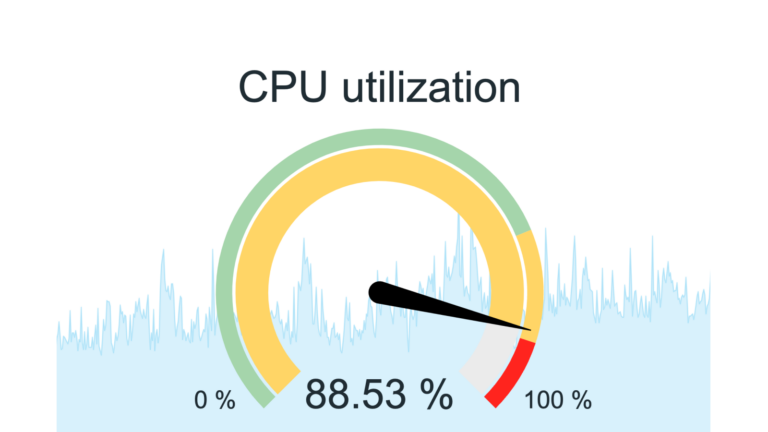
gaugeMAX
This widget builds on the ‘Gauge’ widget by adding a background graph for historical data, clearly showing the current value alongside visualized trends.
FAQ
Select the desired widget on the product page, which also has a paid version. You can try out the DEMO version of each paid product and then purchase the PRO version, which adds more features to the widget. You click on the Get widget and Get PRO button, go through the checkout where you need to agree to the terms of purchase and other necessary. You proceed to the cart where you pay for the product. You can pay by card, Google Pay or Apple Pay if you have an Apple device. Payment is facilitated by FastSpring. After payment, you will receive a confirmation email with the necessary details to log in to Gitlab where you can download the purchased product. You’ll also receive an invoice for your order and access to your account, where you can see all your orders and cancel your auto-renewal subscription. The products are sold by subscription for 1 year. This is 1 license for 1 user, which is tied to a specific email.
If you lose your access data for a purchased product, click the “Forgot your password?” link on the login page at https://git.initmax.com/users/sign_in. Enter the email address you used when purchasing the product to receive password reset instructions. If you encounter any issues with the password reset process, please contact our support team at [email protected] for assistance.
You will need to have Zabbix 7.0 and PHP version 8.0 installed and running. In terms of hardware, you need any device that will run Zabbix correctly.
You will receive an email confirmation of the successfully paid order and an invoice for the purchased product. You will also find a link to access and manage your subscriptions. You will also receive an email with a link to the initMAX GitLab where you can find the purchased product. You will need to set a new password first if it is the first your product purchased from initMAX. Regardless if you already have a GitLab account for other purposes. To do this, go to the link: https://git.initmax.com/users/sign_in and press the Forgot your password? enter the email you entered when you placed your order and press the Reset password button. You will receive an email with a link to set a new password. Then log in via https://git.initmax.com/users/sign_in with the new password and the email you entered when you placed your order. You can also click directly on the link of the product you purchased, which will be sent to you in the order confirmation email, to log in there. You can now access and download the purchased product.